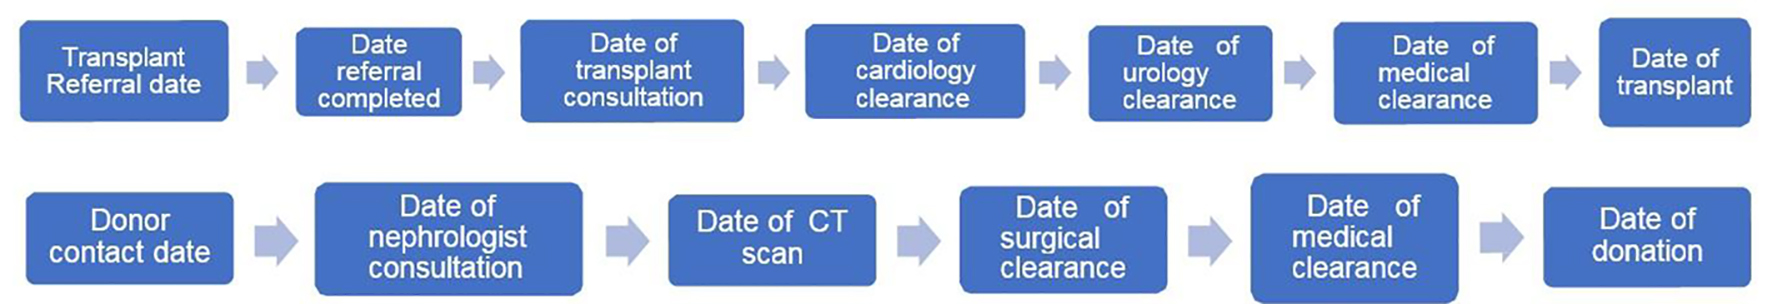
Figure 1. Recipient and donor evaluation process.
| Journal of Clinical Medicine Research, ISSN 1918-3003 print, 1918-3011 online, Open Access |
| Article copyright, the authors; Journal compilation copyright, J Clin Med Res and Elmer Press Inc |
| Journal website https://www.jocmr.org |
Original Article
Volume 13, Number 1, January 2021, pages 1-8
Low Rates of Preemptive Kidney Transplantation: A Root Cause Analysis to Identify Opportunities for Improvement
Figures
Tables
| Characteristics | Failed to achieve a preemptive transplant, % (n = 39) | Achieved a preemptive transplant, % (n = 11) | P value |
|---|---|---|---|
| ESRD: end-stage renal disease. | |||
| Recipients | |||
| Age, years, mean ± SD | 50 ± 16 | 46 ± 15 | |
| Male recipient | 69% | 55% | 0.12 |
| Cause of ESRD | |||
| Diabetes | 18% | 18% | 1 |
| Hypertension | 5% | 9% | 0.53 |
| Cystic kidney disease | 18% | 18% | 0.67 |
| Glomerulonephritis | 38% | 45% | 1 |
| Others | 21% | 9% | 0.69 |
| Donors | |||
| Age, years, mean ± SD | 47 ± 16 | 45 ± 8 | |
| Male donor | 60% | 63% | 1 |
| Relationship to recipient | |||
| Spouse | 18% | 27% | 0.4 |
| Related | 32% | 36% | 1 |
| Unrelated | 50% | 36% | 1 |
| First donor evaluated | 64% | 64% | 1 |
| Location of residence | |||
| Out of province | 12% | 9% | 1 |
| Out of country | 2% | 0% | 1 |
| eGFR (mL/min/1.73 m2) | Failed to achieve a preemptive transplant, % (n = 39) | Achieved a preemptive kidney transplant, % (n = 11) | P value |
|---|---|---|---|
| eGFR: estimated glomerular filtration rate. | |||
| Less than 15 | 77.3% | 36% | 0.052 |
| 15 to 20 | 18.2% | 55% | 0.049 |
| Greater than 20 | 4.5% | 9% | 1 |
| eGFR (mL/min/1.73 m2) | Unadjusted | Adjusted¶ | ||||||
|---|---|---|---|---|---|---|---|---|
| Odds ratio | 95% confidence interval | P value | Odds ratio | 95% confidence interval | P value | |||
| Lower | Upper | Lower | Upper | |||||
| *Represent the odds of “preemptive kidney = achieved” vs. “preemptive kidney = failed”. ¶Adjusted for age, sex and cause of ESRD. +Statistically significant. eGFR: estimated glomerular filtration rate. | ||||||||
| Less than 15 | Reference | |||||||
| 15 to 20 | 9.71 | 1.08 | 87.31 | 0.042+ | 10.69 | 0.92 | 124.91 | 0.059 |
| Greater than 20 | 0.14 | 0.02 | 0.84 | 0.032+ | 0.03 | < 0.001 | 0.34 | 0.005+ |
| Median (days) | Range | |
|---|---|---|
| †Three polycystic kidney disease recipients had longer wait times between initial assessment and clearance due to delayed nephrectomies just prior to reaching end-stage renal disease and transplant. *The time interval between recipient referral and their donor completing the donor questionnaire. ∧The negative result in this range is due to five donors who contacted the program prior to their respective recipient’s referral. Also, the range is affected by whether multiple donors contacted the program at varying stages before a suitable donor was found. | ||
| Recipient milestones (n = 50) | ||
| Referral to initial testing | 34 | 4 - 200 |
| Pre-referral testing to transplant nephrologist consultation | 38 | 12 - 145 |
| Consultation to recipient clearance | 324 | 63 - 1,945† |
| Recipient clearance to transplantation | 90 | 22 - 1,176† |
| Recipient referral to clearance for transplant | 408 | 149 - 2,014† |
| Donor milestones (n = 50) | ||
| Questionnaire returned to initial testing | 44 | 5 - 403 |
| Initial testing completion to donor nephrologist consultation | 49 | 5 - 136 |
| Donor nephrologist consultation to donor clearance | 120 | 7 - 255 |
| Donor questionnaire returned to donor clearance | 241 | 61 - 506 |
| Recipient referral to donor questionnaire completion* | 106 | -183 - 1,611∧ |