Figures
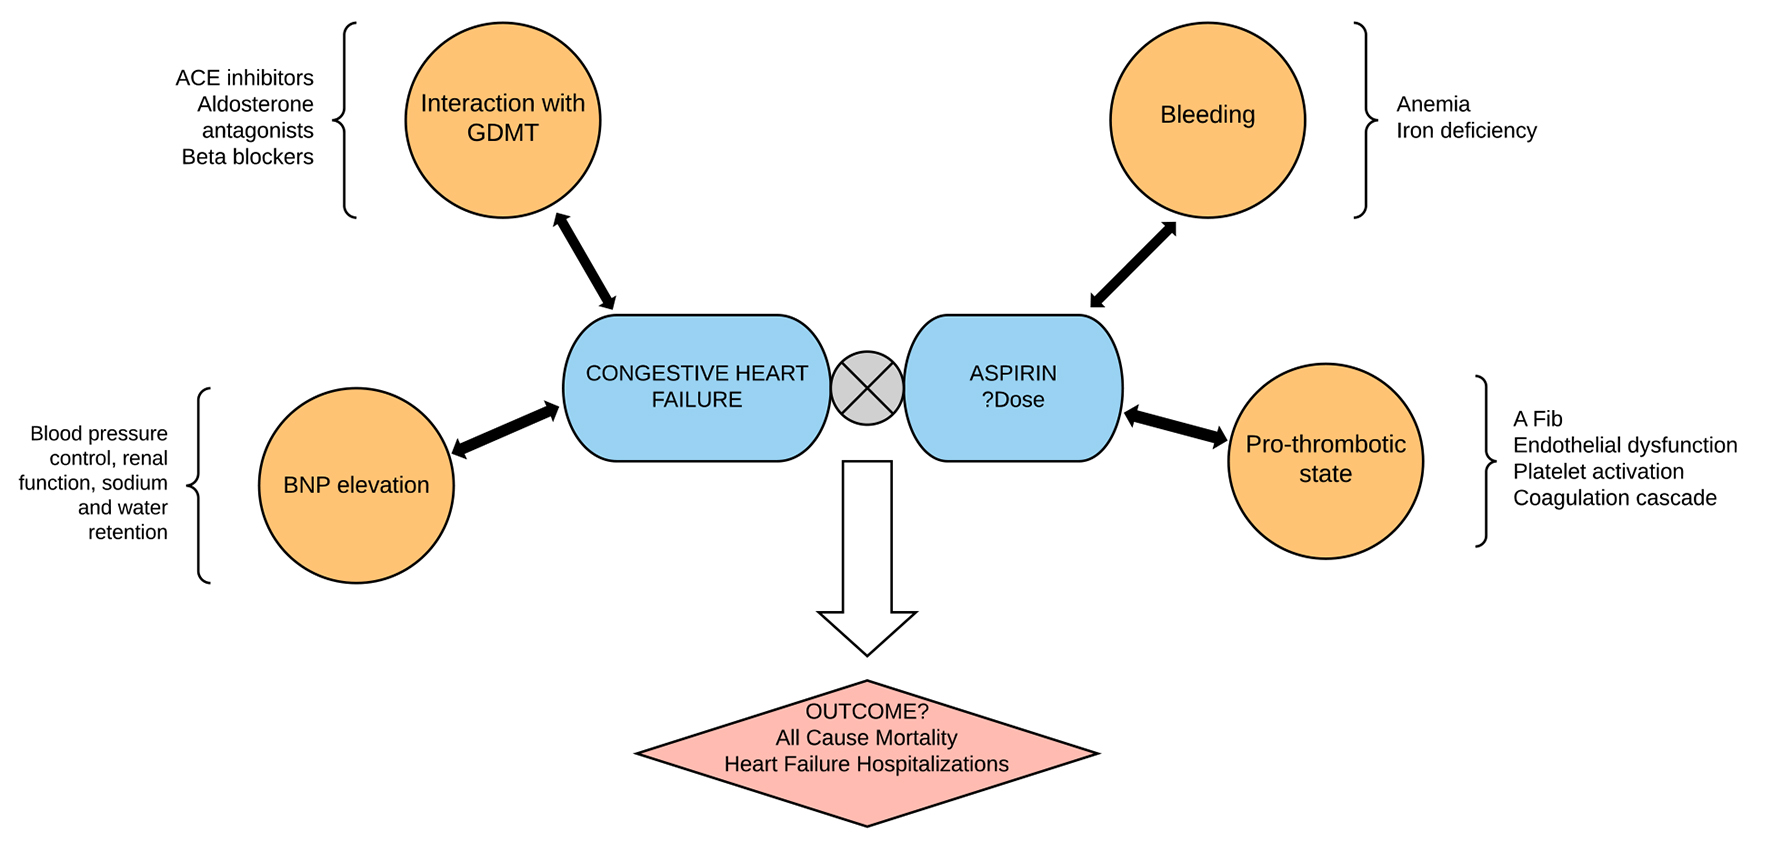
Figure 1. The use of aspirin in heart failure is complicated by the interaction of aspirin with goal-directed medical therapy in heart failure and the multiple pathophysiologic mechanisms in heart failure. The hard outcomes of aspirin use in patients with heart failure therefore have to do with the balance of such interaction and the homeostasis between bleeding and anti-thrombotic effects of aspirin. This study summarizes the mortality and heart failure outcomes with aspirin use in heart failure patients.
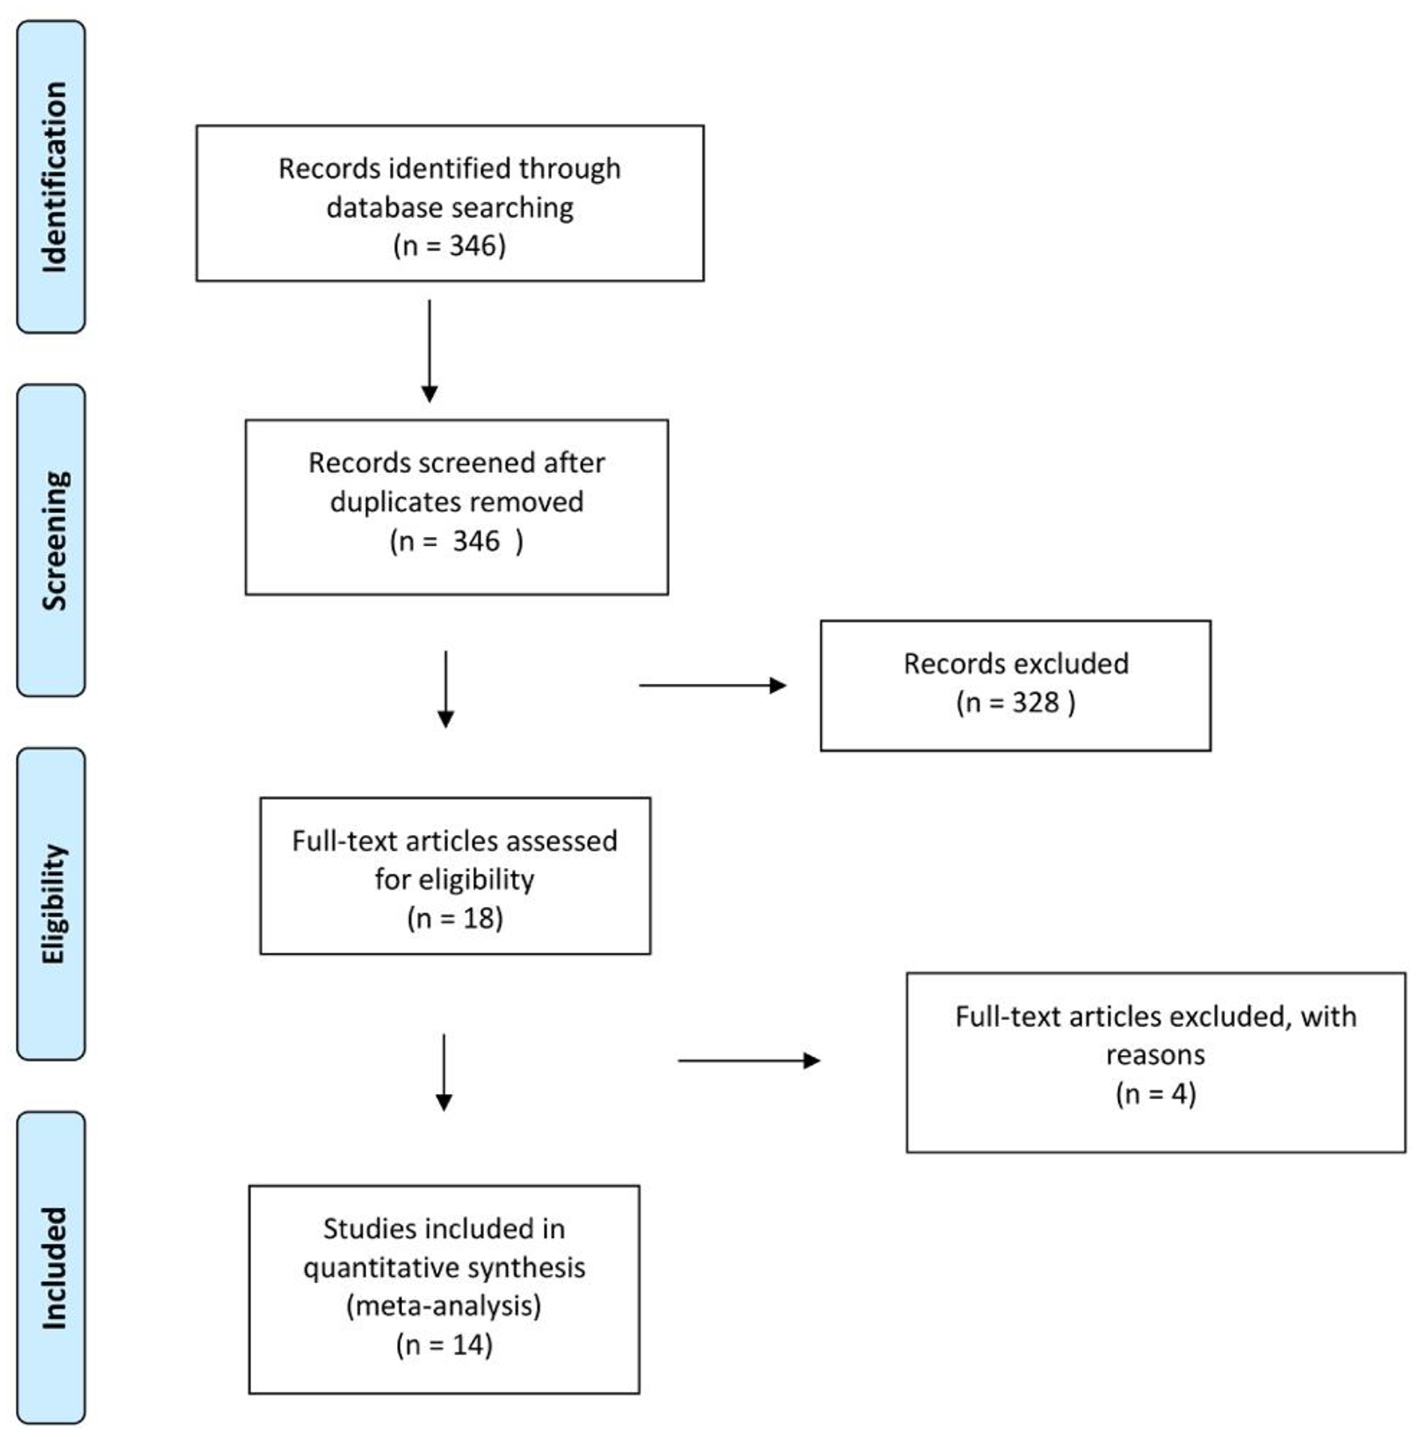
Figure 2. Preferred reporting items for systematic reviews and meta-analyses (PRISMA) flowchart of selection.
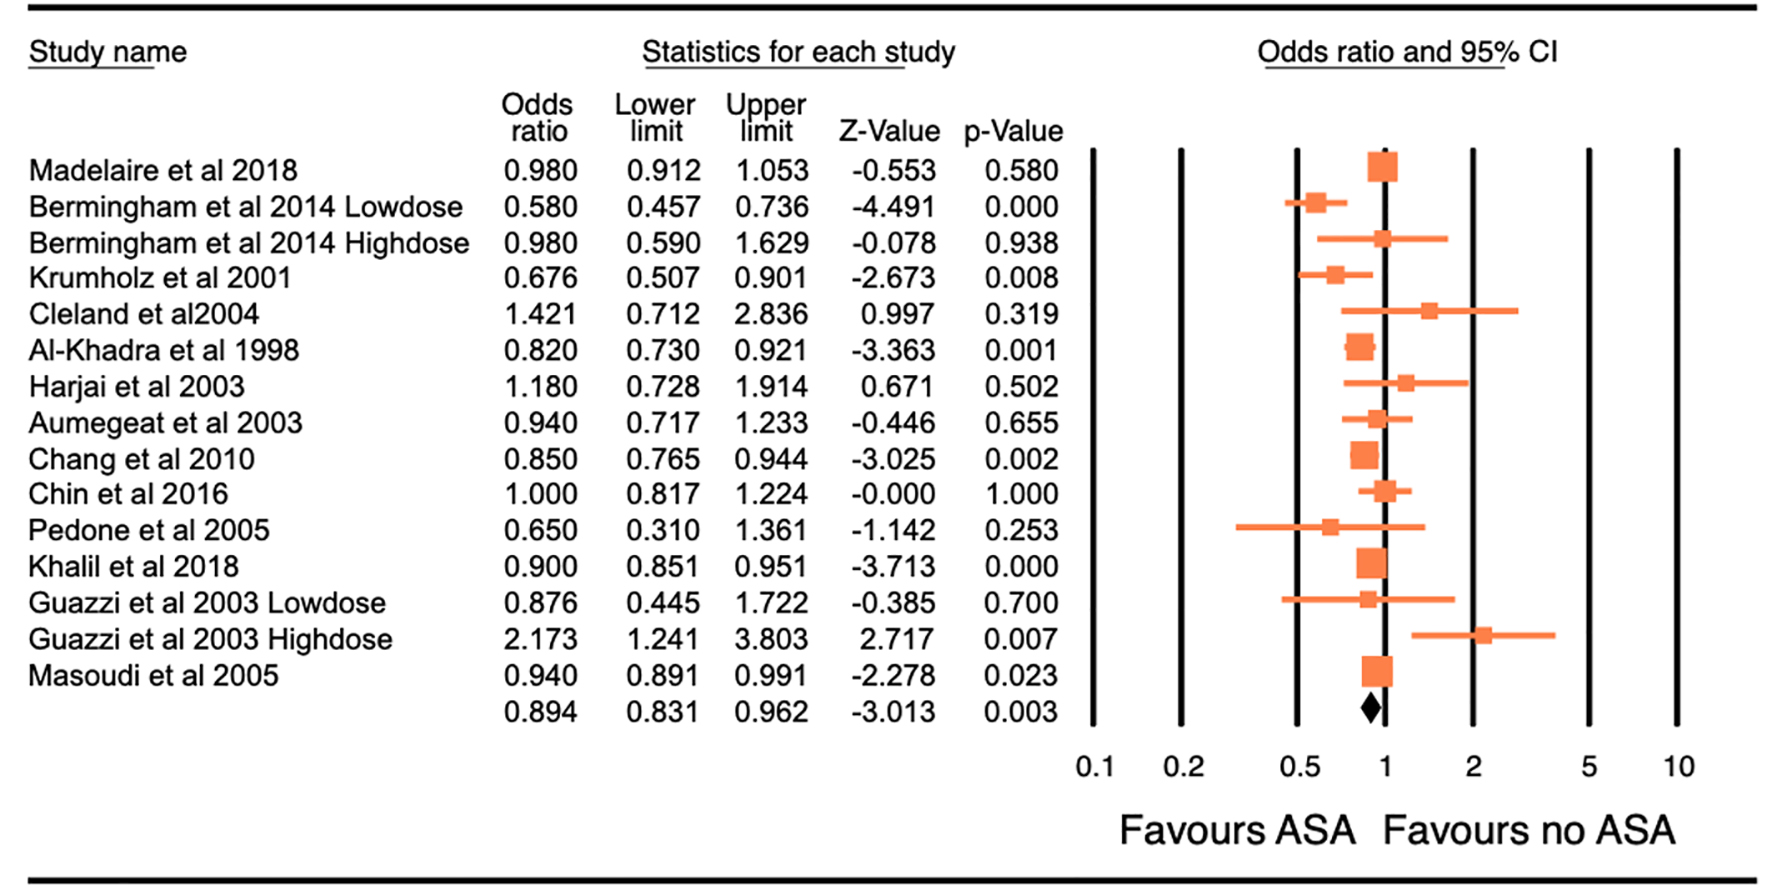
Figure 3. Forest plot of the odds ratio (OR) of all-cause mortality with the use of aspirin in patients with congestive heart failure. The overall significance of the results (OR: 0.894, 95% confidence interval (CI): 0.831 - 0.962, P = 0.003), with the heterogeneity (I2 = 66.70%). The estimate of the OR of each study corresponds to the middle of the squares, and the horizontal line shows the 95% CI. Pooling model using random (I-V heterogeneity) and the pooled OR estimated by weighting methods.
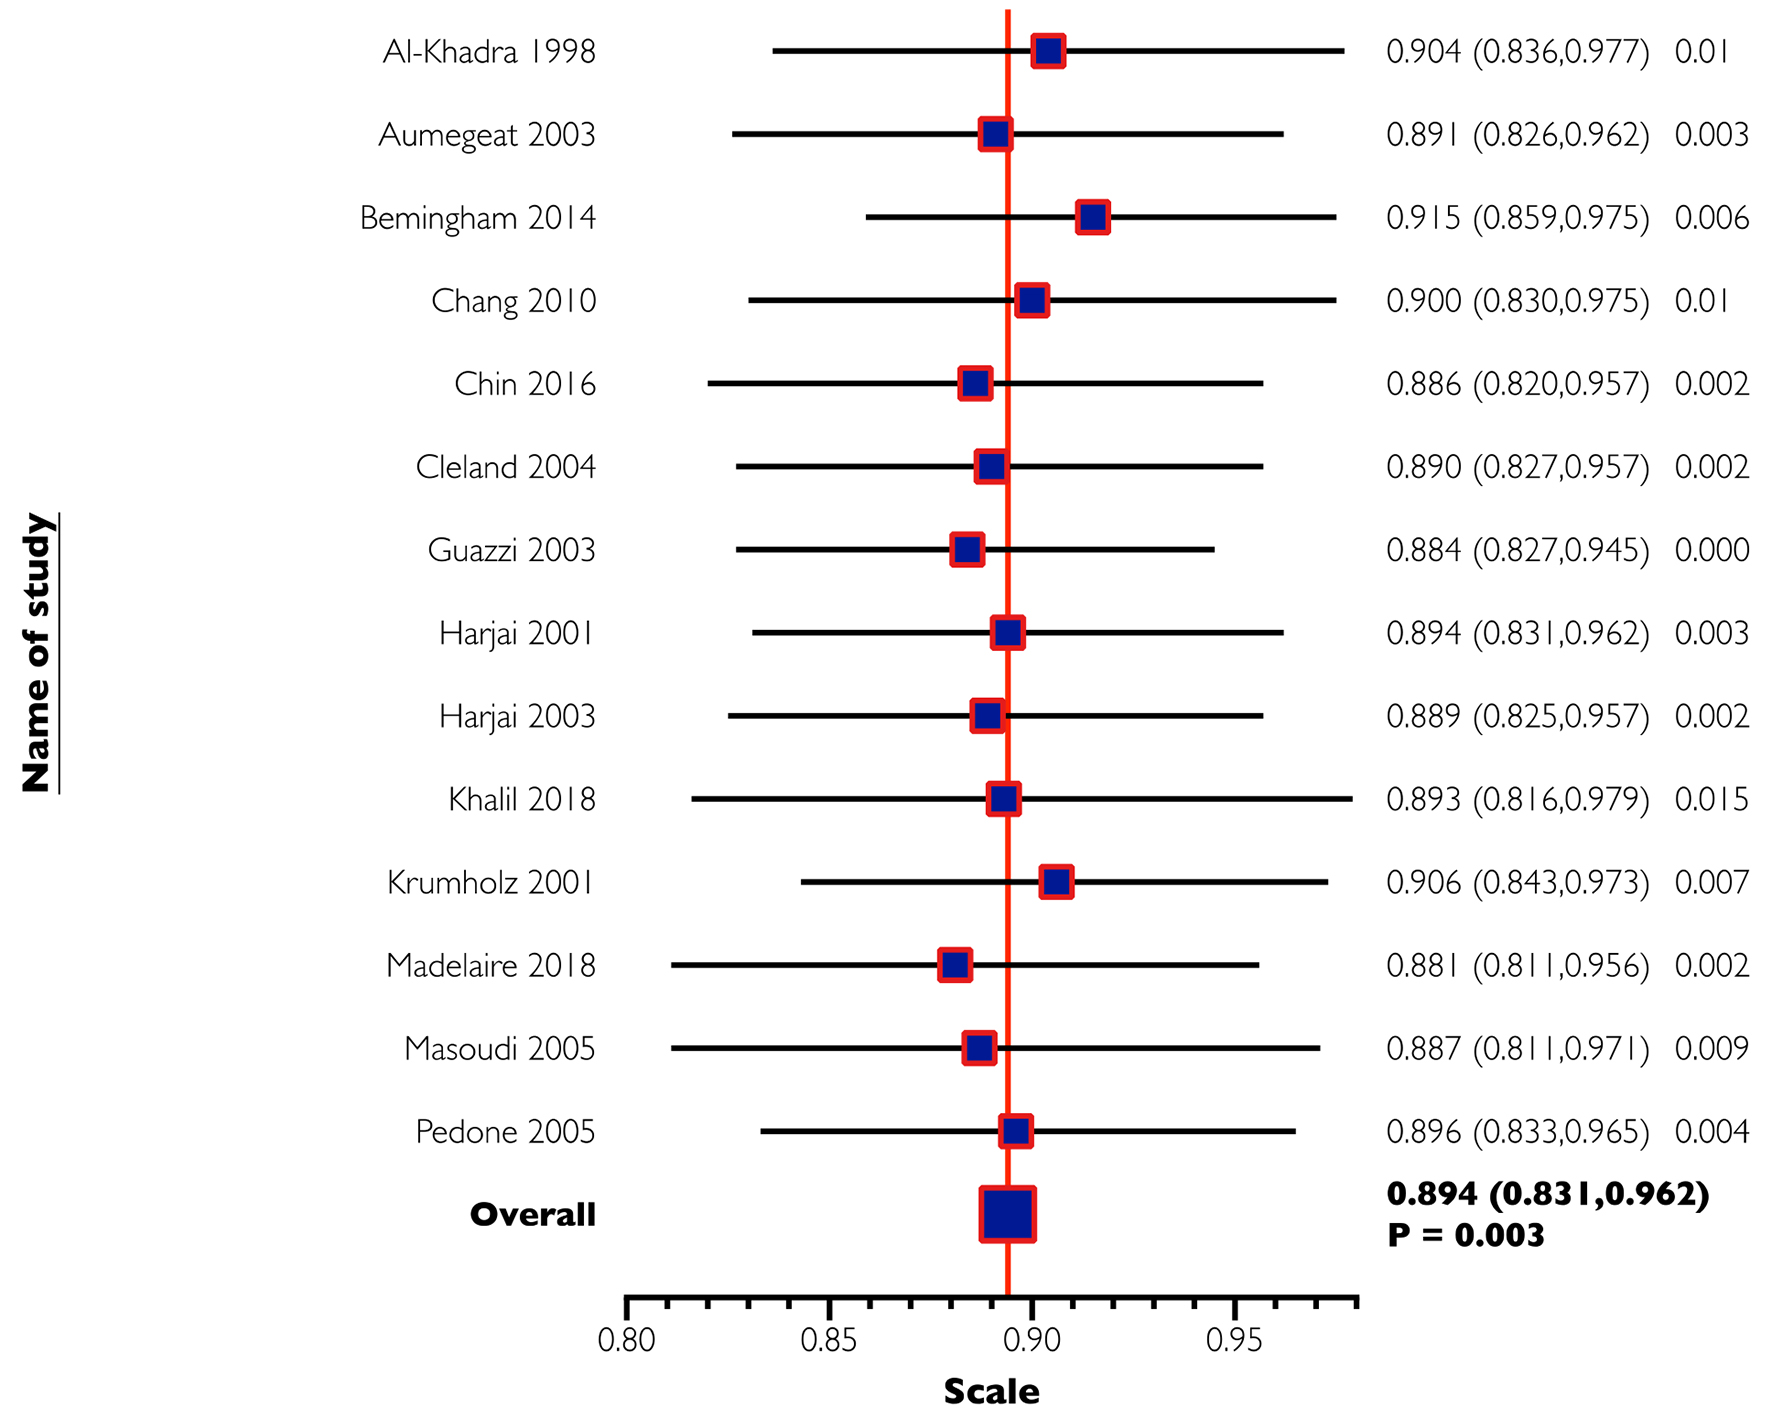
Figure 4. One-way sensitivity analysis of all-cause mortality. In this analysis, the omission of each study did not make a significant difference, confirming the stability of our results.
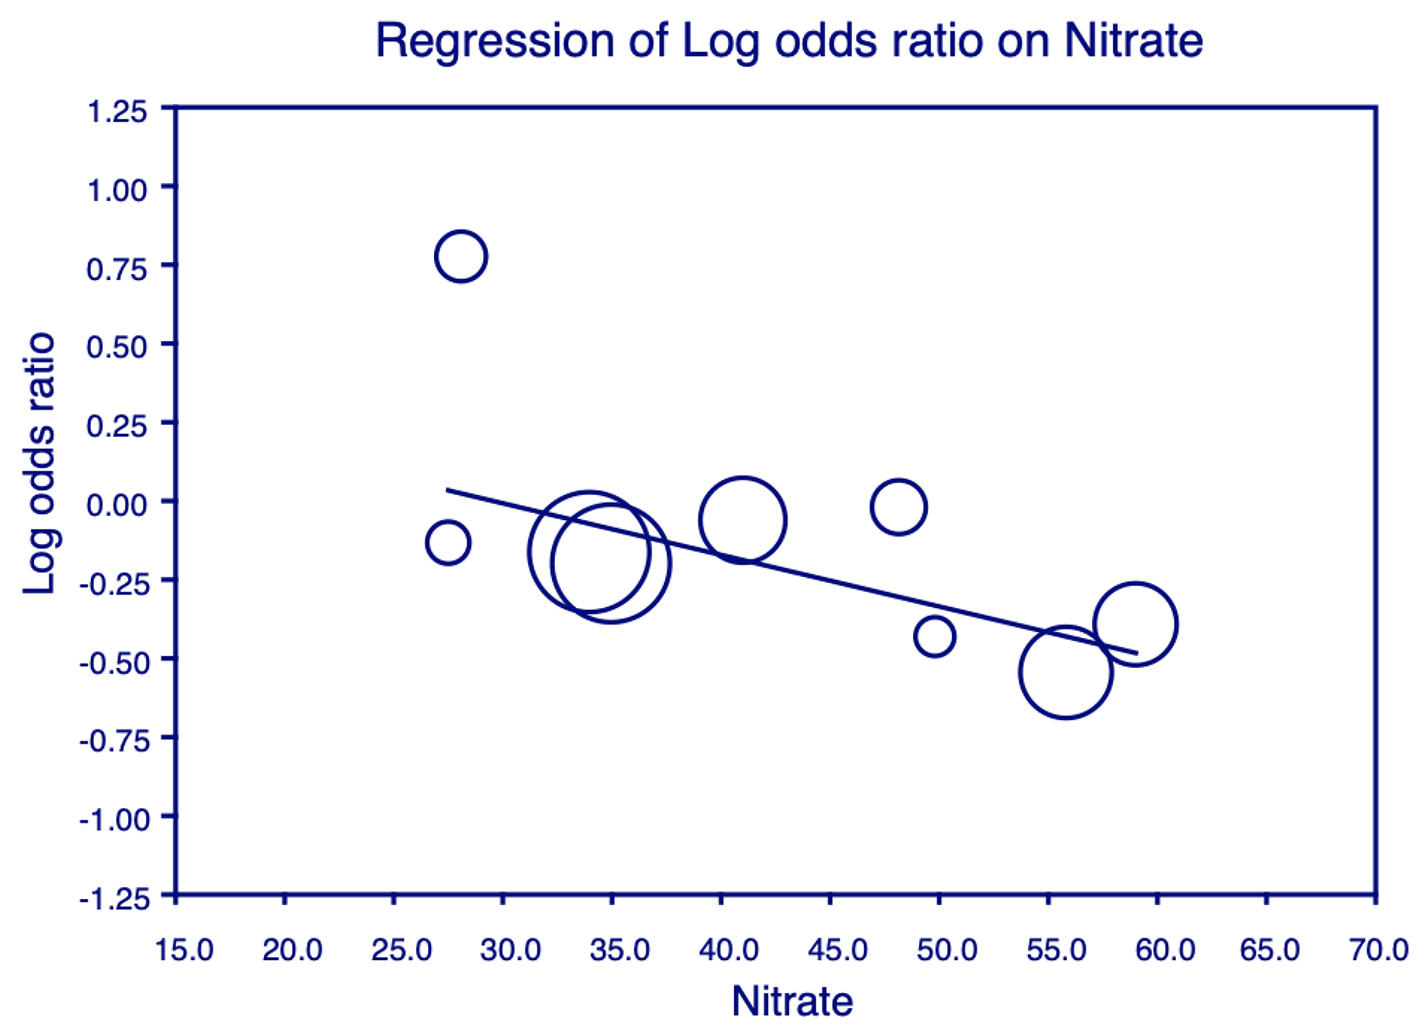
Figure 5. Meta-regression analysis for nitrates on all-cause mortality. Plot shows the log odds ratio (OR) of all-cause mortality against the use of nitrates in the studies. Each individual circle denotes the log of the OR (graphed on y-axis) of all-cause mortality based on the percentage of nitrate use in the study population (graphed on x-axis). The size of the circle denotes the size of the total study population. The regression line denotes that the all-cause mortality decreases as the proportion of patients on nitrates increases.
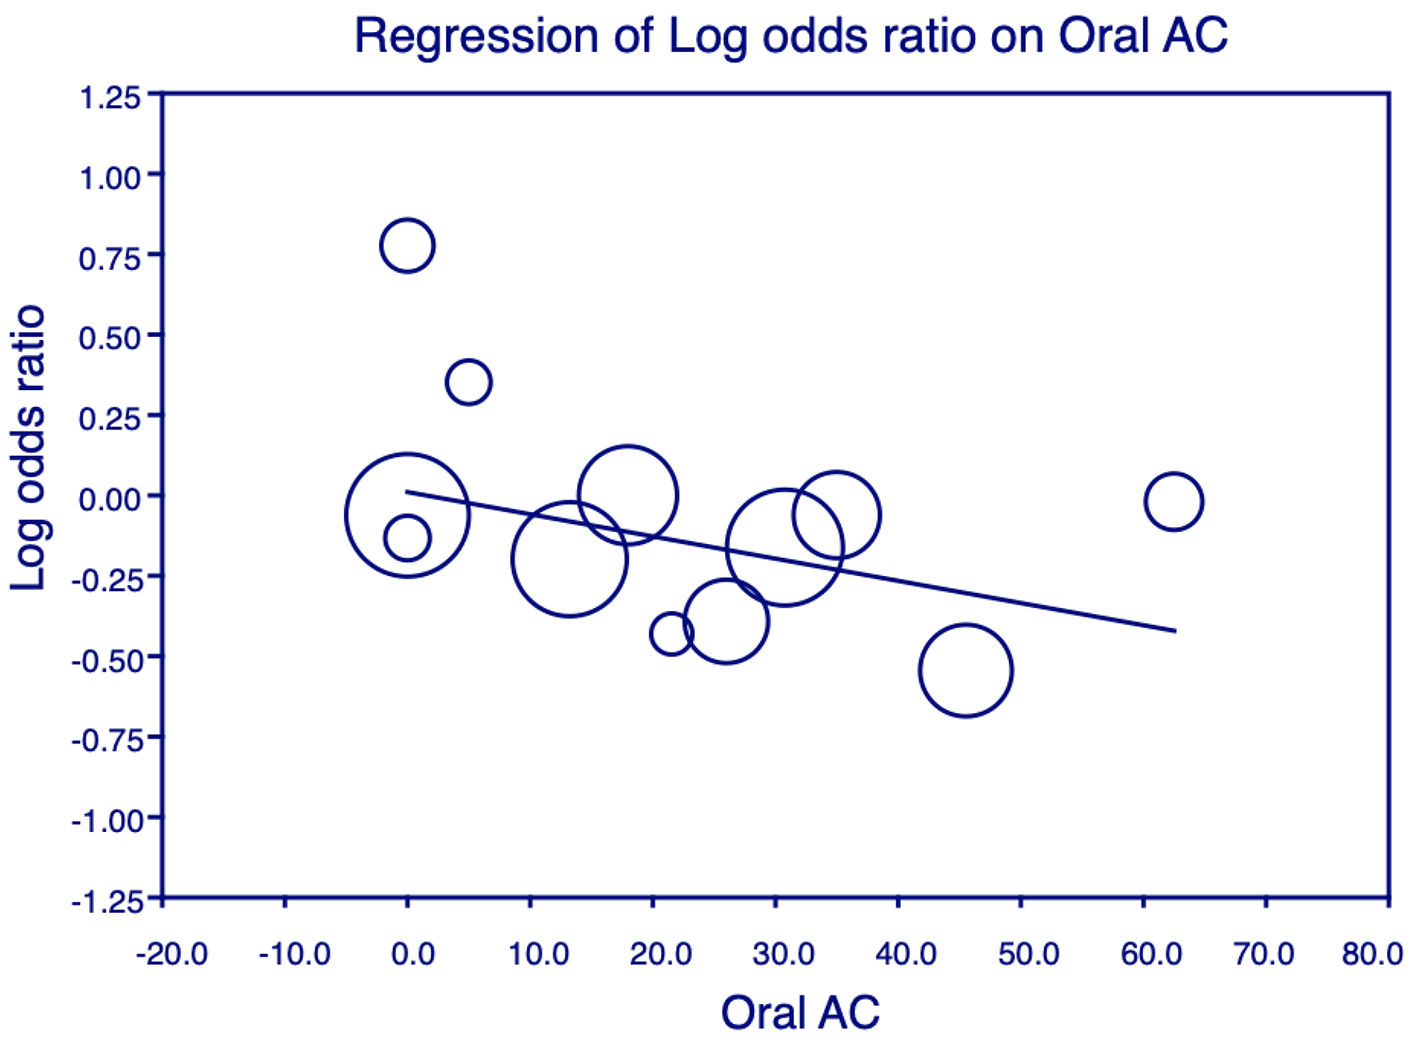
Figure 6. Meta-regression analysis for oral anticoagulant (OAC) on all-cause mortality. Plot shows the log odds ratio (OR) of all-cause mortality against the use of OAC in the studies. Each individual circle denotes the log of the OR (graphed on y-axis) of all-cause mortality based on the percentage of OAC use in the study population (graphed on x-axis). The size of the circle denotes the size of the total study population. The regression line denotes that the all-cause mortality decreases as the proportion of patients on OAC increases.
Tables
Table 1. Details of Studies Included in the Final Meta-Analysis
| First author, year | Region | Study population included | Study design | Mean follow-up (months) | Outcome reporteda | Quality assessment score |
|---|
| aOutcome reported: 1: all-cause mortality; 2: hospitalization for heart failure. |
| Madelaire et al, 2018 [12] | Denmark | 7,680 | Retrospective cohort | 20.4 | 1, 2 | 8 |
| Bermingham et al, 2014 [13] | Ireland | 1,476 | Retrospective cohort | 31.2 | 1, 2 | 8 |
| Krumholz et al, 2001 [14] | USA | 1,110 | Retrospective cohort | 12 | 1, 2 | 8 |
| Cleland et al, 2004 [15] | UK, USA | 190 | Randomized control trial | 27 | 1 | 7 |
| Al-Khadra et al, 1998 [16] | USA | 6,512 | Randomized control trial | 37.4 - 41.4 | 1 | 7 |
| Harjai et al, 2003 [17] | USA | 272 | Observational | 28 | 1 | 8 |
| Harjai et al, 2001 [18] | USA | 378 | Observational | 13 | 2 | 8 |
| Aumegeat et al, 2003 [19] | France | 693 | Retrospective cohort | 66.5 | 1 | 8 |
| Chang et al, 2010 [20] | USA | 7,599 | Randomized control trial | 38 | 1, 2 | 9 |
| Chin et al, 2016 [4] | France | 2,737 | Randomized control trial | 21 | 1, 2 | 7 |
| Pedone et al, 2005 [21] | Italy | 269 | Observational | 12 | 1 | 7 |
| Khalil et al, 2018 [22] | UK | 11,278 | Retrospective cohort | 60 | 1, 2 | 7 |
| Guazzi et al, 2003 [23] | Italy | 344 | Retrospective cohort | 37.6 | 1 | 7 |
| Masoudi et al, 2005 [24] | USA | 24,012 | Retrospective cohort | 12 | 1, 2 | 7 |
Table 2. Results of Meta-Analysis for Effect of Aspirin on All-Cause Mortality and Hospitalization for Heart Failure in Patients With CHF
| Endpoint | Odds ratio | 95% CI | P value | I2 |
|---|
| CHF: congestive heart failure; CI: confidence interval. |
| All-cause mortality | 0.894 | 0.831 - 0.962 | 0.003 | 66.70 |
| Hospitalization for heart failure | 0.91 | 0.798 - 1.037 | 0.156 | 83.48 |


