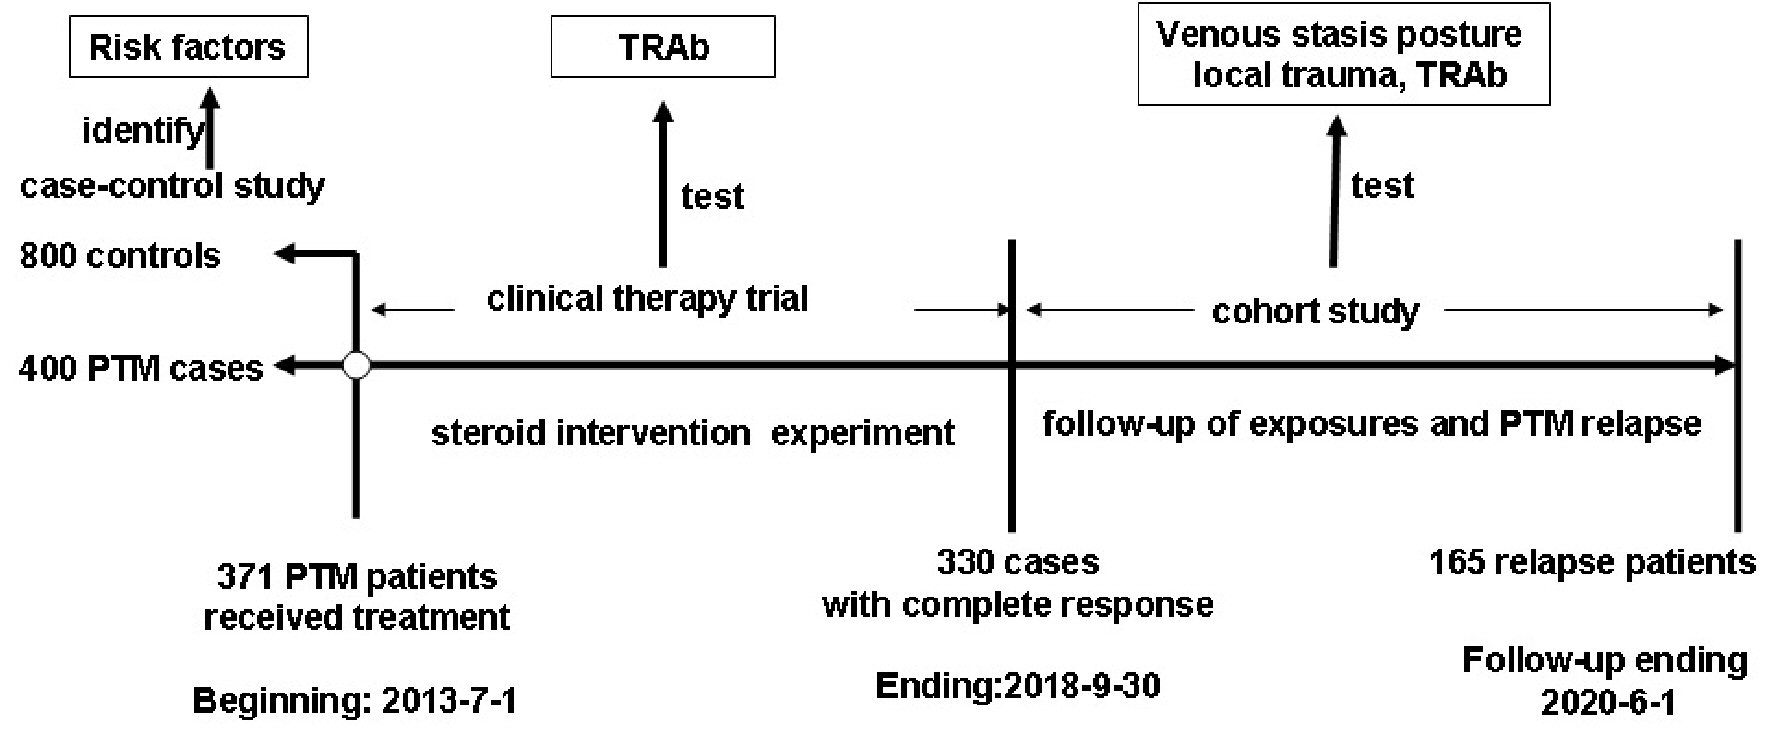
Figure 1. Study design for identifying and validating the risk factors for PTM occurrence. PTM: pretibial myxedema; TRAb: TSH receptor antibodies; TSH: thyroid-stimulating hormone.
| Journal of Clinical Medicine Research, ISSN 1918-3003 print, 1918-3011 online, Open Access |
| Article copyright, the authors; Journal compilation copyright, J Clin Med Res and Elmer Press Inc |
| Journal website https://www.jocmr.org |
Original Article
Volume 12, Number 11, November 2020, pages 711-723
Thyroid-Stimulating Hormone Receptor Autoimmunity and Local Factors in Multiple Risk Factors Are Mainly Involved in the Occurrence of Pretibial Myxedema
Figures
Tables
| Factors and its reference range | Case-control groups | χ2/ta | P1 | χ2/tb | P2 | χ2/tc | P3 | ||
|---|---|---|---|---|---|---|---|---|---|
| PTM (n = 400) | Normal persons (n = 400) | GD w/o PTM (n = 400) | |||||||
| aχ2/t: PTM vs. normal persons. bχ2/t PTM vs. GD w/o PTM. cχ2/t: PTM vs. control. dP > 0.05, no difference; *0.01 < P < 0.05, difference; **P < 0.01, significant difference. PTM: pretibial myxedema; GD: Graves’ disease; GD w/o PTM: GD without PTM; AITD: autoimmune thyroid disease; TSH: thyroid-stimulating hormone; TT3: total T3; FT3: free T3; TT4: total T4; FT4: free T4; TRAb: TSH receptor autoantibody; TPOAb: thyroid peroxidase autoantibody; TgAb: thyroglobulin autoantibody. | |||||||||
| Gender | 0.500 | d | 63.726 | ** | 24.552 | ** | |||
| Male | 210 (52.5%) | 200 (50.0%) | 100 (25.0%) | ||||||
| Female | 190 (47.5%) | 200 (50.0%) | 300 (75.0%) | ||||||
| Age | 45.73 ± 12.183 | 39.72 ± 22.547 | 37.97 ± 15.503 | 4.694 | ** | 7.874 | ** | 7.519 | ** |
| Range (min - max) year | 16 - 86 | 1 - 80 | 1 - 80 | ||||||
| Occupation | 0.343 | d | 0.009 | d | 0.154 | d | |||
| Unemployed | 110 (27.5%) | 106 (26.5%) | 112 (28.0%) | ||||||
| Worker | 71 (17.8%) | 71 (17.8%) | 72 (18.0%) | ||||||
| Peasant | 146 (36.5%) | 140 (35.0%) | 135 (33.8%) | ||||||
| Office staff | 73 (18.3%) | 83 (20.8%) | 81 (20.3%) | ||||||
| Cigarette smoking | 147 (36.8%) | 71 (17.75%) | 140 (35.0%) | 36.420 | ** | 0.266 | d | 13.712 | ** |
| Alcohol drinking | 136 (34.0%) | 172 (43.0%) | 112 (28%) | 6.842 | ** | 3.366 | d | 0.264 | d |
| Local skin trauma | 94 (23.5%) | 19 (4.8%) | 25 (6.3%) | 57.967 | ** | 47.000 | ** | 151.676 | ** |
| Venous stasis posture | 286 (71.5%) | 133 (33.3%) | 140 (35.0%) | 117.31 | ** | 107.032 | ** | 149.701 | ** |
| AITD history/AITD | 395 (98.8%) | 6 (1.5%) | 400 (100.0%) | 756.61 | ** | 5.031 | d | 276.827 | ** |
| Exophthalmos | 286 (71.5%) | 0 | 234 (58.5%) | 445.14 | ** | 14.857 | ** | 193.853 | ** |
| Acropachy | 57 (14.3%) | 0 | 37 (9.3%) | 61.373 | ** | 4.822 | * | 34.218 | ** |
| I-131 treatment | 269 (67.3%) | 0 | 245 (61.3%) | 405.27 | ** | 3.135 | d | 146.083 | ** |
| TT3 (0.92 - 2.79 nmol/L) | 2.02 ± 1.75 | 1.54 ± 0.36 | 2.39 ± 2.19 | 4.815 | ** | -2.514 | * | 0.498 | d |
| FT3 (3.54 - 6.47 pmol/L) | 6.08 ± 4.31 | 4.77 ± 0.67 | 7.15 ± 6.22 | 5.969 | ** | -2.805 | ** | 0.448 | d |
| TT4 (58.10 - 140.60 nmol/L) | 110.58 ± 60.97 | 96.75 ± 17.64 | 114.22 ± 67.23 | 3.930 | ** | -0.760 | d | 1.447 | d |
| FT4 (11.48 - 23.22 pmol/L) | 19.63 ± 14.33 | 16.23 ± 2.11 | 21.36 ± 18.83 | 4.659 | ** | -1.460 | d | 0.976 | d |
| TSH (0.55 - 4.78 mIU/L) | 10.957 ± 25.988 | 2.174 ± 1.040 | 9.099 ± 22.333 | 6.625 | ** | 0.995 | d | 3.637 | ** |
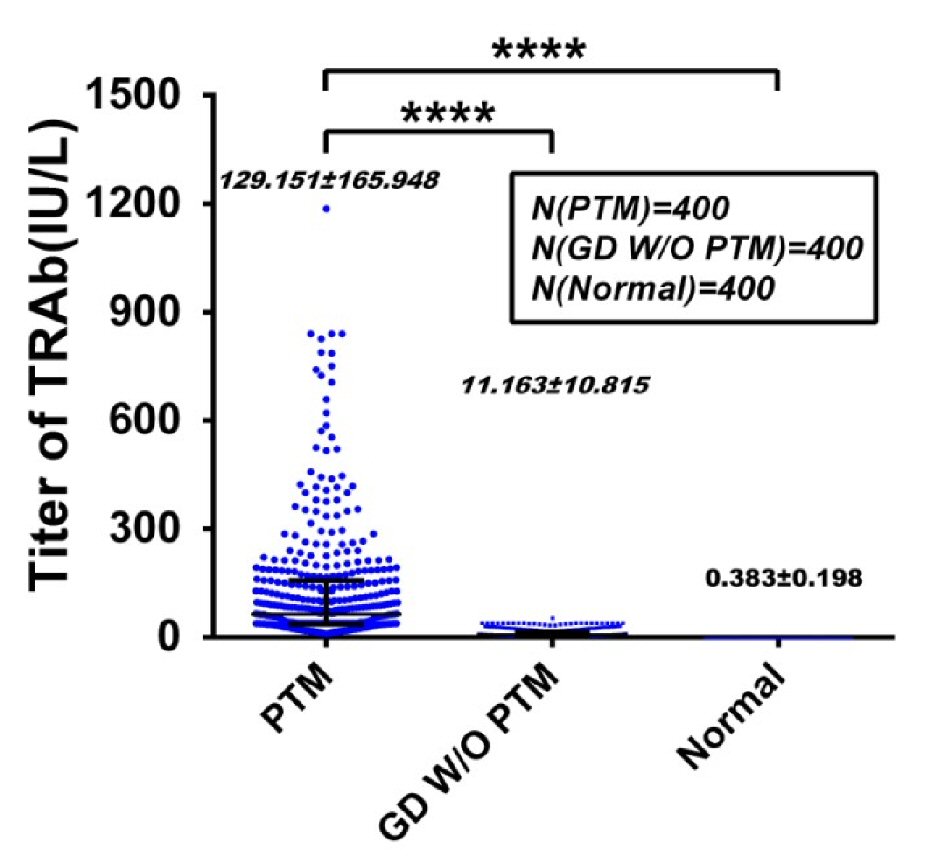
| TRAb (0.00 - 1.75 IU/L) | 129.15 ± 165.95 | 0.38 ± 0.20 | 11.16 ± 10.82 | 15.519 | ** | 14.190 | ** | 14.858 | ** |
| TPOAb (0.00 - 34.00 IU/mL) | 243.96 ± 273.46 | 13.32 ± 6.30 | 227.71 ± 208.57 | 16.715 | ** | 0.942 | d | 8.107 | ** |
| TgAb (0.00 - 115.00 IU/mL) | 499.20 ± 1091.53 | 20.96 ± 44.62 | 658.01 ± 1,172.04 | 8.679 | ** | -1.974 | * | -2.701 | ** |
| Independent variables | Univariate | Multivariate | ||
|---|---|---|---|---|
| OR (95% CI) | P value | OR (95% CI) | P value | |
| Factors adjusted for in the multivariate analysis: sex, occupation, cigarette smoking, alcohol drinking, local trauma, venous stasis posture, AITD history/AITD, exophthalmos, acropachy, I-131 treatment and TRAb. OR: odds ratio; CI: confidence interval; PTM: pretibial myxedema; GD: Graves’ disease; GD w/o PTM: GD without PTM; AITD: autoimmune thyroid disease; TSH: thyroid-stimulating hormone; TT3: total T3; FT3: free T3; TT4: total T4; FT4: free T4; TRAb: TSH receptor autoantibody; TPOAb: thyroid peroxidase autoantibody; TgAb: thyroglobulin autoantibody. | ||||
| Sex (male vs. female) | 0.543 (0.426 - 0.692) | < 0.001 | 0.074 (0.038 - 0.144) | < 0.001 |
| Age | 1.023 (1.016 - 1.031) | < 0.001 | 1.048 (1.030 - 1.066) | < 0.001 |
| Occupation | 0.978 (0.876 - 1.092) | 0.694 | ||
| Cigarette smoking | 1.622 (1.254 - 2.097) | < 0.001 | 4.481 (2.271 - 8.843) | < 0.001 |
| Alcohol drinking | 0.936 (1.311 - 2.197) | 0.608 | ||
| Local trauma | 5.278 (3.603 - 7.732) | < 0.001 | 6.552 (3.135 - 13.691) | < 0.001 |
| Venous stasis posture | 4.843 (3.728 - 6.292) | < 0.001 | 6.161 (3.711 - 10.228) | < 0.001 |
| AITD history/AITD | 76.665 (31.393 - 187.227) | < 0.001 | 10.304 (2.370 - 44.800) | 0.002 |
| Exophthalmos | 6.068 (4.655 - 7.911) | < 0.001 | 1.332 (0.820 - 2.163) | 0.247 |
| Acropachy | 3.427 (2.223 - 5.284) | < 0.001 | 0.751 (0.346 - 1.630) | 0.469 |
| I-131 treatment | 4.652 (3.596 - 6.017) | < 0.001 | 1.031 (0.641 - 1.658) | 0.900 |
| TRAb | 52.846 (32.584 - 85.707) | < 0.001 | 42.928 (23.757 - 77.568) | < 0.001 |
| TgAb | 1.000 (1.000 - 1.000) | 0.008 | 1.000 (1.000 - 1.000) | 0.334 |
| TPOAb | 1.002 (1.002 - 1.003) | < 0.001 | 1.000 (0.999 - 1.001) | 0.980 |
| FT3 | 1.006 (0.980 - 1.033) | 0.654 | ||
| FT4 | 1.004 (0.996 - 1.013) | 0.331 | ||
| TT3 | 1.019 (0.945 - 1.100) | 0.619 | ||
| TT4 | 1.002 (0.999 - 1.004) | 0.149 | ||
| TSH | 1.012 (1.006 - 1.018) | < 0.001 | 1.008 (1.000 - 1.017) | 0.065 |
| TRAb levels | Relapse (N) | Non-relapse (N) | Total (N) | RR | 95% CI | P value |
|---|---|---|---|---|---|---|
| RR: relative risk or risk ratio or rate ratio; RR > 1: positive association between exposure factors and PTM relapse; RR = 1.0 - 1.1, no association between exposure factors and PTM relapse; RR = 1.2 - 1.4, the association is weak; RR = 1.5 - 2.9, the association is moderate; RR = 3.0 - 9.0, the association is strong; RR ≥ 10, the association is very strong. PTM: pretibial myxedema; TRAb: TSH receptor antibodies; TSH: thyroid-stimulating hormone. | ||||||
| Elevated serum TRAb levels | 164 | 153 | 317 | 6.73 | 1.65 - 100.10 | 0.003 |
| Exposure | ||||||
| Trauma | 19 | 4 | 23 | 8.81 | 12.79 - 164.83 | < 0.001 |
| Posture | 78 | 50 | 128 | 6.5 | 6.96 - 32.66 | < 0.001 |
| Trauma + posture | 58 | 12 | 70 | 8.84 | 18.51 - 117.94 | < 0.001 |
| Non-exposure | 9 | 87 | 96 | - | - | - |
| Normal serum TRAb levels | 1 | 12 | 13 | - | - | |
| Exposure | ||||||
| Trauma | 0 | 3 | 3 | - | - | - |
| Posture | 0 | 5 | 5 | - | - | - |
| Trauma + posture | 1 | 3 | 4 | - | - | - |
| Non-exposure | 0 | 1 | 1 | - | - | - |