Journal of Clinical Medicine Research, ISSN 1918-3003 print, 1918-3011 online, Open Access
Article copyright, the authors; Journal compilation copyright, J Clin Med Res and Elmer Press Inc
Journal website https://www.jocmr.org

Original Article

Volume 12, Number 9, September 2020, pages 590-597


A Controllable Inflammatory Response and Temporary Abnormal Coagulation in Moderate Disease of COVID-19 in Wuhan, China

Figure

Figure 1.
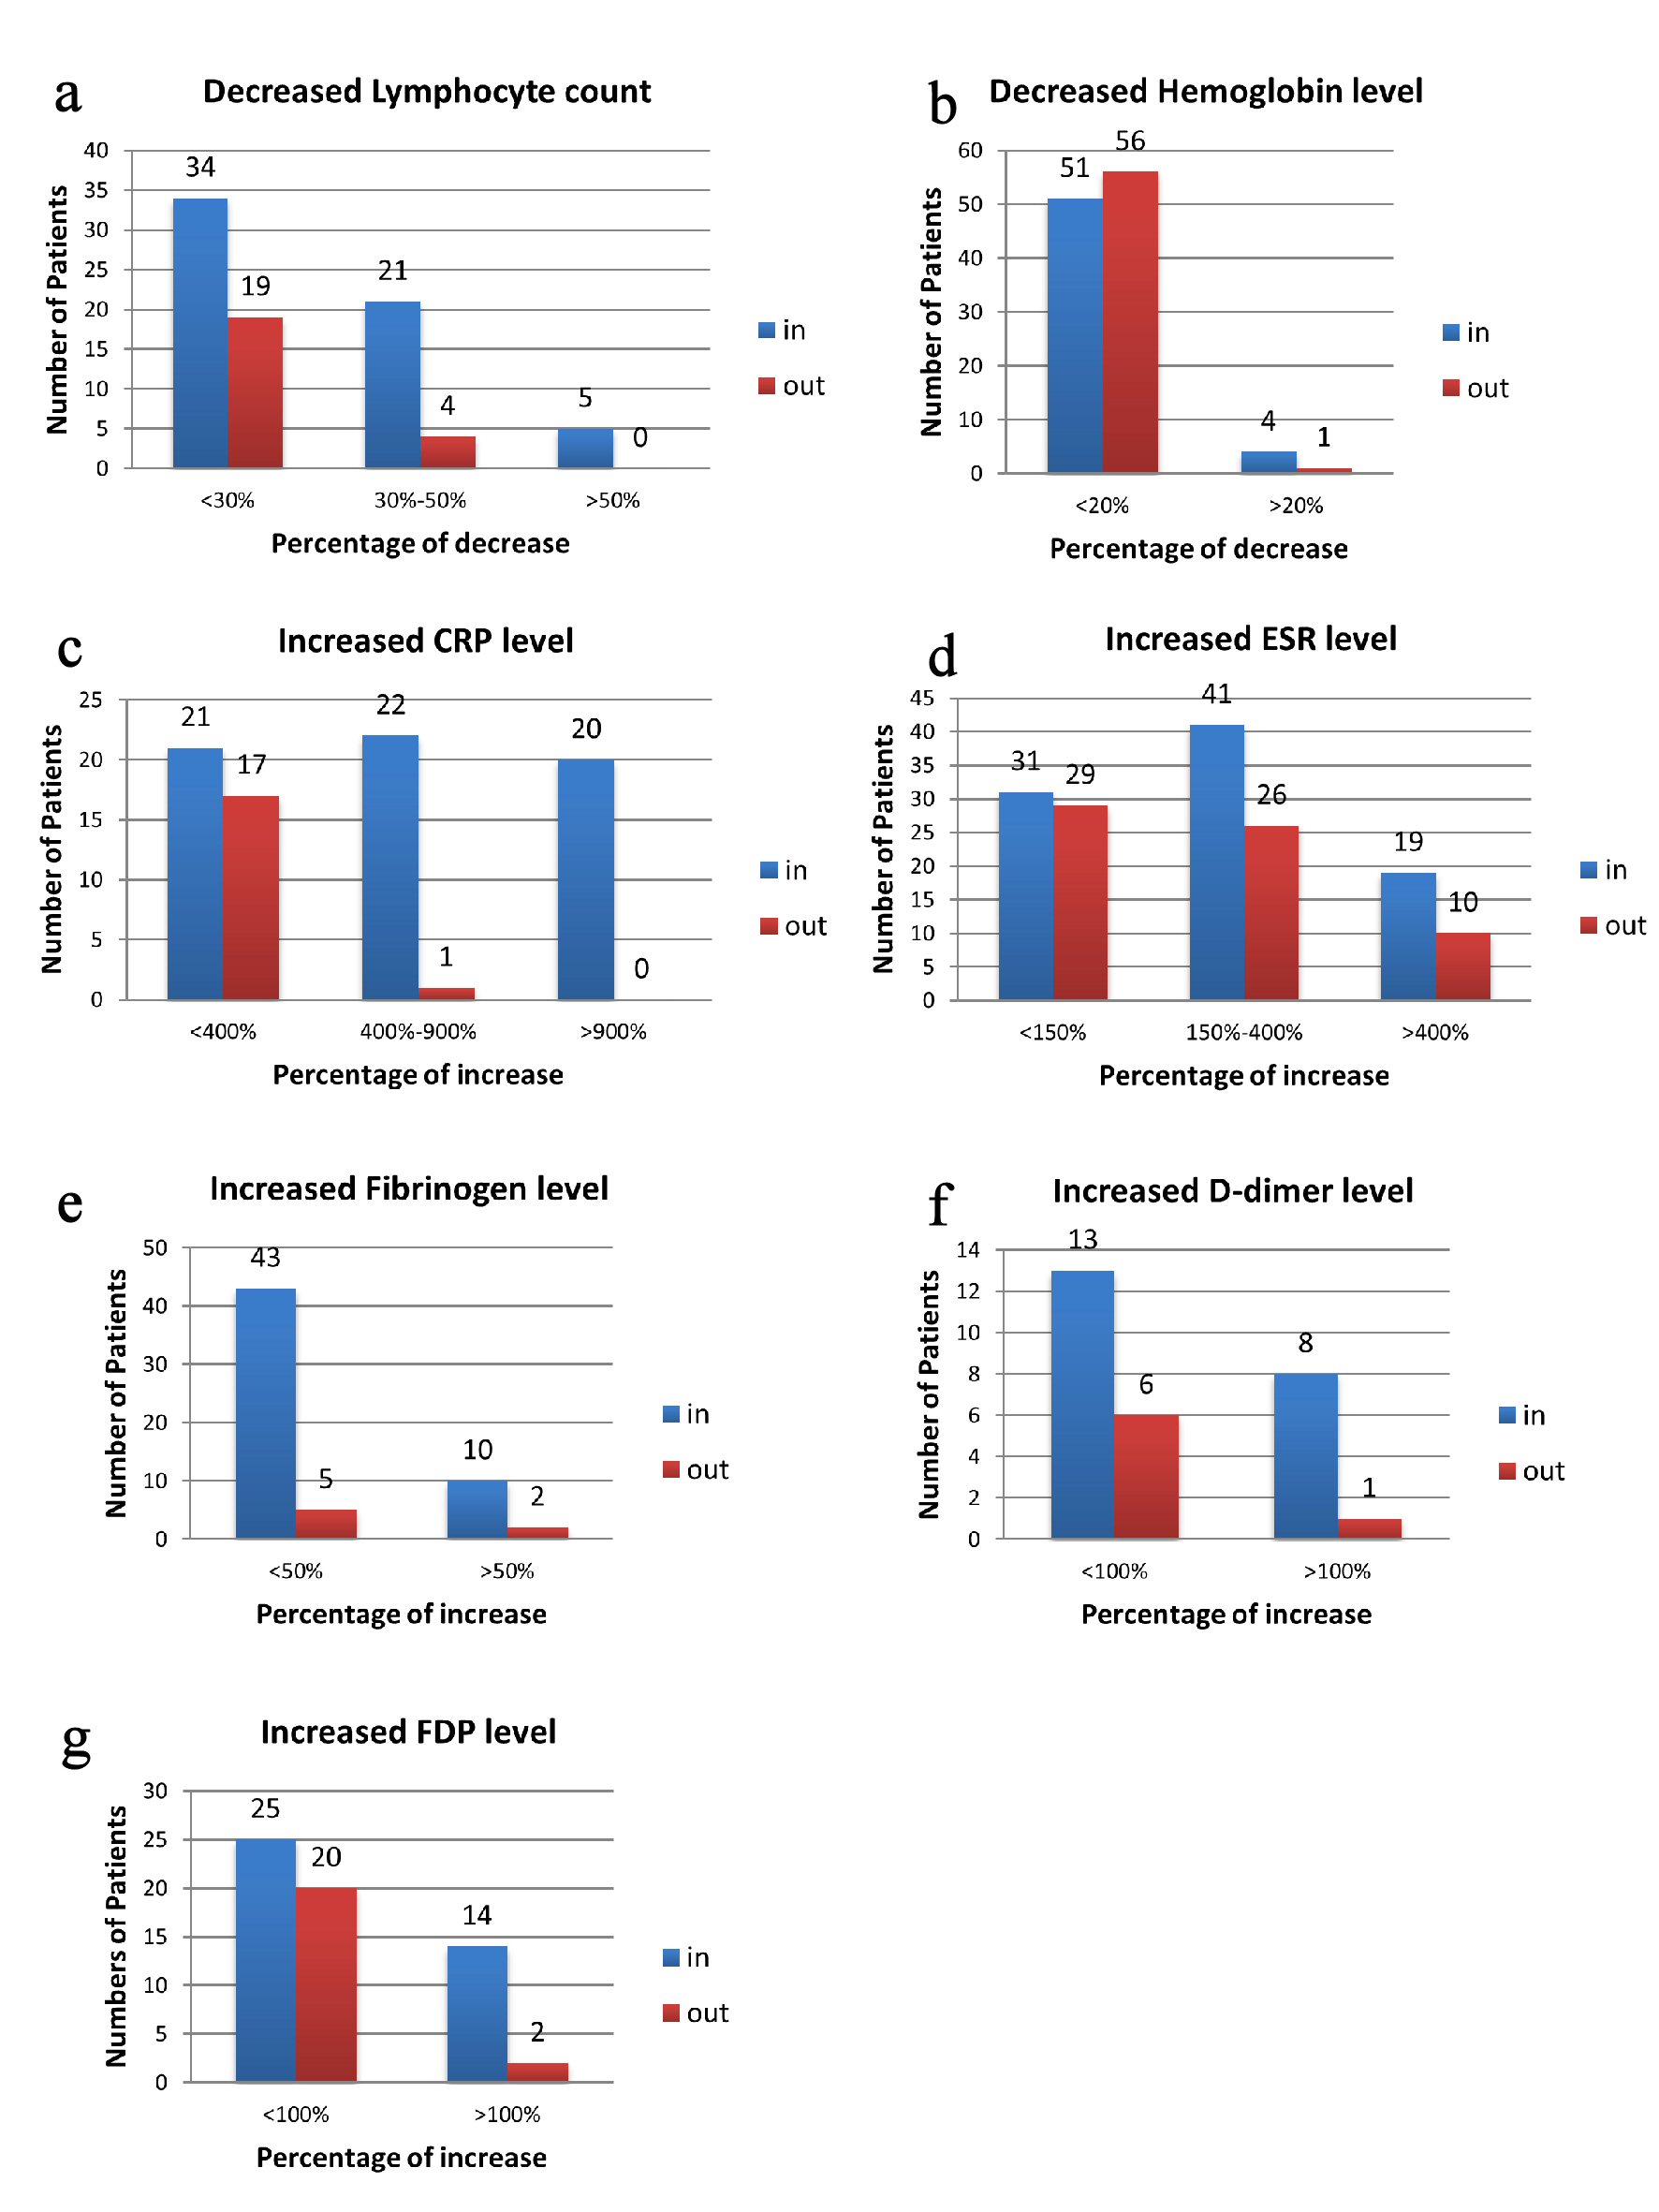
Figure 1. Illustration of percentage changes of laboratory index according to number of patients. Data are presented as number of patients that had changed level in laboratory assessments. (a) Decreased lymphocyte count on admission and at discharge. (b) Decreased hemoglobin level on admission and at discharge. (c) Increased CRP level on admission and at discharge. (d) Increased ESR level on admission and at discharge. (e) Increased fibrinogen level on admission and at discharge. (f) Increased D-dimer level on admission and at discharge. (g) Increased FDP level on admission and at discharge. In for the data collected on admission, out for data collected at discharge. CRP: C-reactive protein; ESR: erythrocyte sedimentation rate; FDP: fibrinogen degradation product.

Tables

Table 1. Demographics and Clinical Characteristics of Patients on Admission (N = 107)
 
Data are median (IQR), n (%), or n/N (%). IQR: interquartile range; SpO2: oxygen saturation.
Age (median (IQR), year)56 (43.5 - 65.0)
Sex
  Female62 (58%)
  Male45 (42%)
Hospitalization days (median (IQR), day)16 (13 - 20.5)
Medical history
  Hypertension31 (29%)
  Diabetes6 (5.6%)
  Heart disease10 (9.3%)
  Cancer3 (2.8%)
  Other respiratory disease6 (5.6%)
  Kidney disease6 (5.6%)
  Liver disease6 (5.6%)
  Neurological disease1 (0.9%)
  Thyroid disease2 (1.9%)
  Others8 (7.5%)
Symptoms
  Fever84 (78.5%)
  Cough63 (58.9%)
  Sputum production18 (16.8%)
  Nose obstruction, rhinorrhea2 (1.9%)
  Shortness of breath32 (29.9%)
  Headache5 (4.7%)
  Chest pain2 (1.9%)
  Myalgia10 (9.3%)
  Asthenia35 (32.7%)
  Vomiting3 (2.8%)
  Diarrhea12 (11.2%)
Signs
  Respiratory rate (median (IQR), bpm)23 (21 - 30)
  Heart rate (median (IQR), bpm)88 (82.5 - 98)
  Systolic pressure > 140mm Hg18 (17%)
  SpO2 ≤ 93%27 (25%)


Table 2. Summary of Laboratory Findings on Admission and at Discharge
 
Laboratory indexNormal rangeResults on admissionResults at discharge
Median (IQR)Patient (%)Median (IQR)Patient (%)
Data are median (IQR) or n/N (%). aThe normal level of NT-proBNP is increased with age. Three normal ranges for different age groups are listed, and results are presented accordingly. ↑For increased blood level. ↓For decreased blood level. hsCRP: high sensitive C-reactive protein; ESR: erythrocyte sedimentation rate; FDP: fibrinogen degradation product; NT-proBNP: N-terminal prohormone brain natriuretic peptide; hs-cTnL: high sensitive cardiac troponin L; CK: creatine kinase; LDH: lactose dehydrogenase; IQR: interquartile range; NA: not applicable.
Neutrophil count, × 109/L1.8 - 6.33.4 (2.5 - 4.2)8%↑3.1 (2.5 - 3.8)4%↑
12%↓6%↓
Neutrophil ratio, %40.0 - 75.067.7 (60.1 - 75.8)26%↑62.0 (56.4 - 66.6)3%↑
Lymphocyte count, × 109/L1.1 - 3.21.0 (0.8 - 1.4)56%↓1.4 (1.1 - 1.7)23%↓
Lymphocyte ratio, %20.0 - 50.022.1 (16.4 - 29.7)39%↓26.8 (22.9 - 31.9)13%↓
Red blood cell count, × 1012/L51%↓52%↓
  Female3.8 - 5.13.8 (3.5 - 4.2)3.8 (3.4 - 4.0)
  Male4.3 - 5.84.2 (3.9 - 4.5)4.1 (3.8 - 4.6)
Hemoglobin, g/L49%↓46%↓
  Female115.0 - 150.0113 (103 - 127)112 (101.5 - 120)
  Male130.0 - 175.0131 (123 - 144)128.5 (119.0 - 138.3)
Hematocrit, %56%↓55%↓
  Female35.0 - 45.034.3 (32.2 - 38.3)34.1 (31.5 - 36.8)
  Male40.0 - 50.039.4 (36.1 - 43.2)38.3 (35.6 - 41.5)
Platelet count, × 109/L125.0 - 350.0226.0 (168.5 - 313.0)15%↑221 (178.0 - 275.8)8%↑
7%↓3%↓
hsCRP, mg/L0 - 8.016.3 (2.9 - 62.7)60%↑1.7 (1.1 - 5.8)21%↑
ESR, mm/h0 - 20.064.0 (34.0 - 94.5)89%↑50.0 (24.0 - 80.0)86%↑
D-dimer, mg/L0 - 1.00.4 (0.3 - 0.8)20%↑0.3 (0.2 - 0.5)7 %↑
Fibrinogen, g/L2.0 - 4.04.1 (2.9 - 4.7)51%↑2.9 (2.4 - 3.3)9%↑
FDP, mg/L0 - 3.02.6 (1.6 - 4.1)41%↑1.9 (1.5 - 3.1)27%↑
NT-proBNPa, pg/mL10%↑2%↑
  < 50 years0 - 450.0120.0 (65.0 - 244.6)82.8 (54.3 - 162.8)
  50 - 75 years0 - 900.0296.5 (110.4 - 552.5)186.3 (119.5 - 351.8)
  > 75 years0 - 1,800.01,287.8 (611.1 - 1,467.7)365.7 (288.1 - 430.6)
hs-cTnL, ng/mL0 - 0.10.001 (0.001 - 0.004)0↑NANA
CK, U/L20.0 - 190.064.0 (33.5 - 125.0)16%↑45.0 (31.0 - 57.3)0↑
LDH, U/L114.0 - 240.0228.0 (182.0 - 284.5)46%↑175.5 (152.5 - 217.8)15%↑


Table 3. Statistically Significant Biomarkers on Admission and at Discharge With Different Ages
 
< 45 (n = 29)45 - 60 (n = 38)> 60 (n = 40)
Data are expressed with the median (IQR). P values comparing different age groups are from one-way ANOVA. aP < 0.05 for 45 - 60 group and < 45 group vs. > 60 group has statistical difference. bP < 0.05 for < 45 group vs. > 60 group has statistical difference. In for the data collected on admission, out for data collected at discharge. CRP: C-reactive protein; ESR: erythrocyte sedimentation rate; FDP: fibrinogen degradation product; CK: creatine kinase; IQR: interquartile range.
CRP (in)7.2 (0.7 - 53.2)15.1 (2.5 - 44.3)51.9 (6.5 - 94.4)a
ESR (in)35.0 (23.0 - 65.0)53.0 (32.5 - 90.5)87.5 (56.0 - 107.3)a
ESR (out)23.0 (21.0 - 46.0)42.0 (25.0 - 63.0)71.0 (34.5 - 98.3)a
Fibrinogen (in)3.6 (2.2 - 4.7)4.1 (2.8 - 4.6)4.4 (3.5 - 5.3)b
FDP (out)1.7 (1.4 - 2.3)1.8 (1.4 - 2.2)2.9 (1.9 - 4.1)a
D - dimer (out)0.3 (0.2 - 0.4)0.3 (0.2 - 0.4)0.49 (0.32 - 0.82)a
CK79.0 (50.0 - 161.0)78.5 (33.3 - 135.3)49.0 (30.8 - 79.8)b