Journal of Clinical Medicine Research, ISSN 1918-3003 print, 1918-3011 online, Open Access
Article copyright, the authors; Journal compilation copyright, J Clin Med Res and Elmer Press Inc
Journal website https://www.jocmr.org

Short Communication

Volume 12, Number 9, September 2020, pages 618-623


Trace Proteinuria and the Incidence of Overt Proteinuria After Five Years: Results of the Kanagawa Investigation of the Total Checkup Data From the National Database-5 (KITCHEN-5)

Figure

Figure 1.
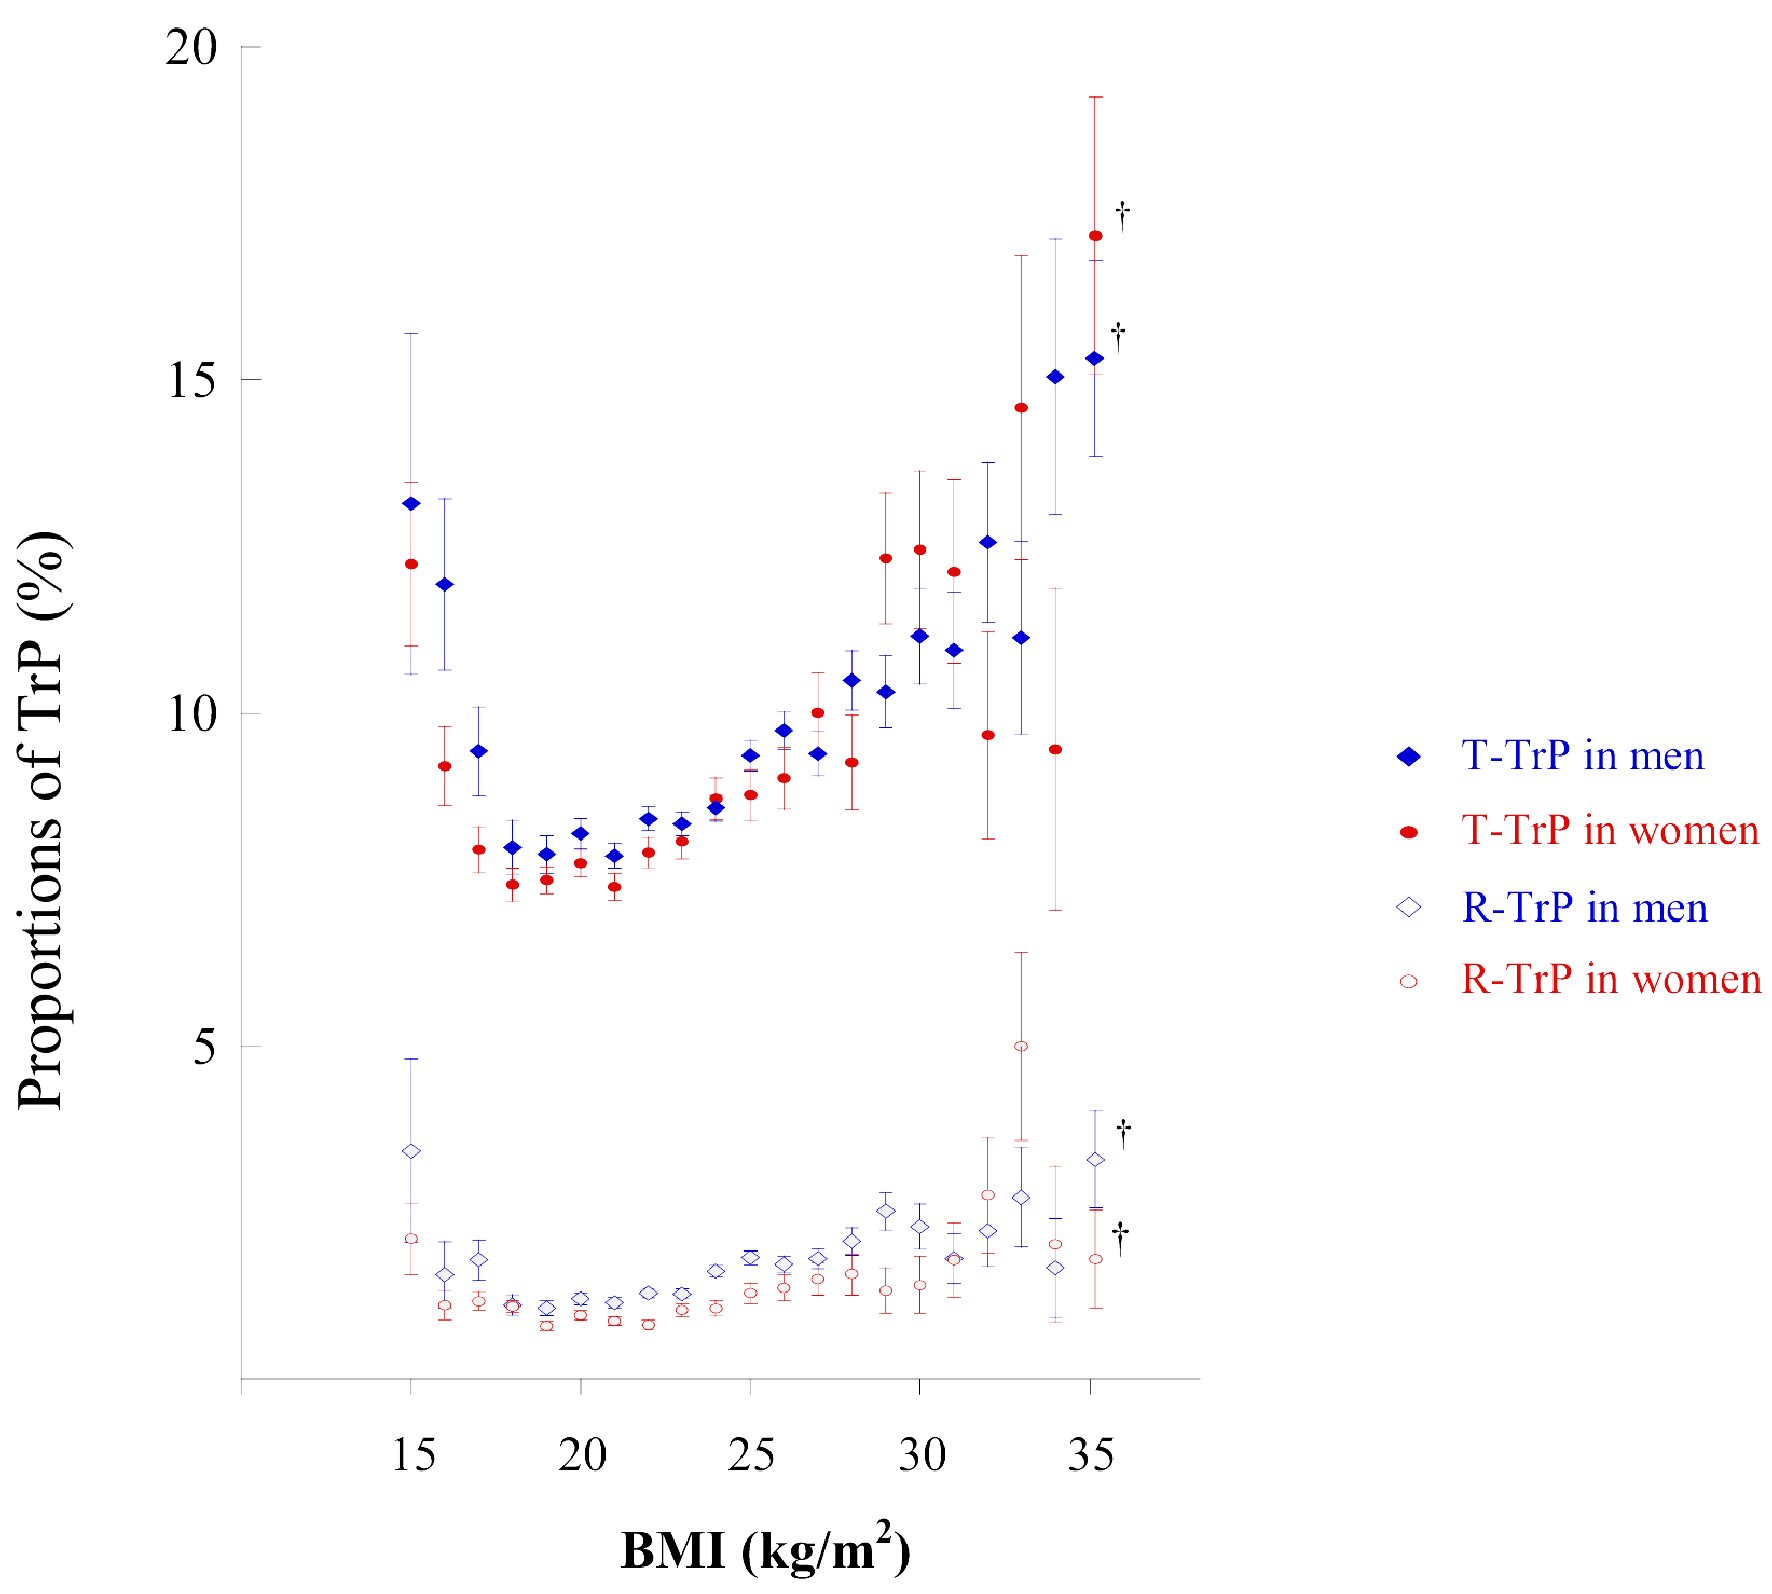
Figure 1. Proportion of subjects with TrP according to BMI categories. The circle in the middle of each bar shows the mean percentage of subjects with TrP (± on dipstick urinalysis) according to BMI intervals (1.0 kg/m2). This percentage was calculated as the number of subjects with TrP/number of subjects in each BMI group × 100 for each BMI interval (1.0 kg/m2 intervals). The vertical bar represents the standard error when TrP is 1 and non-TrP is 0. BMI from 35.0 to 50.0 kg/m2. BMI: body mass index; TrP: trace proteinuria; T-TrP: transient TrP; R-TrP: recurrent TrP.

Tables

Table 1. Baseline Characteristics of the Subjects According to T-TrP and R-TrP
 
Absence of TrPT-TrPR-TrP
Data are presented as mean ± SD, median (interquartile range), or number (%). All P values, except for exercise and alcohol drinkers, determined by ANOVA (continuous variables), and the χ2 and Cochran-Armitage test (categorical variables), are < 0.0001, respectively. aMethods of detection for TrP, Mantel-Haenszel test (P < 0.0001). bExercise of sweating lightly for over 30 min per session, two times weekly, χ2 test, P = 0.38; Cochran-Armitage test, P = 0.18. cχ2 test, P = 0.002; Cochran-Armitage test, P = 0.003. TrP: trace proteinuria; T-TrP: transient trace proteinuria; R-TrP: recurrent trace proteinuria; s-age: substituted age; VR: visual reading; AR: automated reading using a machine; SD: standard deviation; ANOVA: analysis of variance.
N (% in total)263,708 (90.2)24,782 (8.5)3,767 (1.3)
Methods of detection for proteinuria
  VR for both years, n (%)107,764 (92.4)7,817 (6.7)1,050 (0.9)
  VR/AR for each year, n (%)26,886 (89.0)3,040 (10.1)300 (1.0)
  AR for both years, n (%)129,058 (88.8)13,925 (9.6)2,417 (1.7)a
Men, n (%)152,106 (57.7)14,836 (59.9)2,504 (66.5)
S-age (years)53.1 ± 8.753.4 ± 9.153.8 ± 9.1
Body mass index (kg/m2)22.8 ± 3.223.2 ± 3.523.6 ± 3.6
Systolic blood pressure (mm Hg)123 ± 16.6124 ± 17.2125 ± 17.7
Triglycerides (mg/dL)95 (67 - 140)98 (69 - 144)106 (72 - 155)
High-density lipoprotein cholesterol (mg/dL)64.3 ± 16.963.1 ± 17.061.4 ± 17.0
HbA1c (%)5.5 ± 0.65.6 ± 0.75.7 ± 0.8
Pharmacotherapy for
  Hypertension, n (%)35,191 (13.3)4,247 (17.1)758 (20.1)
  Diabetes, n (%)5,579 (2.1)792 (3.2)165 (4.4)
  Dyslipidemia, n (%)21,682 (8.2)2,284 (9.2)383 (10.2)
Past history of cardiovascular disease, n (%)6,935 (2.6)805 (3.3)176 (4.7)
Current smokers, n (%)64,389 (24.4)6,698 (27.0)1,155 (30.7)
Habitual exercisers, n (%)b77,174 (29.3)7,194 (29.0)1,069 (28.4)
Daily alcohol drinkers, n (%)c78,399 (29.7)7,460 (30.1)1,214 (32.2)


Table 2. Odds Ratios (ORs) (95% Confidence Intervals) of T-TrP and R-TrP for the Incident of OP After Five Years
 
TrP (baseline n)Absence of TrP (263,708)T-TrP (24,782)R-TrP (3,767)
Model 1: unadjusted. Model 2: adjusted for age and sex. Model 3: model 2 plus adjustment for current smoking (versus non-smoking), daily alcohol consumption (versus infrequent/no alcohol consumption), regular exercise (versus no regular exercise), pharmacotherapy (for hypertension, diabetes, or dyslipidemia), body mass index, systolic blood pressure, triglycerides, high-density lipoprotein cholesterol, HbA1c (as continuous variables), and past history of cardiovascular disease (versus no history). TrP: trace proteinuria; T-TrP: transient trace proteinuria; R-TrP: recurrent trace proteinuria; OP: overt proteinuria; AR: automated reading; VR: visual reading. All P values of ORs of T-TrP and R-TrP for OP are < 0.0001.
Total, OP, n (%)4,866 (1.8)1,356 (5.5)381 (10.1)
  Model 11 (reference)3.08 (2.90 - 3.28)5.99 (5.36 - 6.68)
  Model 21 (reference)3.02 (2.84 - 3.21)5.63 (5.04 - 6.28)
  Model 31 (reference)2.77 (2.60 - 2.95)4.85 (4.34 - 5.43)
VR alone, OP, n (%)2,247 (2.1)468 (6.0)129 (12.3)
  Model 31 (reference)2.65 (2.38 - 2.94)5.21 (4.29 - 6.33)
VR/AR, OP, n (%)519 (1.9)161 (5.3)32 (10.7)
  Model 31 (reference)2.56 (2.13 - 3.08)4.74 (3.22 - 6.98)
AR alone, OP, n (%)2,100 (1.6)727 (5.2)220 (9.1)
  Model 31 (reference)3.03 (2.77 - 3.30)4.99 (4.30 - 5.79
Men, OP, n (%)3,260 (2.1)941 (6.3)279 (11.1)
  Model 31 (reference)2.75 (2.55 - 2.97)4.70 (4.12 - 5.37)
Women, OP, n (%)1,606 (1.4)415 (4.2)102 (8.1)
  Model 31 (reference)2.81 (2.51 - 3.14)5.33 (4.31 - 6.59)
BMI < 25 kg/m2, OP, n (%)3,187 (1.6)857 (4.7)216 (8.4)
  Model 31 (reference)2.92 (2.70 - 3.16)5.07 (4.38 - 5.87)
BMI ≥ 25 kg/m2, OP, n (%)1,679 (2.9)499 (7.7)165 (14.0)
  Model 31 (reference)2.52 (2.27 - 2.80)4.55 (3.82 - 5.43)