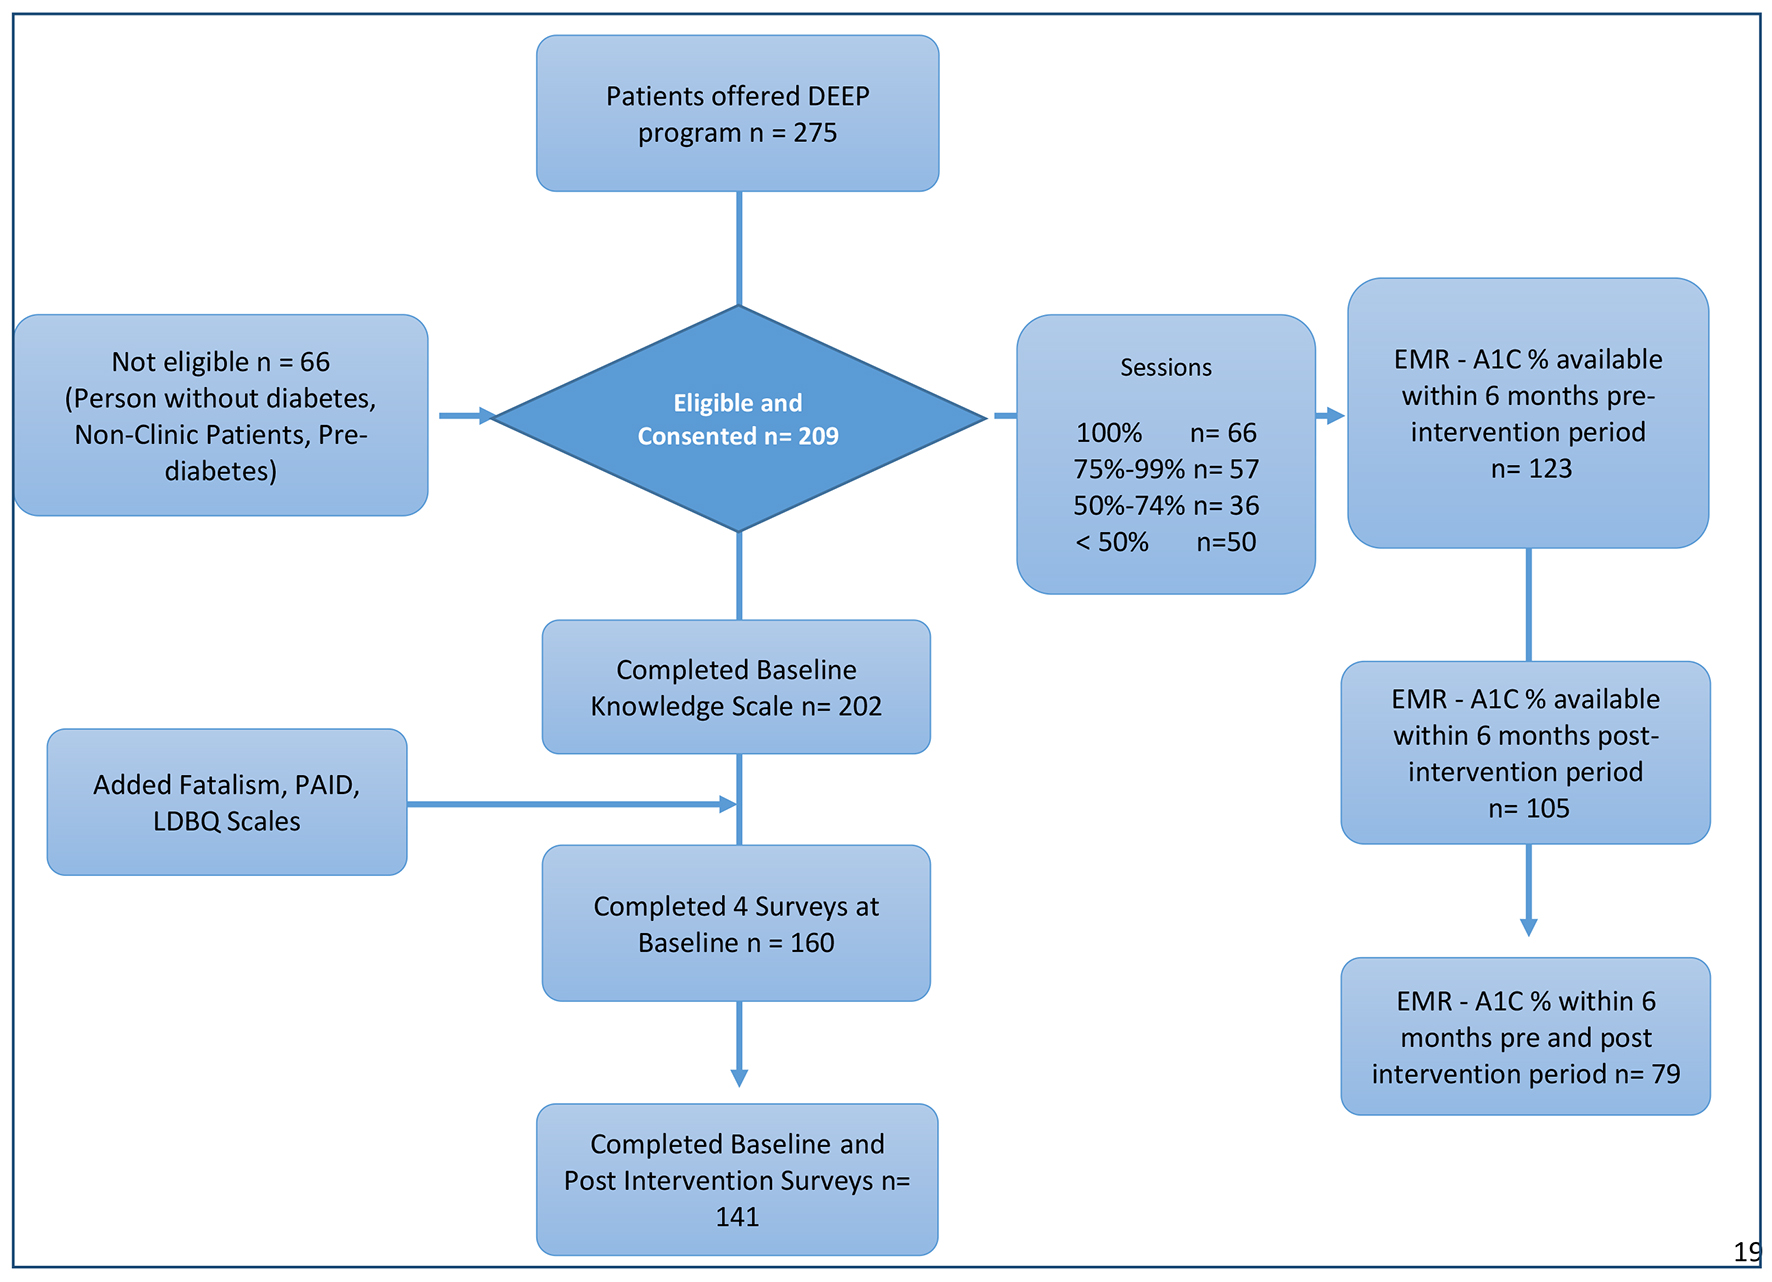
Figure 1. Flowchart of the study participants. DEEP: Diabetes Education and Empowerment Program; EMR: electronic medical record; PAID: problem areas in diabetes; LDBQ: Latino Dietary Behaviors Questionnaire.
| Journal of Clinical Medicine Research, ISSN 1918-3003 print, 1918-3011 online, Open Access |
| Article copyright, the authors; Journal compilation copyright, J Clin Med Res and Elmer Press Inc |
| Journal website http://www.jocmr.org |
Original Article
Volume 12, Number 8, August 2020, pages 517-529
Impact of a Culturally Tailored Diabetes Education and Empowerment Program in a Mexican American Population Along the US/Mexico Border: A Pragmatic Study
Figures
Tables
| Characteristics | All participants (N = 209), N (%) or mean (SD) | Completers* (N = 123) | Non-completers** (N = 86) | Pearson Chi-squared, P valuea |
|---|---|---|---|---|
| *Attended ≥ 75. **Attended < 75. aCompleters vs. non-completers. bT-test. | ||||
| Gender | 0.726 | |||
| Female | 143 (68.4) | 83 (67.5) | 60 (69.8) | |
| Male | 66 (31.6) | 40 (32.5) | 26 (30.2) | |
| Race | 0.213 | |||
| Hispanic | 184 (91.1) | 105 (89.0) | 79 (94) | |
| Non-Hispanic | 18 (8.9) | 13 (11) | 5 (6) | |
| Income | 0.413 | |||
| < $20,000 | 127 (74.3) | 71 (73.2) | 56 (75.7) | |
| $20,000 - 30,000 | 27 (15.8) | 18 (18.6) | 9 (12.2) | |
| > $30,000 | 17 (9.9) | 8 (8.2) | 9 (12.2) | |
| Education | 0.596 | |||
| HS diploma | 100 (57.1) | 56 (55.4) | 44 (59.5) | |
| No HS diploma | 75 (42.9) | 45 (44.6) | 30 (40.5) | |
| Language | 0.591 | |||
| Spanish | 122 (58.7) | 68 (55.7) | 54 (62.8) | |
| English | 81 (38.9) | 51 (41.8) | 30 (34.9) | |
| Both | 5 (2.4) | 3 (2.5) | 2 (2.3) | |
| Self-reported health status | 0.572 | |||
| Fair/poor | 104 (58.1) | 58 (56.3) | 46 (60.5) | |
| Ex/VG/G | 75 (41.9) | 45 (43.7) | 30 (39.5) | |
| Acculturation | 0.136 | |||
| Low (mostly Spanish) | 115 (72.3) | 69 (68.3) | 46 (79.3) | |
| High (mostly English) | 44 (27.7) | 32 (31.7) | 12 (20.7) | |
| Insurance | 0.278 | |||
| Medicare | 78 (43.8) | 48 (47.1) | 30 (39.5) | |
| Medicaid | 22 (12.4) | 11 (10.8) | 11 (14.5) | |
| Private | 30 (16.9) | 20 (19.6) | 10 (13.2) | |
| None | 48 (27.0) | 23 (22.5) | 25 (32.9) | |
| Birth country | 0.407 | |||
| Mexico | 99 (55.9) | 53 (52) | 46 (61.3) | |
| USA | 74 (41.8) | 46 (45.1) | 28 (37.3) | |
| Other | 4 (2.3) | 3 (2.9) | 1 (1.3) | |
| Mean age (years) | 58.92 (11.25) | 56.68 (11.21) | 59.06 (11.48) | 0.812b |
| Years with diabetes | 8.30 (7.83) | 7.78 (7.42) | 8.91 (8.30) | 0.374b |
| All participants (N = 209), N (%) or mean (SD) | Completers (N = 123), N (%) or mean (SD) | Non-completers (N = 86), N (%) or mean (SD) | Pearson Chi-squared, P value | |
|---|---|---|---|---|
| aT-test. | ||||
| Diabetes type | N = 203 | 0.340 | ||
| Type 1 | 7 (3.3) | 4 (57.1) | 3 (42.9) | |
| Type 2 | 155 (74.2) | 85 (55.6) | 68 (44.4) | |
| Not known | 41 (19.6) | 28 (68.3) | 13 (31.7) | |
| Ever taken a diabetes class | N = 122 | 0.807 | ||
| Yes | 47 (38.5) | 28 (39.4) | 19 (37.3) | |
| No | 75 (61.5) | 43 (60.6) | 32 (62.7) | |
| Self-monitored glucose (times per week) | N = 187 | 0.509 | ||
| 0 | 32 (17.1) | 21 (18.6) | 11 (14.9) | |
| > 1 per week | 155 (82.9) | 92 (81.4) | 63 (85.1) | |
| How often do you check your feet? (times per week) | N = 183 | 0.445 | ||
| 0 | 38 (20.8) | 21 (18.9) | 17 (23.6) | |
| > 1 per week | 145 (79.2) | 90 (81.1) | 55 (76.4) | |
| Sought diabetes care in the past 12 months | N = 185 | 0.811 | ||
| 0 | 15 (8.1) | 10 (8.8) | 5 (6.9) | |
| 1 - 3 | 100 (55.7) | 61 (54) | 42 (58.3) | |
| > 4 per year | 67 (36.2) | 42 (37.2) | 25 (34.7) | |
| Awareness of A1c% value | N = 182 | 0.085 | ||
| Self-reported A1c | 52 (28.6) | 24 (22) | 12 (16.4) | |
| Never heard | 36 (19.8) | 49 (45) | 45 (61.7) | |
| Not known | 94 (51.6) | 36 (33) | 16 (21.9) | |
| Self-reported A1c value | N = 52 8.40 (2.64) | 8.22 (2.82) | 8.81 (2.20) | 0.639a |
| Times doctor performed eye exam ever | N = 159 | 0.568 | ||
| 0 | 2 (1.3) | 1 (1.1) | 1 (1.1) | |
| 1 | 54 (34.0) | 35 (37.2) | 19 (29.2) | |
| > 1 | 103 (64.80 | 58 (61.7) | 45 (69.2) | |
| Times doctor performed foot exam in the past 12 months | N = 164 | 0.023 | ||
| 0 | 61 (37.2) | 28 (29.5) | 33 (47.8) | |
| 1 | 42 (25.6) | 24 (25.3) | 18 (26.1) | |
| > 1 | 61 (37.2) | 43 (45.3) | 18 (26.1) | |
| Diagnosed with retinopathy ever | N = 193 | 0.678 | ||
| Yes | 52 (26.9) | 86 (74.1) | 55 (71.4) | |
| No | 141 (73.1) | 30 (25.9) | 22 (28.6) | |
| Watching TV/videos (times/week) | N = 203 | 0.887 | ||
| Less than 1 | 40 (19.7) | 24 (19.7) | 16 (19.8) | |
| 1 to 2 | 59 (29.1) | 34 (27.9) | 25 (30.9) | |
| More than 2 | 104 (51.2) | 64 (52.5) | 40 (49.4) | |
| Sports/exercise (times/week) | N = 199 | 0.282 | ||
| More than 3 | 29 (15.2) | 14 (12.3) | 15 (19.5) | |
| 1 to 3 | 23 (12) | 16 (14) | 7 (9.1) | |
| Less than 1 | 139 (72.8) | 84 (73.7) | 55 (71.4) | |
| Baseline | Post-intervention | Change scoresa | Percent change from baselineb | Paired t-test, P value | ||||
|---|---|---|---|---|---|---|---|---|
| N | Mean (SD) | N | Mean (SD) | N* | 95% confidence interval | |||
| *Participants that have pre- and post-values. aScore change from participants who completed pre- and post-surveys. bPercentage change on a variable was defined as the difference between its values in the final period and initial period, divided by the initial value, and multiplied by 100. A1c: glycated hemoglobin; BMI: body mass index; HDL: high-density lipoprotein; LDL: low-density lipoprotein; TG: triglyceride; PAID: problem areas in diabetes; LDBQ: Latino Dietary Behaviors Questionnaire. | ||||||||
| Clinical outcomes | ||||||||
| BMI (kg/m2) | 130 | 32.44 (7.34) | 130 | 32.40 (7.51) | 130 | -0.39 (-0.50 to 0.42) | 1.20 | 0.866 |
| Cholesterol (mg/dL) | 63 | 188.25 (60.27) | 63 | 171.07 (36.66) | 63 | -17.17 (-0.736 to -2.08) | 9.12 | 0.041 |
| HDL (mg/dL) | 64 | 43.03 (11.91) | 64 | 44.29 (14.28) | 64 | 1.26 (-1.79 to 4.33) | 2.92 | 0.412 |
| LDL (mg/dL) | 56 | 96.10 (39.71) | 56 | 89.28 (34.12) | 56 | -6.82 (-19.81 to 6.16) | 7.09 | 0.297 |
| TG (mg/dL) | 58 | 190.12 (95.32) | 58 | 178.29 (108.19) | 58 | -11.82 (-36.80 to 13.53) | 6.21 | 0.347 |
| A1c (%) | 79 | 8.92 (2.28) | 79 | 7.82 (1.91) | 79 | -1.10 (-1.59 to -0.612) | 12.33 | < 0.001 |
| Microalbumin (urine) (mg/dL) | 9 | 169.07 (295.75) | 9 | 154.90 (218.40) | 9 | -14.17 (-103.58 to 75.23) | 8.38 | 0.724 |
| Behavioral and psychological variables | ||||||||
| Knowledge (range: 0 - 21) | 202 | 13.45 (3.33) | 141 | 15.45 (2.73) | 141 | 1.83 (1.28-2.38) | 13.43 | < 0.001 |
| PAID (range: 0 - 100) | 158 | 39.22 (26.66) | 115 | 32.78 (24.96) | 111 | -7.32 (-11.86 to-2.79) | -18.03 | 0.002 |
| LDBQ (range: 1 - 47) | 160 | 24.88 (6.92) | 117 | 27.37 (6.90) | 115 | 2.23 (1.20-3.26) | 8.78 | < 0.001 |
| Fatalism (range: 12 - 72) | 152 | 41.44 (12.28) | 111 | 40.46 (12.09) | 110 | -1.22 (-4.06 -1.61) | -2.92 | 0.393 |
| Glucose self-monitoring (times/week) | 187 | 8.42 (7.31) | 138 | 9.47 (8.10) | 115 | 1.33 (0.209 to 2.46) | 16.19 | 0.021 |
| Exercise (times/week) | 191 | 137 | 129 | < 0.001 | ||||
| 4 or more | 29 (15.2) | 38 (27.7) | 18 (13.96) to 36 (27.9) | 99.85 | ||||
| 1 to 3 | 23 (12.0) | 24 (17.5) | 17 (13.17) to 22 (17.1) | 29.84 | ||||
| Less than 1 | 139 (72.8) | 75 (54.7) | 94 (72.87) to 71 (55.0) | 24.52 | ||||
| Variables | Glycemic control (N = 105), N (%), (Mean, SD) | Odds ratio | 95% confidence interval | P value |
|---|---|---|---|---|
| PAID: problem areas in diabetes; LDBQ: Latino Dietary Behaviors Questionnaire. | ||||
| Age (years) | 105 (58.3, 10.5) | 1.00 | 0.968 - 1.04 | 0.825 |
| Years with diabetes | 82 (8.17, 8.41) | 0.904 | 0.848 - 0.964 | 0.002 |
| Preferred language | 0.212 | |||
| English | 37 (36.6) | 1.0 | ||
| Spanish | 64 (63.4) | 1.68 | 0.742 - 3.84 | |
| Gender | 0.932 | |||
| Male | 33 (31.4) | 1.0 | ||
| Female | 72 (68.6) | 0.964 | 0.415 - 2.23 | |
| Country of birth | 0.509 | |||
| USA | 34 (38.6) | 1.0 | ||
| Mexico | 54 (61.4) | 1.34 | 0.560 - 3.21 | |
| Acculturation level | 0.397 | |||
| Low | 63 (76.8) | 1.0 | ||
| High | 19 (23.2) | 0.639 | 0.227 - 1.80 | |
| Self-reported health status | 0.054 | |||
| Fair/poor | 55 (59.1) | 1.0 | ||
| Ex/VG/G | 38 (40.9) | 2.36 | 0.984 - 5.69 | |
| Education | 0.466 | |||
| < High school | 40 (44.0) | 1.0 | ||
| ≥ High school | 51 (56) | 0.730 | 0.314 - 1.70 | |
| Retinopathy | 0.002 | |||
| No | 38 (27) | 1.0 | ||
| Yes | 58 (60.4) | 0.227 | 0.087 - 0.590 | |
| Knowledge | 75 (13.3, 3.3) | 0.979 | 0.825 - 1.16 | 0.810 |
| PAID - diabetes emotional distress | 64 (39.6, 26.1) | 1.00 | 0.987 - 1.02 | 0.527 |
| LDBQ - dietary behaviors | 66 (25.2, 6.9) | 1.02 | 0.954 - 1.09 | 0.538 |
| Fatalism | 63 (39.9, 12.4) | 1.02 | 0.982 - 1.06 | 0.275 |