Journal of Clinical Medicine Research, ISSN 1918-3003 print, 1918-3011 online, Open Access
Article copyright, the authors; Journal compilation copyright, J Clin Med Res and Elmer Press Inc
Journal website https://www.jocmr.org

Original Article

Volume 12, Number 9, September 2020, pages 579-589


Validity of Serum miRNA 93 and miRNA 191 to Reduce Unnecessary Computed Tomography in Patients With Mild Head Trauma

Figures

Figure 1.
Figure 1. Comparison of serum miR93 and miR191 fold-change levels between the patient and control groups. Data are presented as numbers, percentages and mean ± standard deviation (SD). The Mann-Whitney U test was performed to compare miR93 and miR191 levels.
Figure 2.
Figure 2. Serum miR93 and miR191 levels in the patient and control groups.
Figure 3.
Figure 3. Distribution of serum miR93 and miR191 levels by cranial computed tomography (CCT) scan findings.
Figure 4.
Figure 4. The sensitivity and specificity of miR191 levels in predicting the abnormal findings in the cranial computed tomography (CCT) scan (area under the curve (AUC): 0.765; confidence interval (CI): 0.640 - 0.889; P = 0.016).
Figure 5.
Figure 5. The sensitivity and specificity of serum miR191 levels in determining the presence of traumatic brain injury in patients with MHT (area under the curve (AUC): 0.712; confidence interval (CI): 0.563 - 0.862; P = 0.032).

Tables

Table 1. Comparison of Age, Gender and Serum Quantities of miR93 and miR191 Between the Patient and Control Groups
 
Patient groupControl groupP*
Mean ± SDMin. - Max.Mean ± SDMin. - Max.
Data are expressed in numbers, percentages, mean ± standard deviation (SD), and minimum and maximum values. *Student’s t-test was used to compare age groups, and Chi-squared test was used to compare the gender distribution between groups. The Mann-Whitney U test was used to compare the serum miRNA-93 and -191 levels between groups.
Age41.10 ± 17.7018 - 8936.50 ± 10.7020 - 650.344
Gender0.279
  Male59 (81.5%)75 (74.7%)
  Female20 (18.5%)17 (25.3%)
miR930.74 ± 1.97-4.67 - 4.532.85 ± 2.26-1.91 - 9.08< 0.001
miR1910.48 ± 1.70-3.31 - 3.463.07 ± 2.72-3.69 - 9.30< 0.001


Table 2. Comparison of Serum miR93 and miR191 Levels Based on Findings of Cranial Computed Tomography (CCT) Scans
 
Findings in head CT scanP*
NormalAbnormal
Mean ± SDMin. - Max.MedianMean ± SDMin. - Max.Median
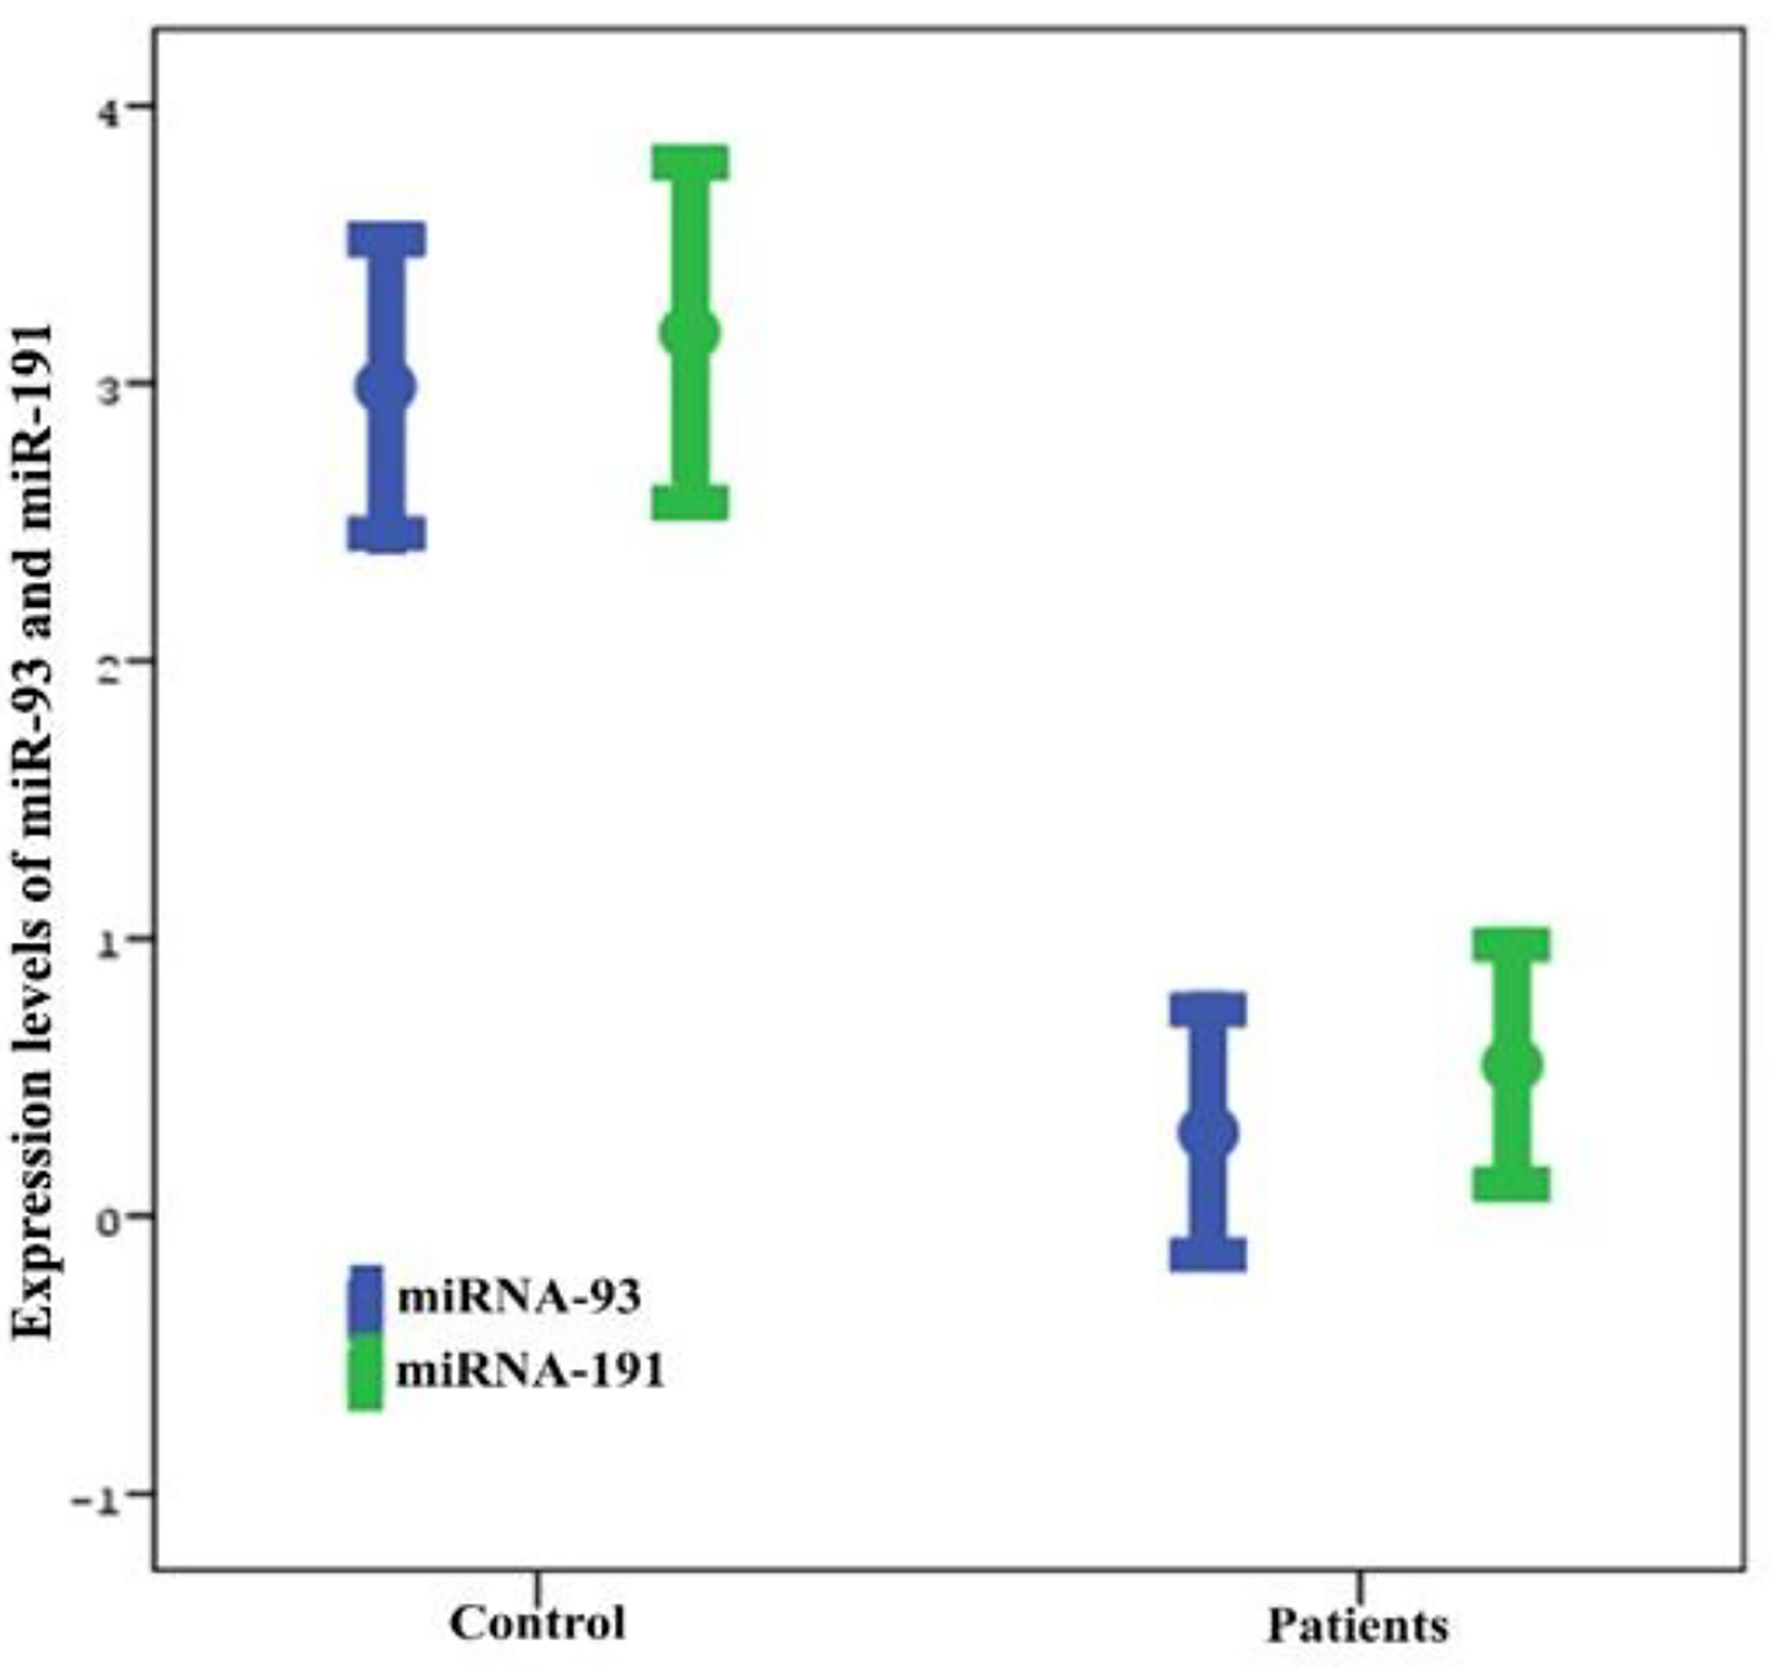
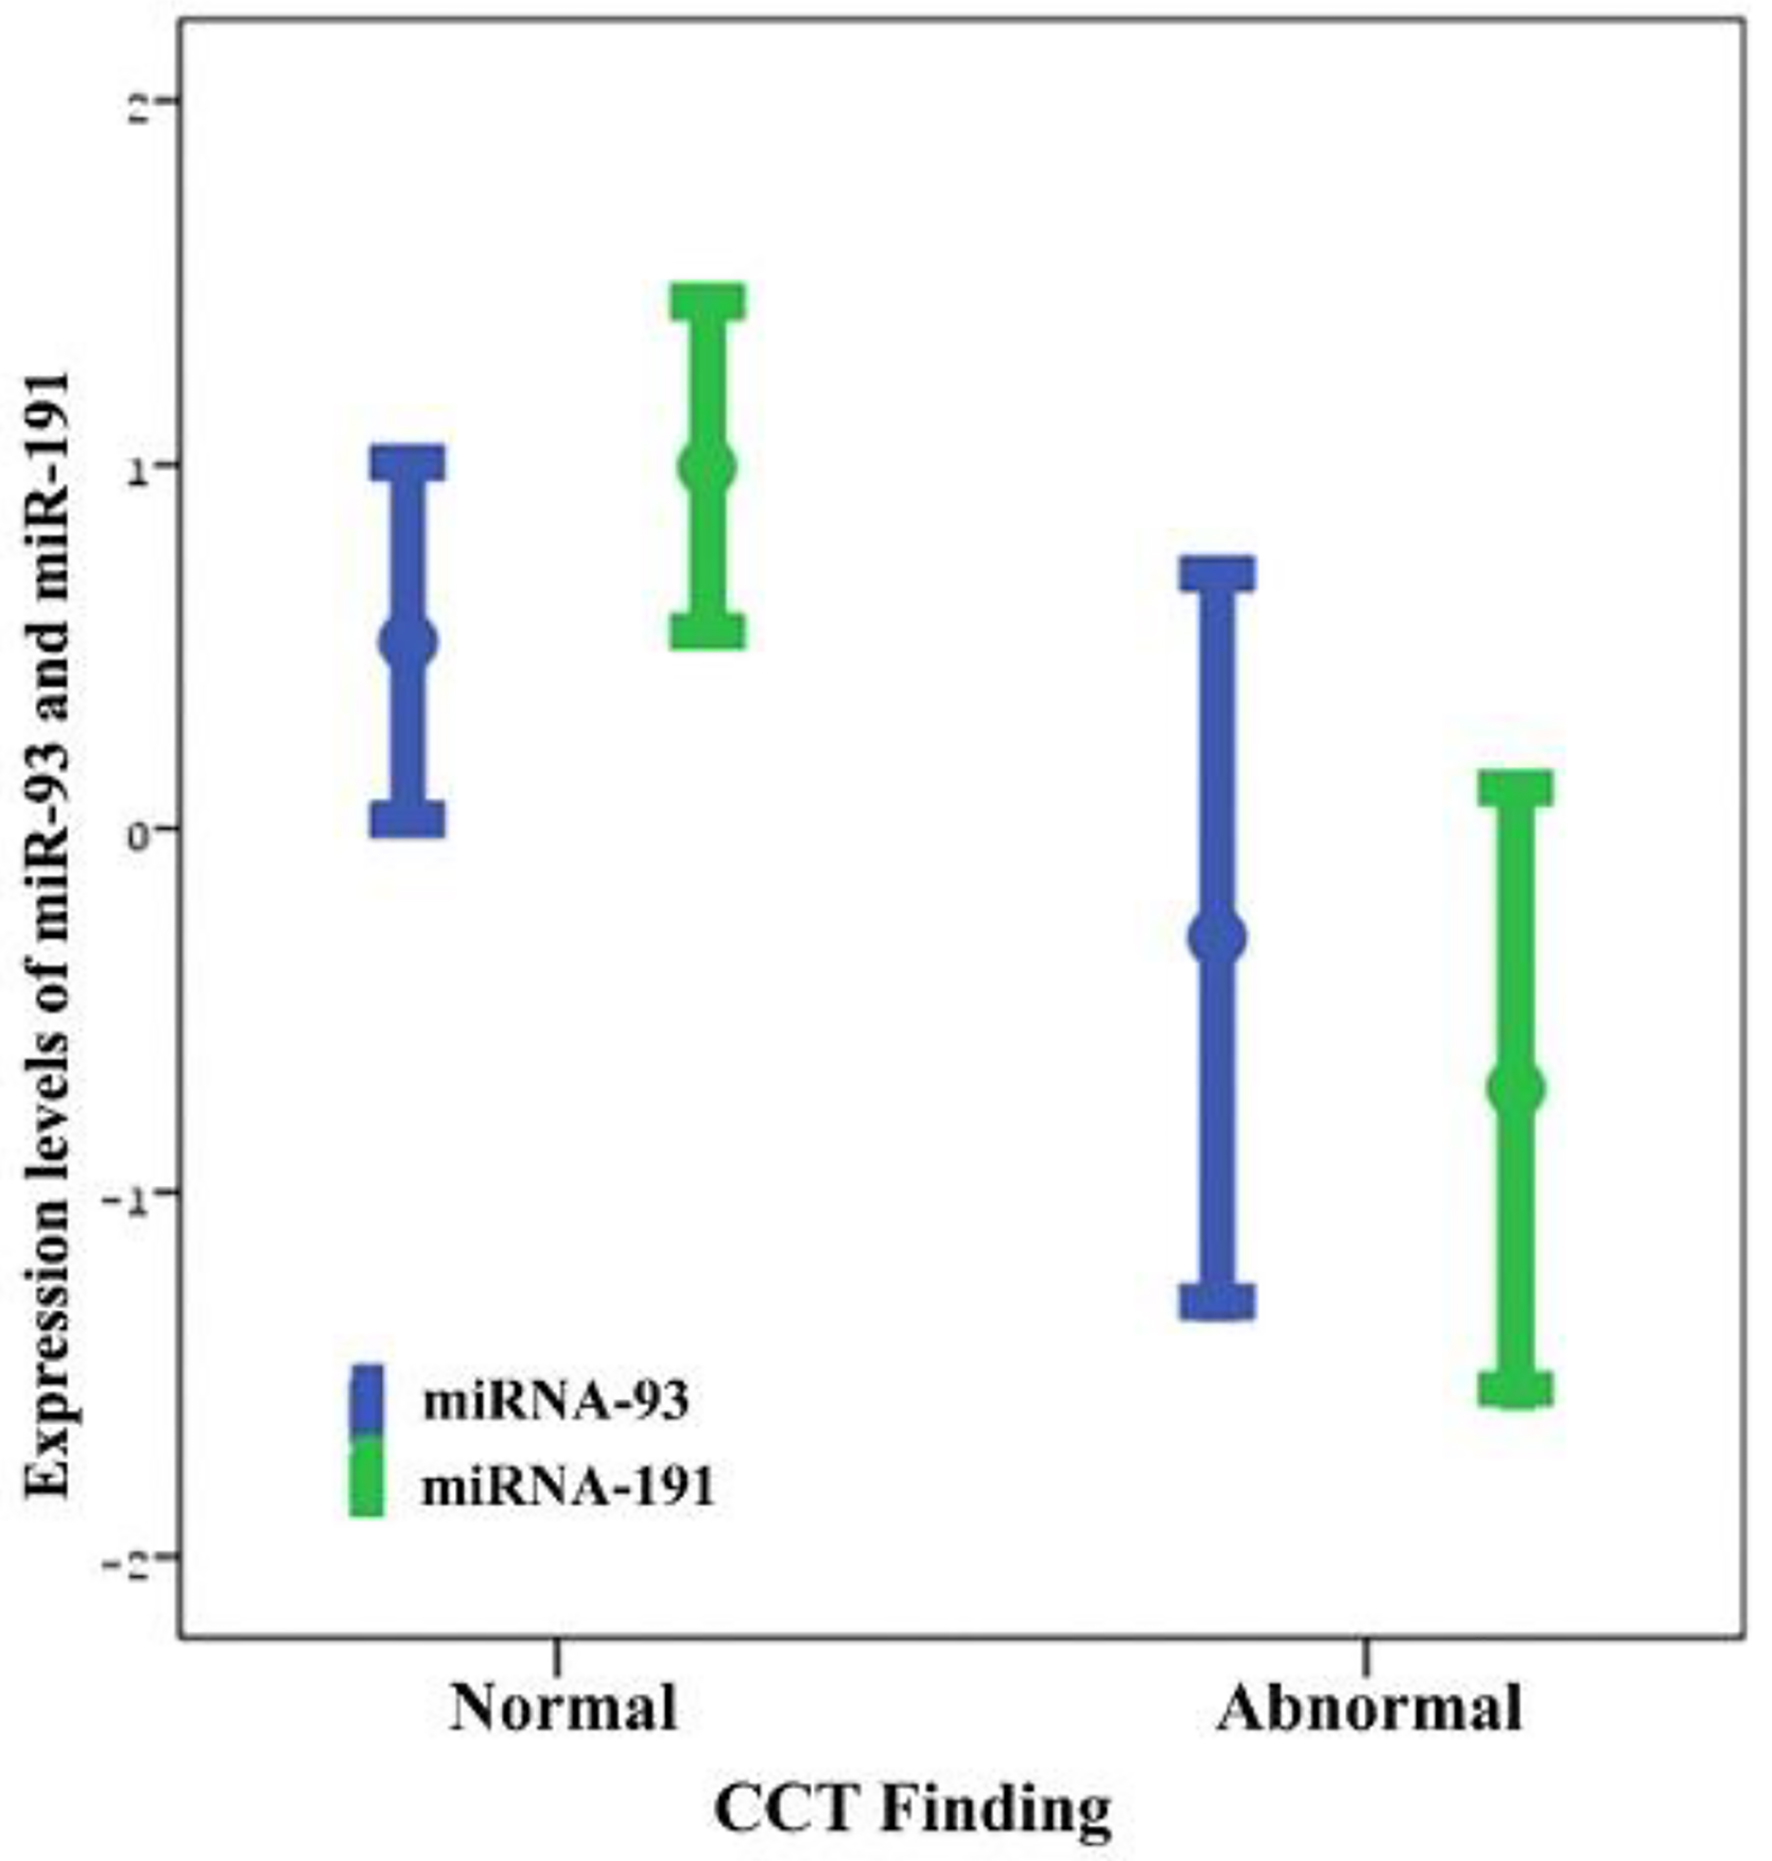
Data are presented as numbers, percentages, mean ± standard deviation (SD) and minimum and maximum values. *The Mann-Whitney U test was used to compare serum miR93 and miR191 levels between groups. Normal CT scan findings, including patients in the absence of traumatic intracranial or extracranial lesions (e.g., skull fracture, brain swelling, cerebral contusion and intracerebral hematoma). Abnormal CT scan findings, including linear fractures, collapse fractures, or traumatic brain injury (TBI). TBI, traumatic parenchymal lesions including epidural hematoma, subdural hematoma, subarachnoid hemorrhage, cerebral contusion and pneumocephalus.
miR931.02 ± 1.92-2.97 - 4.531.16-0.30 ± 1.88-4.67 - 2.360.000.017
miR1910.89 ± 1.57-2.63 - 3.461.08-0.71 ± 1.55-3.31 - 1.51-0.830.001


Table 3. Comparison of Serum miR93 and miR191 Levels Between Patients With and Without Traumatic Brain Injury
 
Traumatic brain injuryP*
YesNo
Mean ± SDMin. - Max.MedianMean ± SDMin. - Max.Median
Data are expressed in numbers, percentages, mean ± standard deviation (SD) and minimum and maximum values. The Mann-Whitney U test was used to compare serum miR93 and miR191 levels between groups.
miR93-0.02 ± 1.27-1.66 - 2.360.000.88 ± 2.05-4.67 - 4.531.160.145
miR191-0.56 ± 1.63-3.31 - 1.51-0.420.72 ± 1.64-3.12 - 3.461.010.017