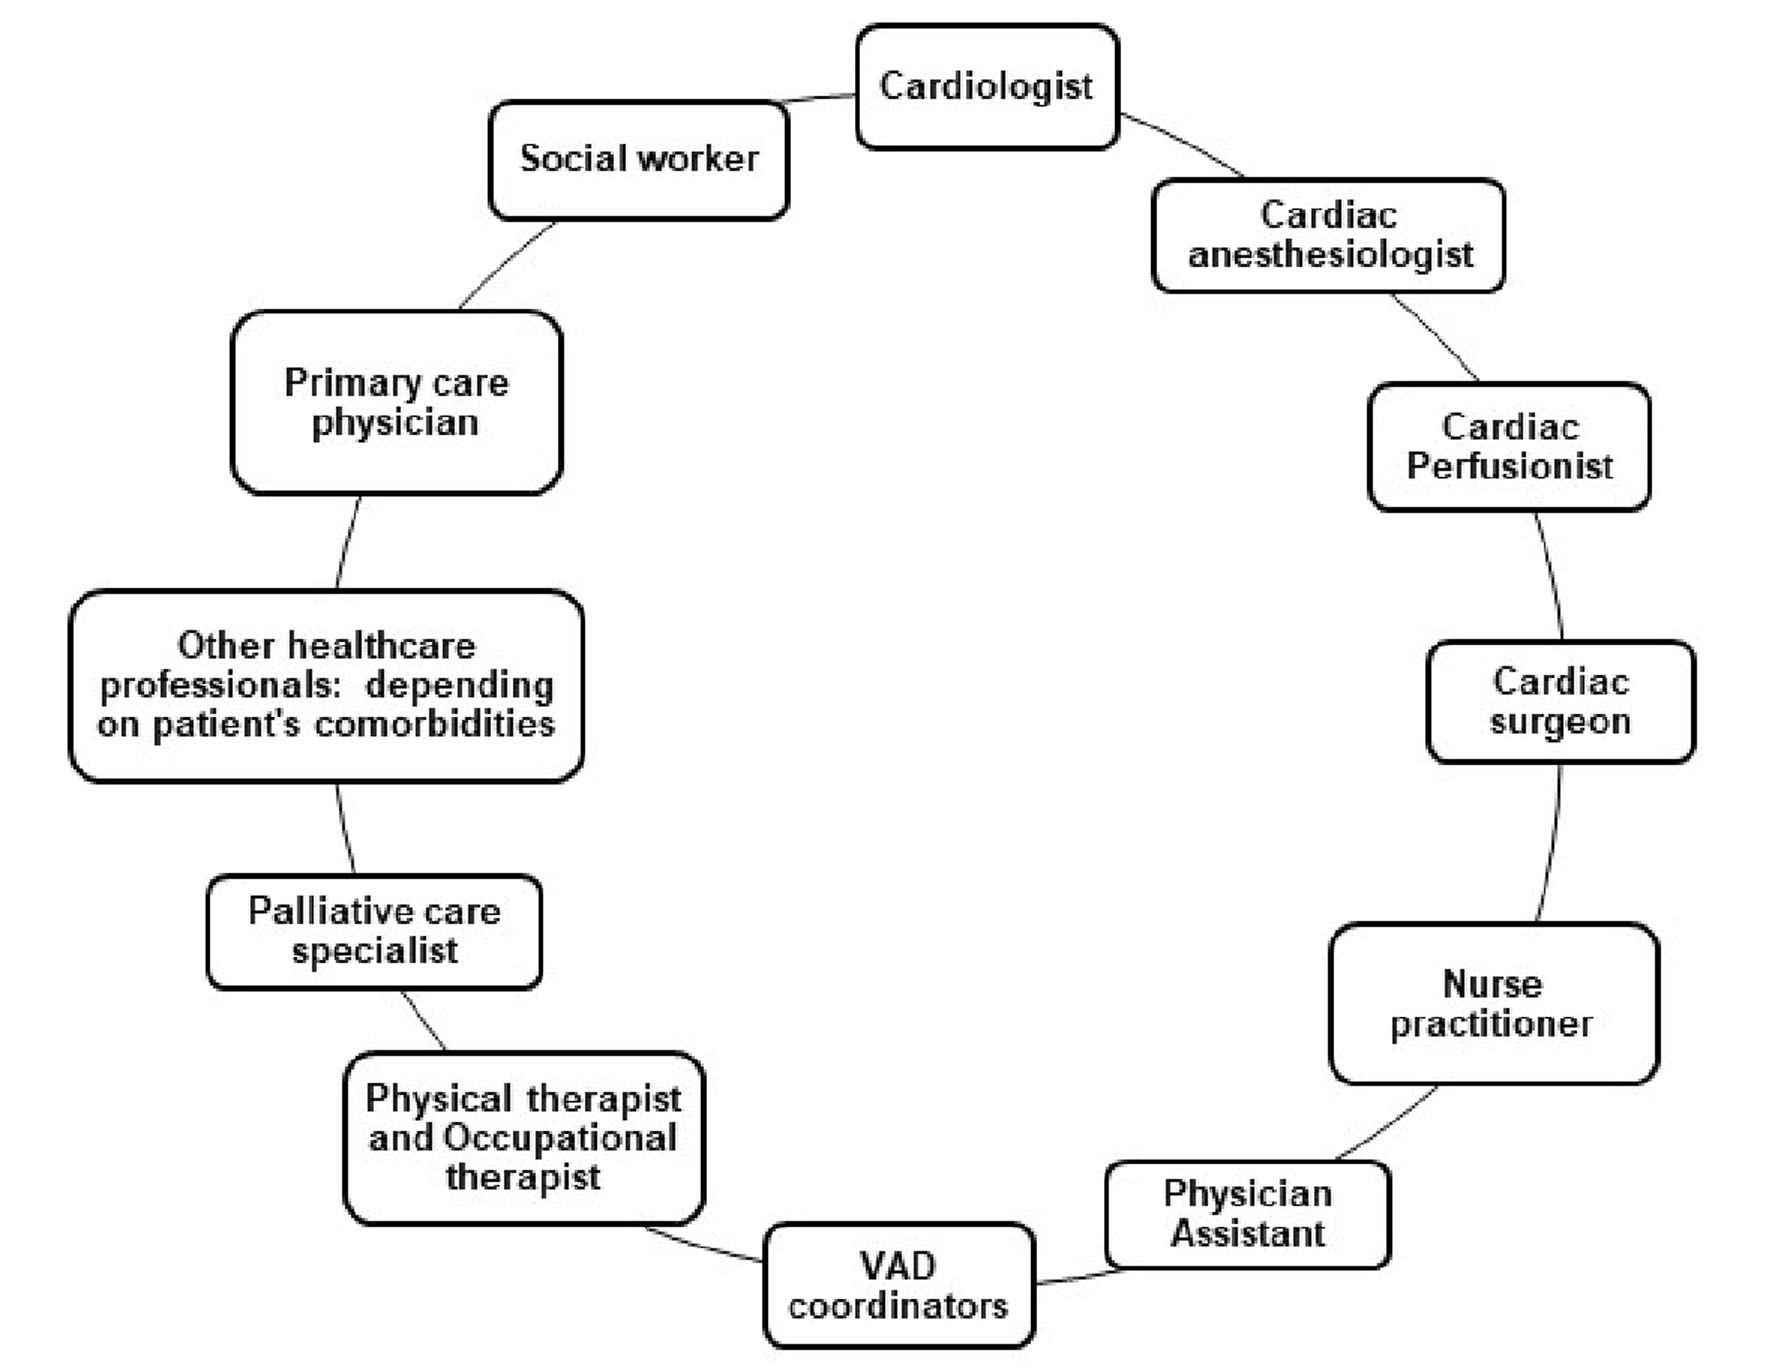
Figure 1. Multidisciplinary team commonly involved in the care of patients with VADs. VAD: ventricular assist devices.
| Journal of Clinical Medicine Research, ISSN 1918-3003 print, 1918-3011 online, Open Access |
| Article copyright, the authors; Journal compilation copyright, J Clin Med Res and Elmer Press Inc |
| Journal website https://www.jocmr.org |
Original Article
Volume 12, Number 9, September 2020, pages 543-559
Gastrointestinal Bleeding as a Complication in Continuous Flow Ventricular Assist Devices: A Systematic Review With Meta-Analysis
Figures

Tables
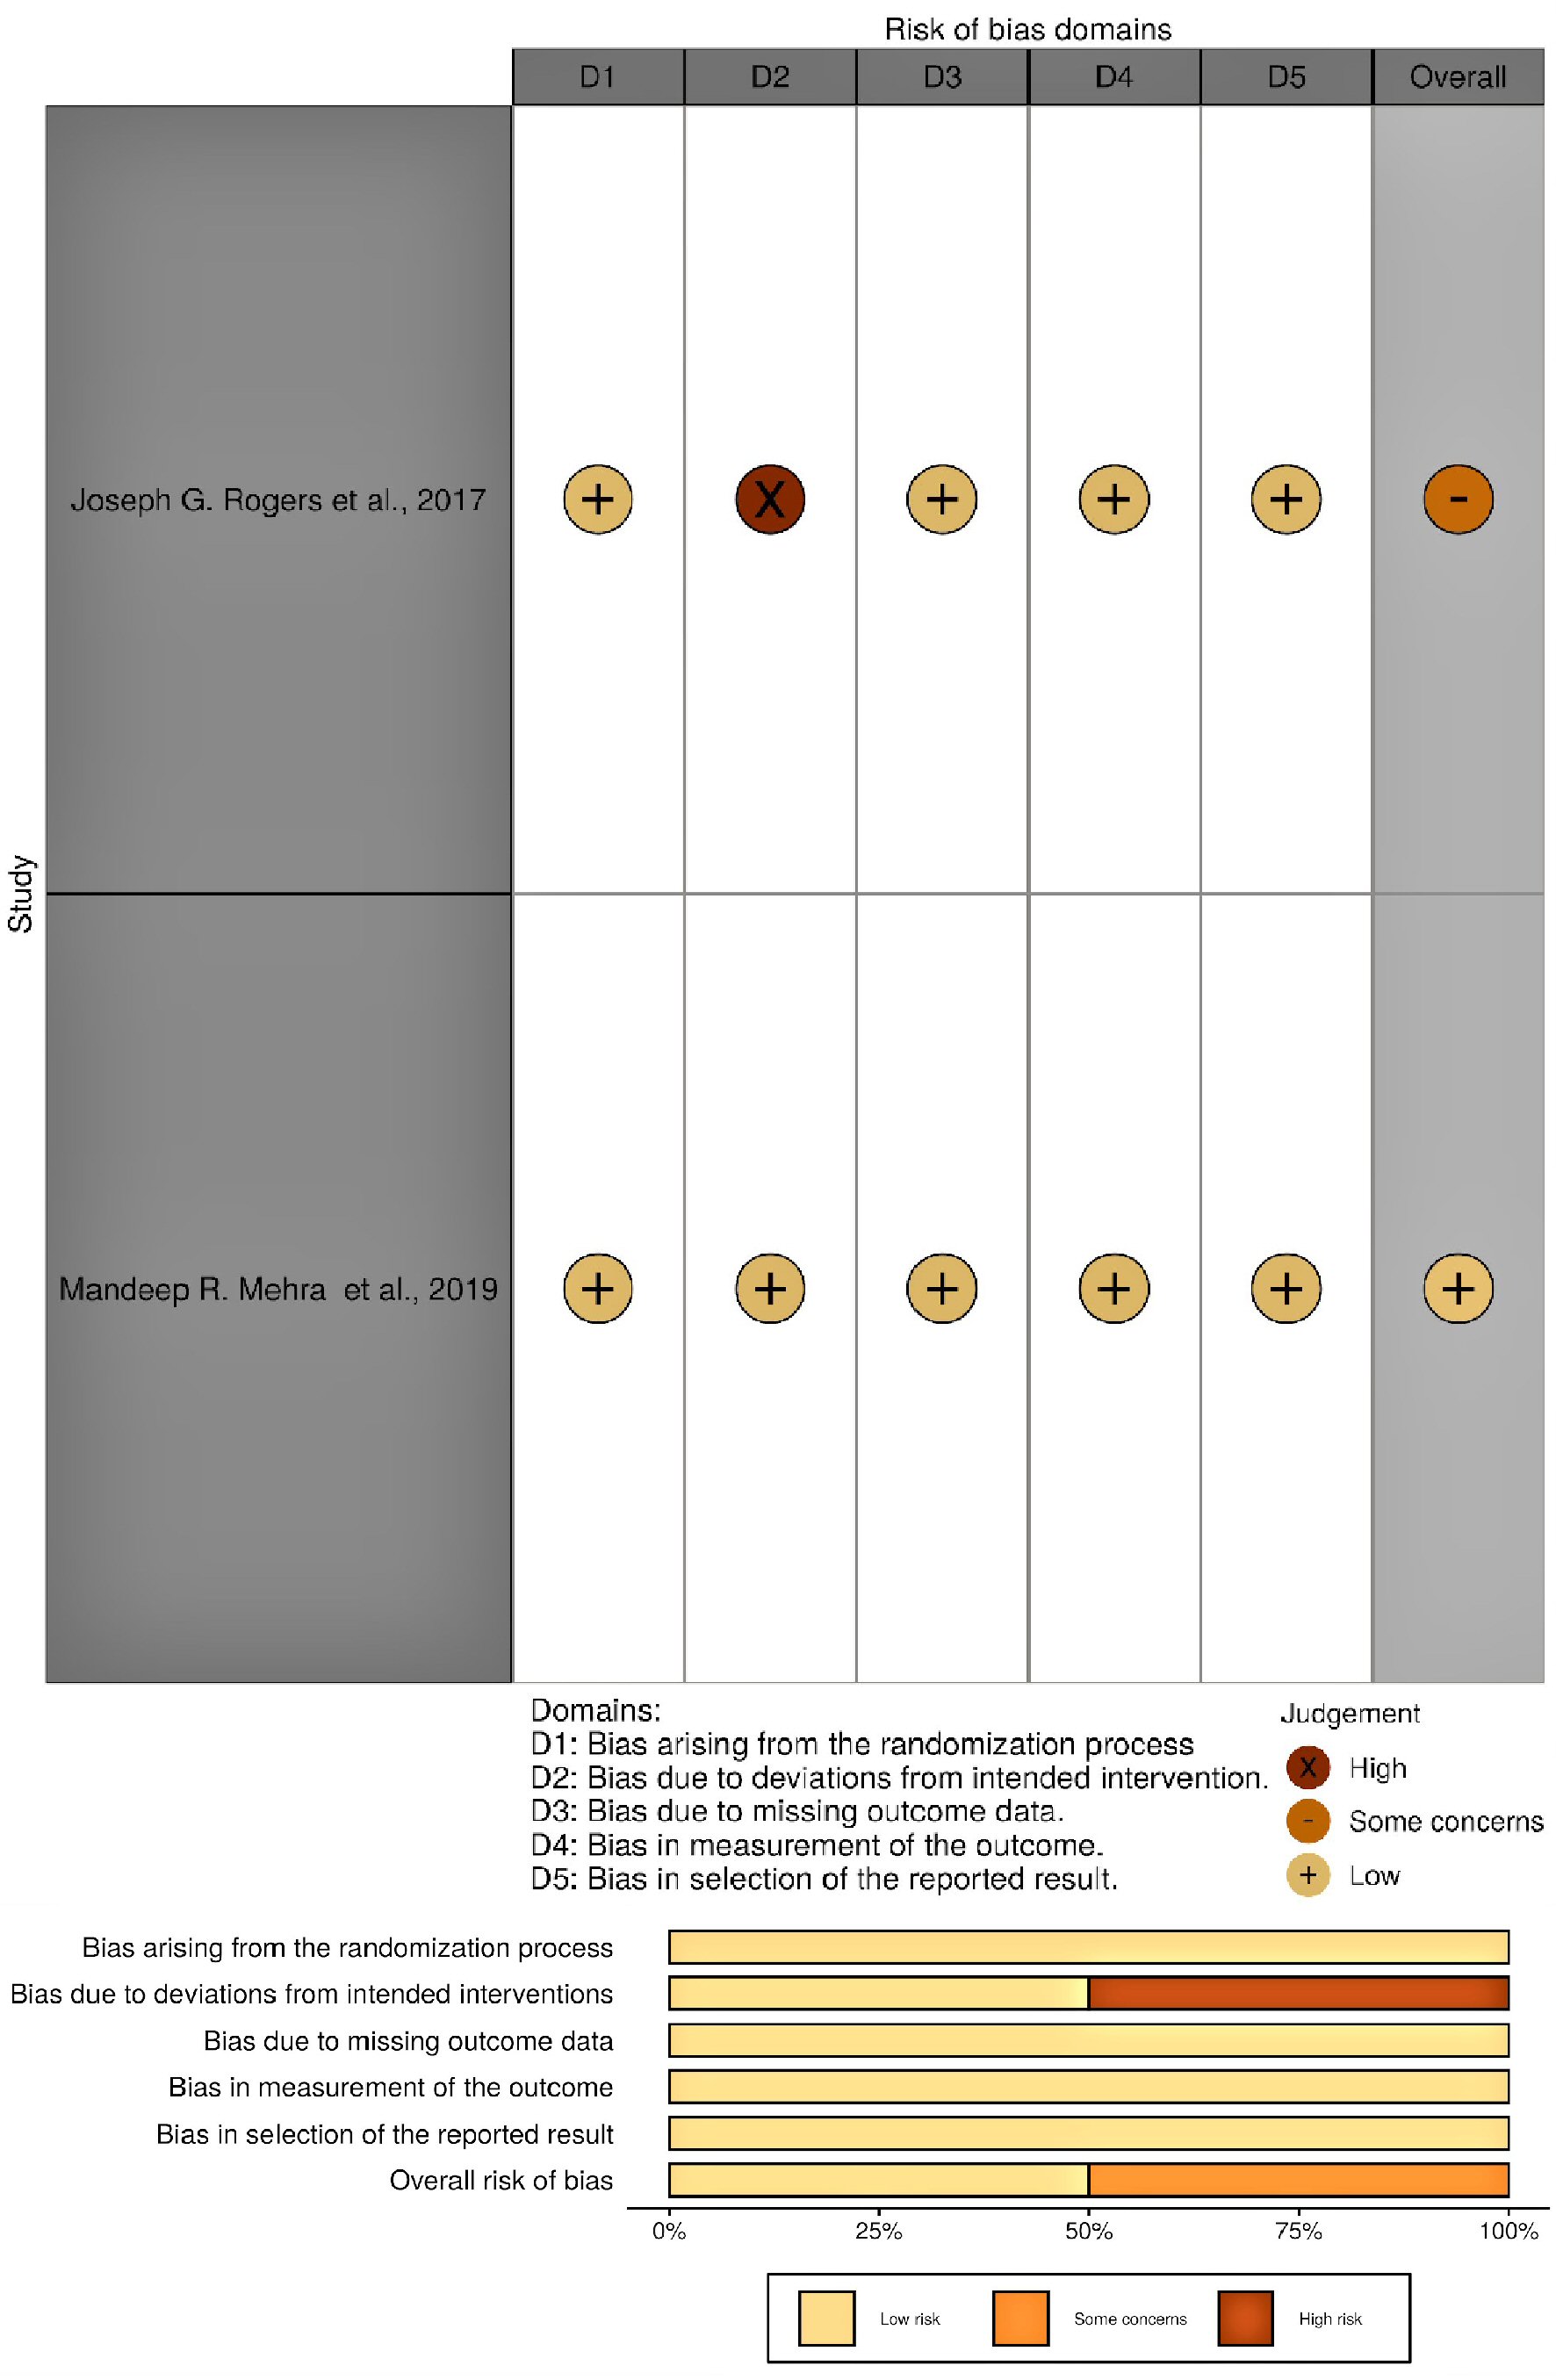
| Author | Selection (max: 4 stars) | Comparability (max: 2 stars) | Outcome/exposure (max: 3 stars) | NOS scale (max: 9 stars) |
|---|---|---|---|---|
| Gaffey et al, 2018 [33] | *** | ** | *** | 8 |
| Sheikh et, 2015 [34] | ** | ** | * | 5 |
| Stulak et al, 2016 [36] | *** | * | *** | 7 |
| Petrovic et al, 2016 [35] | *** | ** | ** | 7 |
| Centrifugal flow VAD | Axial flow VAD | |
|---|---|---|
| The target INR (IU) was 2.0 to 3.0. Aspirin was given 81mg daily, then subsequently increased to 325mg daily. Follow-up duration is 24 months. There was no significant difference in GIB between both groups. INR: international normalized ratio; VAD: ventricular assist devices; BSA: body surface area; SD: standard deviation; LVEF: left ventricular ejection fraction; INTERMACS: Interagency Registry for Mechanically Assisted Circulatory Support; GIB: gastrointestinal bleeding. | ||
| Age, mean ± SD (years) | 63.9 ± 11.6 | 66.2 ± 10.2 |
| Male, n (%) | 227 (76.4) | 122 (82.4) |
| BSA, mean ± SD (m2) | 2.0 ± 0.3 | 2.0 ± 0.3 |
| INTERMACS profiles, n (%) | ||
| Profile 1 | 10 (3.4%) | 5 (3.4%) |
| Profile 2 | 86 (29.0%) | 46 (31.1%) |
| Profile 3 | 120 (40.4%) | 60 (40.5%) |
| Profile 4 | 59 (19.9%) | 27 (18.2%) |
| Profile 5 - 7 | 22 (7.4%) | 10 (6.8%) |
| Ischemic heart failure, n (%) | 172 (57.9%) | 89 (60.1%) |
| Platelet count, mean ± SD (per mm3) | 200,400 ± 71,300 | 202,400 ± 75,700 |
| LVEF, mean ± SD (%) | 17.1 ± 4.6 | 16.2 ± 4.8 |
| Serum creatinine, mean ± SD (mg/dL) | 1.5 ± 0.5 | 1.4 ± 0.5 |
| Hypertension, n (%) | 194 (65.3%) | 105 (70.9%) |
| Centrifugal flow VAD | Axial flow VAD | |
|---|---|---|
| The target INR (IU) is 2.0 to 3.0 IU, with aspirin at 81mg to 325mg daily for each group. Follow-up duration is 24 months. Outcome: GIB was lower in centrifugal flow VAD group as compared to axial flow VAD group. It was reported that for every 10 patients who received centrifugal flow VAD instead of axial flow VAD, 3.6 GIB events were avoided in 2 years. Nevertheless, a significant residual risk of bleeding was reported, with the investigators prompting further investigations to see if a reduction in antiplatelet or anticoagulation therapy will be beneficial to these patients. INR: international normalized ratio; VAD: ventricular assist devices; BSA: body surface area; SD: standard deviation; LVEF: left ventricular ejection fraction; INTERMACS: Interagency Registry for Mechanically Assisted Circulatory Support; GIB: gastrointestinal bleeding. | ||
| Age, mean ± SD (years) | 59 ± 12 | 60 ± 12 |
| BSA, mean ± SD (m2) | 2.1 ± 0.3 | 2.1 ± 0.3 |
| Male, n (%) | 411 (79.7) | 419 (81.8) |
| Ischemic heart disease, n (%) | 216 (41.9) | 240 (46.9) |
| LVEF, mean ± SD (%) | 17.3 ± 5.1 | 17.2 ± 5.0 |
| Mean arterial pressure, mean ± SD (mm Hg) | 79.2 ± 10.4 | 79.2 ± 10.1 |
| Cardiac index, mean ± SD (L/min/m2) | 2.0 ± 0.5 | 2.0 ± 0.6 |
| Serum creatinine, mean ± SD (mg/dL) | 1.4 ± 0.4 | 1.4 ± 0.4 |
| INTERMACS profile, n (%) | ||
| Profile 1 | 11 (2.1) | 18 (3.5) |
| Profile 2 | 156 (30.2) | 146 (28.5) |
| Profile 3 | 272 (52.7) | 251 (49.0) |
| Profile 4 | 67 (13.0) | 82 (16.0) |
| Profile 5 - 7 or not provided | 10 (1.9) | 15 (2.9) |
| Centrifugal flow VAD | Axial flow VAD | |
|---|---|---|
| The target INR (IU) is 2.0 to 3.0 IU; 325 mg of aspirin. Follow-up: 36 months. Outcome: there was no significant difference in GIB between both groups. INR: international normalized ratio; VAD: ventricular assist devices; SD: standard deviation; LVEF: left ventricular ejection fraction; INTERMACS: Interagency Registry for Mechanically Assisted Circulatory Support; GIB: gastrointestinal bleeding; BMI: body mass index. | ||
| Age (years) | 57.2 + 14.6 | 56.5 + 13.9 |
| Male, n (%) | 27 (81.8) | 83 (79.1) |
| BMI (kg/m2) | 29.5 + 6.2 | 29.2 + 6.8 |
| Platelet (× 103/mm3) | 191.9 + 83.4 | 184.9 + 69.8 |
| Prothrombin time (s) | 52.3 + 3.9 | 52.6 + 2.5 |
| LVEF (%) | - | - |
| Past medical history, n (%) | ||
| Gastrointestinal bleeding | 1 (2.9) | 4 (3.9) |
| Hypertension | 19 (55.9) | 55 (52.9) |
| Chronic renal insufficiency | 10 (30.3) | 37 (35.2) |
| Coronary artery disease | 18 (53.0) | 49 (46.7) |
| INTERMACS profile, n (%) | ||
| Profile 1 | 5 (14.7) | 12 (14.3) |
| Profile 2 | 14 (41.2) | 39 (37.1) |
| Profile 3 | 15 (44.1) | 36 (34.3) |
| Profile 4 | - | 14 (13.3) |
| Profile 5 | - | 1 (0.9) |
| Centrifugal flow VAD | Axial flow VAD | |
|---|---|---|
| Target INR (IU): as reported by the investigators, the mean INR (IU) at the time of GIB did not differ between the two groups: 2.57 ± 2.3 for HeartMate II and 2.56 ± 1.9 for HeartWare VAD, P value = 0.9. Outcome: There was no significant difference in the cumulative incidence of GIB between both groups. INR: international normalized ratio; VAD: ventricular assist devices; SD: standard deviation; LVEF: left ventricular ejection fraction; GIB: gastrointestinal bleeding. | ||
| Age, mean ± SD (years) | 58 ± 11 | 59 ± 11 |
| Men (%) | 61% | 88% |
| Median time to first GIB (months) | 3.5 ± 0.98 | 8.2 ± 3.5 |
| Experienced more than one GIB | 10% | 9% |
| LVEF (%) | - | - |
| Mean follow-up duration (years) | 1.3 | 1.0 |
| GIB group | Non-GIB group | |
|---|---|---|
| Results are expressed as mean ± SD. Median follow-up time: 6 months; maximum: 23 months. Anticoagulation regimen: 81 mg aspirin and a target INR (IU) of 2.0 - 3.0. At the first GIB event, target INR range was reduced to 1.5 - 2.0 IU and supplemented by 81 mg aspirin. A second event prompted the cessation of antiplatelet agents and continued use of warfarin at INR level of 1.5 - 2.0 IU. Outcome: As reported by the investigators, patients with GIB were all men with 17 episodes of GIB reported (index cases). The mean age of patients in the GIB group was 59 ± 8 years; with 11 out of 17 episodes occurring within the first month after the pump implantation. Fourteen patients had a single episode, and three patients had multiple bleeding episodes. All patients with multiple GIBs had a HeartMate II pump and the only risk factor significant for GIB was the presence of chronic kidney disease; with OR = 3.95; 95% CI: 1.21 - 12.84; P = 0.02. All patients with GIB presented with anemia, eight with melena, one with hematemesis, six without an obvious bleeding source, and two with only positive guaiac stool tests. Esophagogastroduodenoscopy (EGD), small-bowel enteroscopy, and colonoscopy confirmed bleeding sources in 13 patients. Arteriovenous malformations (AVMs) were identified as the major source of bleeding in eight out of 13 patients (61%). In two patients endoscopy confirmed bleeding from two sources during the same GIB episode. One patient had both gastric and jejunal AVM. The other patient had rectal AVM and sigmoid colon diverticulosis. In one patient, the small bowel AVM was identified only by on-table push enteroscopy because EGD, colonoscopy, nuclear medicine study, and angiograms failed to diagnose the bleeding source. Only one patient with multiple GIB episodes was diagnosed with coagulopathy, and one patient had GIB whenever his INR value was above 2 IU. GIB was noted to occur more often within the first month after implantation. The presence of blood type O was not associated with increased risk of bleeding. INR: international normalized ratio; VAD: ventricular assist devices; SD: standard deviation; LVEF: left ventricular ejection fraction; INTERMACS: Interagency Registry for Mechanically Assisted Circulatory Support; GIB: gastrointestinal bleeding; OR: odds ratio; CI: confidence interval. | ||
| Age (years) | 59 ± 8 | 54 ± 13 |
| Men/women (n) | 17/0 | 48/6 |
| Bleeding events reported for each device | ||
| HeartWare VAD | 6 (35) | 15 (28) |
| HeartMate II VAD | 11(65) | 39 (72) |
| Body mass index (kg/m2) | 29.1 ± 6.3 | 29.9 ± 7.0 |
| LVEF (%) | 19 ± 5 | 20 ± 7 |
| Chronic kidney disease, n (%) | 11 (65) | 16 (30) |
| Creatinine (mg/dL) | 1.83 ± 1.4 | 1.62 ± 0.8 |
| Gastrointestinal ulcer, n (%) | 1 (6) | 1 (2) |
| INR (IU) | 1.2 ± 0.2 | 1.4 ± 0.6 |
| INTERMACS profile, n (%) | ||
| Profile 1 | 5 (29) | 20 (37) |
| Profile 2 | 7 (41) | 13 (24) |
| Profile 3 | 3 (18) | 16 (30) |
| Profile 4 - 7 | 2 (12) | 5 (9) |
| Centrifugal flow VAD | Axial flow VAD | |
|---|---|---|
| Follow-up: median of 1 year (max: 10 years). Anticoagulation regimen: all patients in the HeartWare (centrifugal flow VAD) group were maintained on 325 mg of aspirin. Dipyridamole was used almost routinely by one of the institutions and selectively by others. Clopidogrel (Plavix) was utilized on a case by case basis when pump thrombus or hemolysis occurred. Patients were routinely bridged with unfractionated intravenous heparin when INR fell below 2.0 IU. INR range for the HeartMate II (axial flow VAD) group was 1.5 - 2.5 and 2.0 - 3.0 for the HeartWare group. Additional outcomes reported: the investigators reported older age at implant, preoperative inotrope use and preoperative creatinine were reported as independent predictors of gastrointestinal bleeding. The risk of bleeding in the HeartMate II group was found to be highest when the INR was > 2.5 IU. INR: international normalized ratio; VAD: ventricular assist devices; SD: standard deviation; LVEF: left ventricular ejection fraction; INTERMACS: Interagency Registry for Mechanically Assisted Circulatory Support; GIB: gastrointestinal bleeding; AVM: arteriovenous malformation; BMI: body mass index. | ||
| Age (years), median (range) | 58.3 (18.0 - 82.0) | 59.5 (18.0 - 82.0) |
| BMI (kg/m2), median (range) | 27.6 (2.0 - 142.2) | 28.5 (16.3 - 43.7) |
| Male, n (%) | 126 (72) | 465 (83) |
| Female, n (%) | 48 (28) | 95 (17) |
| Creatinine (mg/dL), mean (SD) | 1.3 (0.5) | 1.4 (0.5) |
| Preoperative inotropes, n (%) | 126 (74.6) | 425 (76.4) |
| INTERMACS profiles, n (%) | ||
| Profile 1 | 19 (11) | 74 (13) |
| Profile 2 | 25 (14) | 125 (22) |
| Profile 3 | 78 (45) | 185 (33) |
| Profile 4 - 7 | 52 (30) | 176 (32) |
| Mean (SD) | 2.9 (1.1) | 2.8 (1.1) |
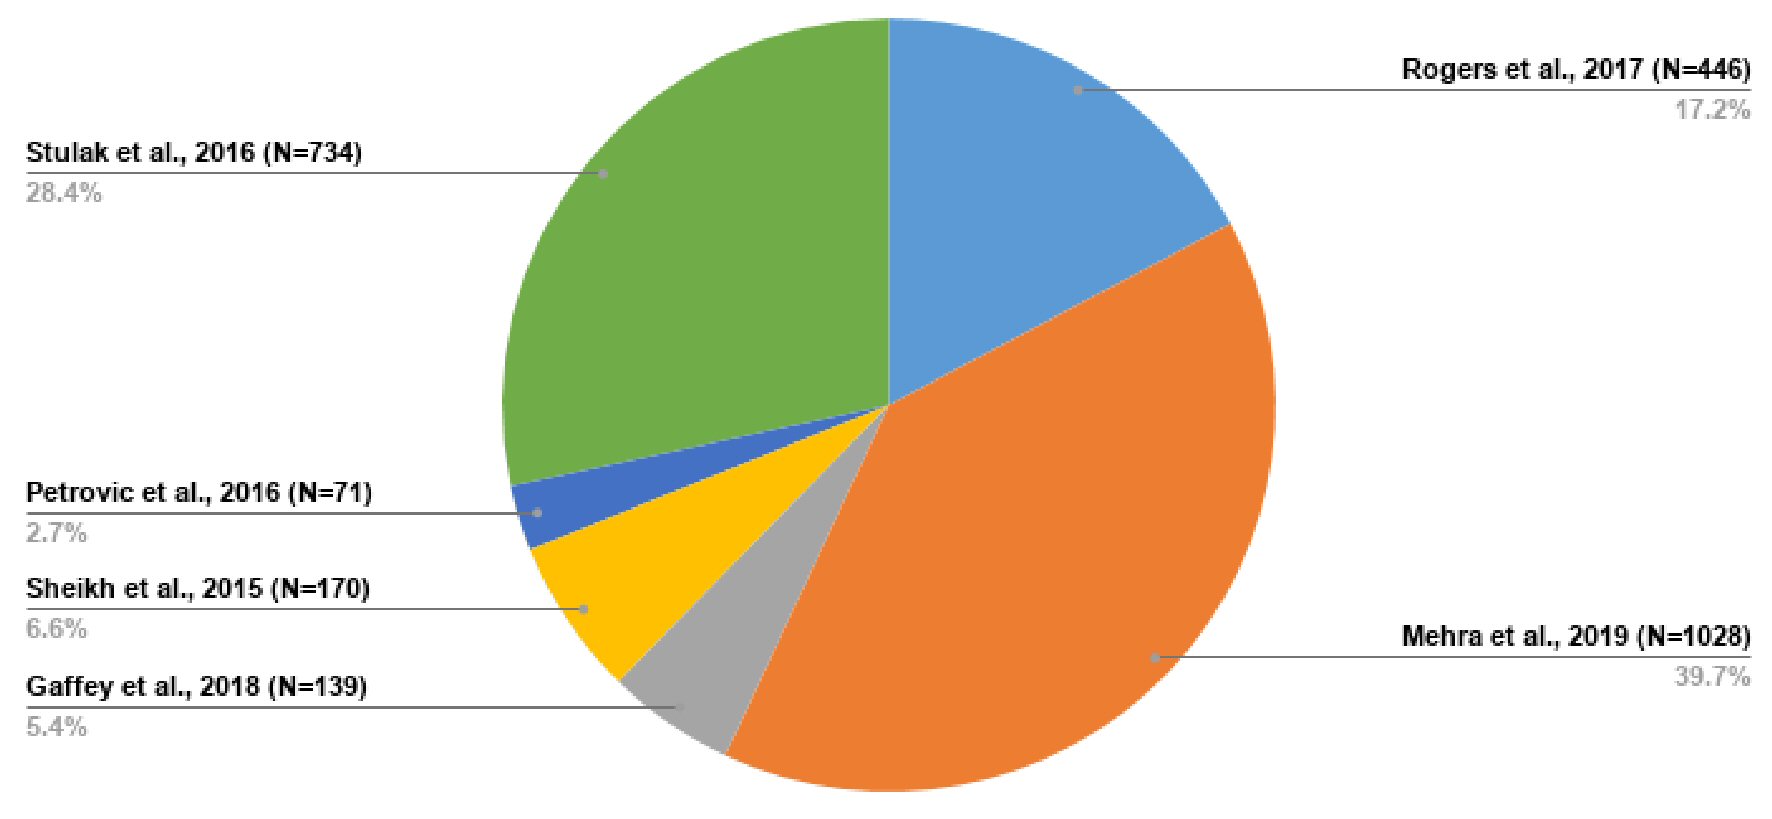
| Included studies | Sample size (n) | Percentage distribution |
|---|---|---|
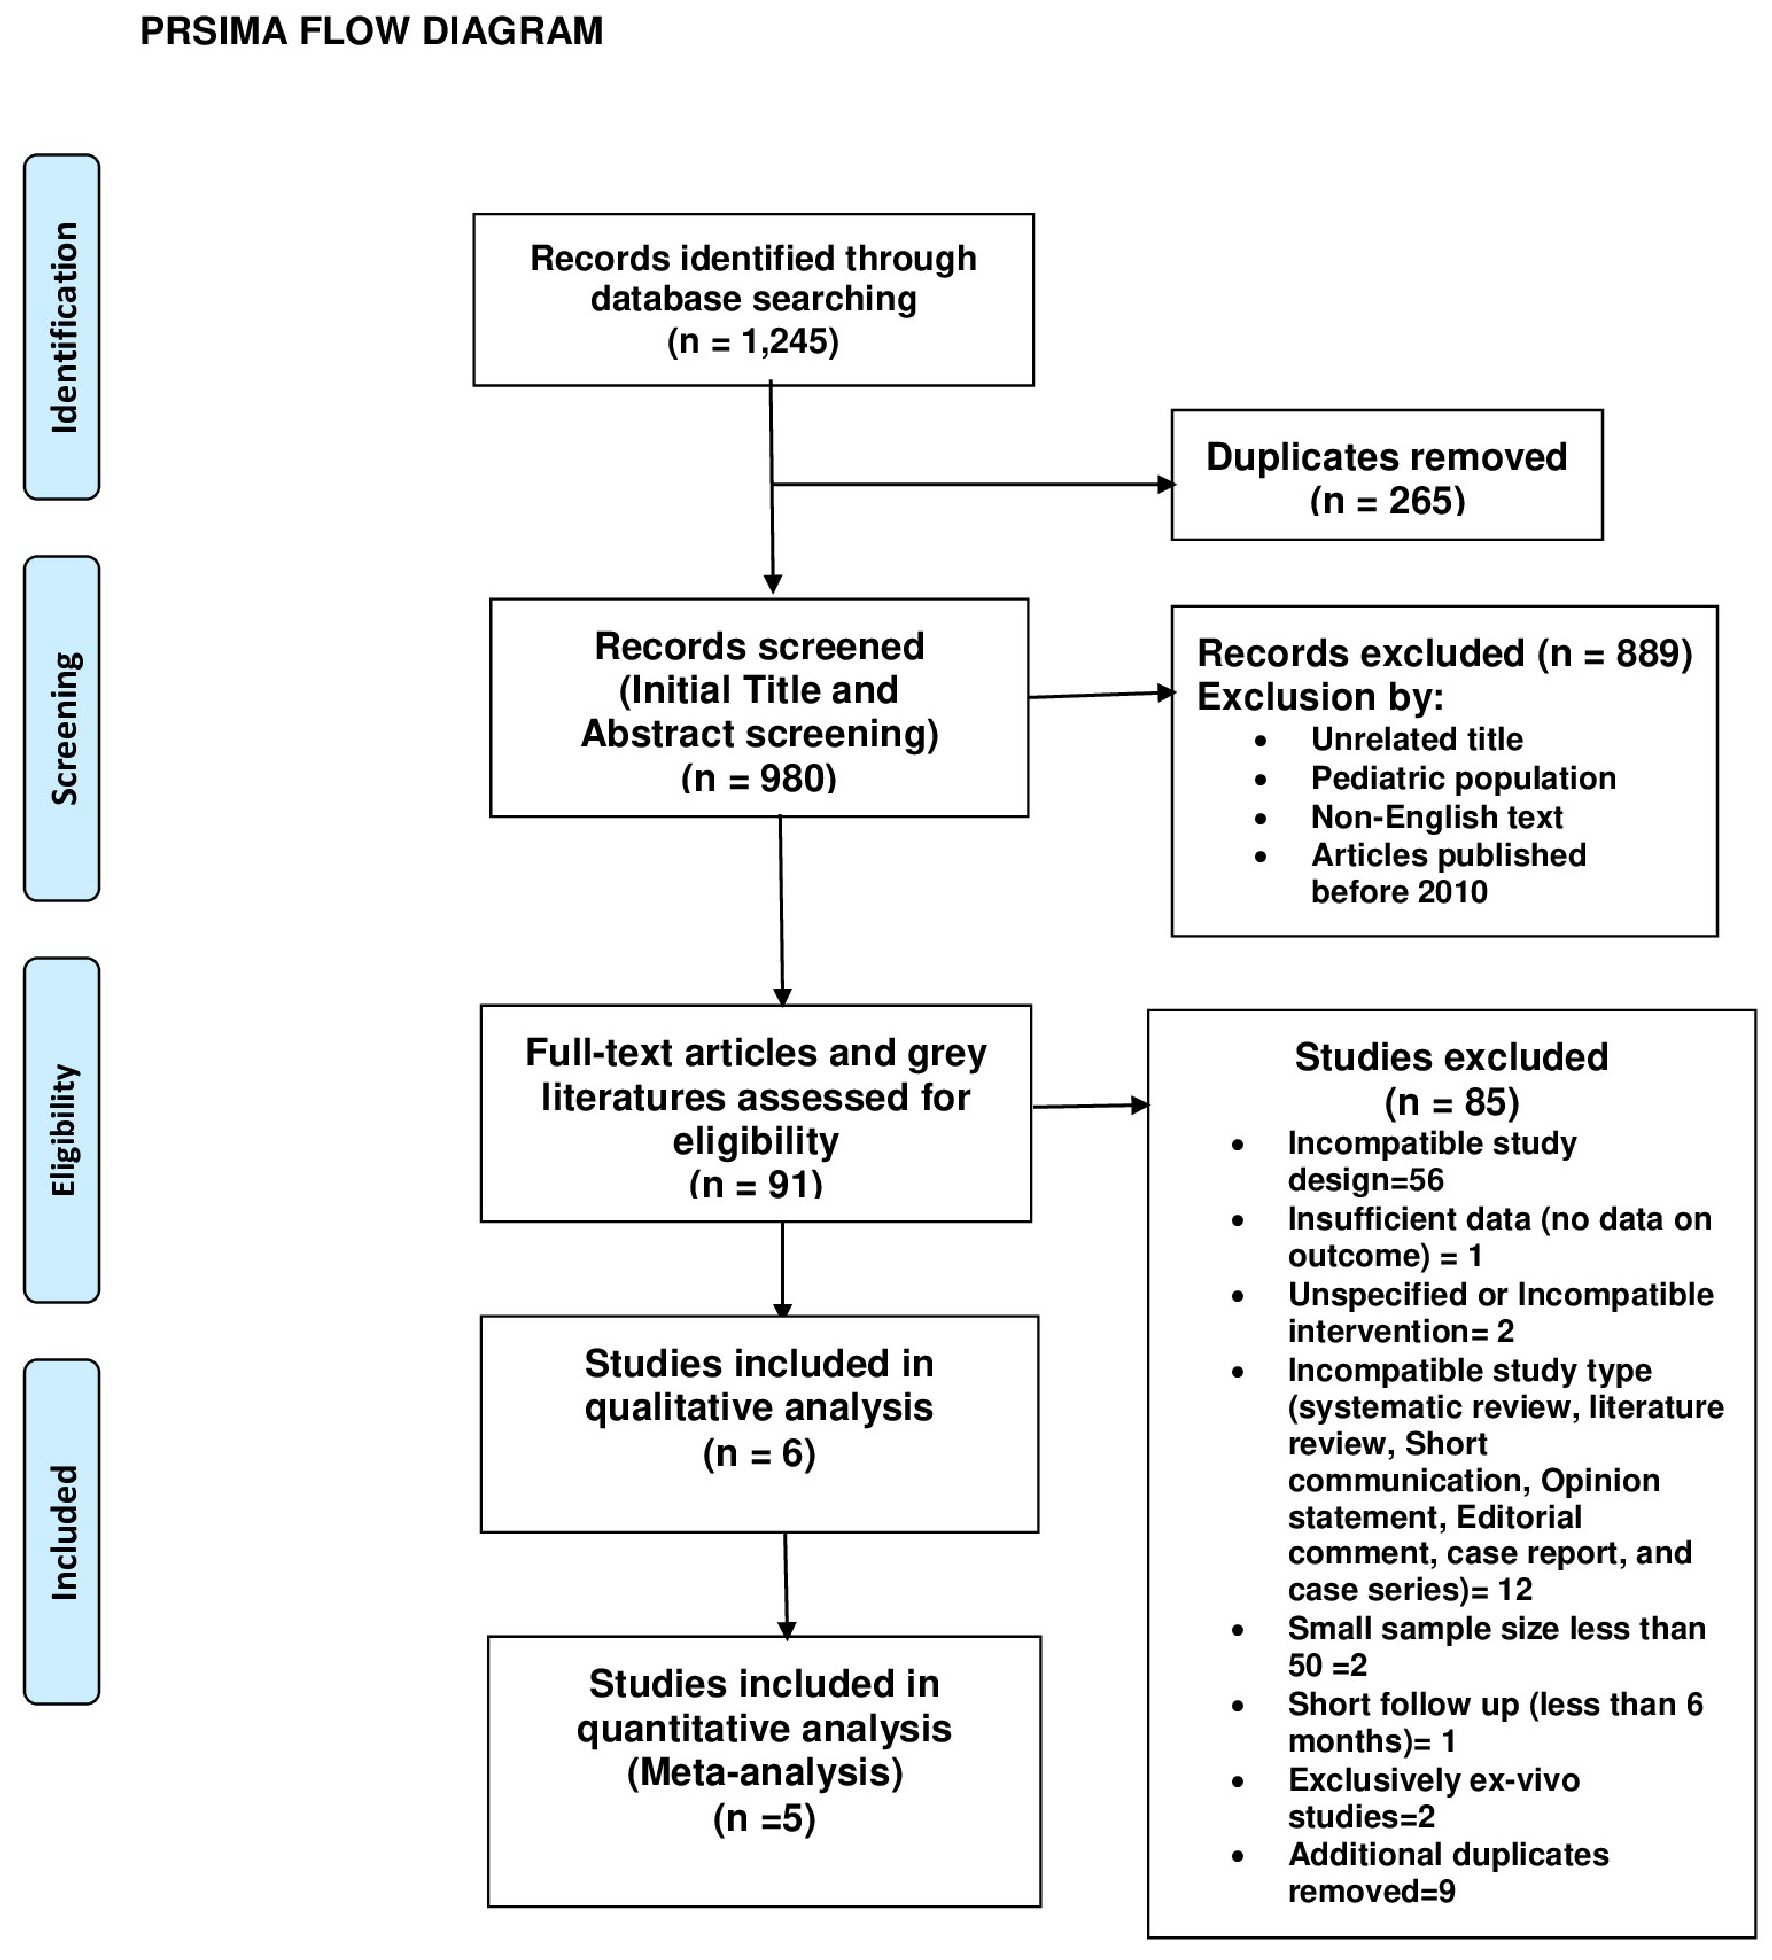
| The initial study size was 2,588, but with the study of Stulak et al [36] excluded from the meta-analysis, the meta-analysis consisted of 1,854 participants. The study of Stulak et al [36] was used concomitantly with other studies for narrative synthesis. | ||
| Rogers et al, 2017 [37] | 446 | 17.23% |
| Mehra et al, 2019 [38] | 1,028 | 39.72% |
| Gaffey et al, 2018 [33] | 139 | 5.37% |
| Sheikh et al, 2015 [34] | 170 | 6.57% |
| Petrovic et al, 2016 [35] | 71 | 2.74% |
| Stulak et al, 2016 [36] | 734 | 28.36% |
| Total | 2,588 | 100.00% |
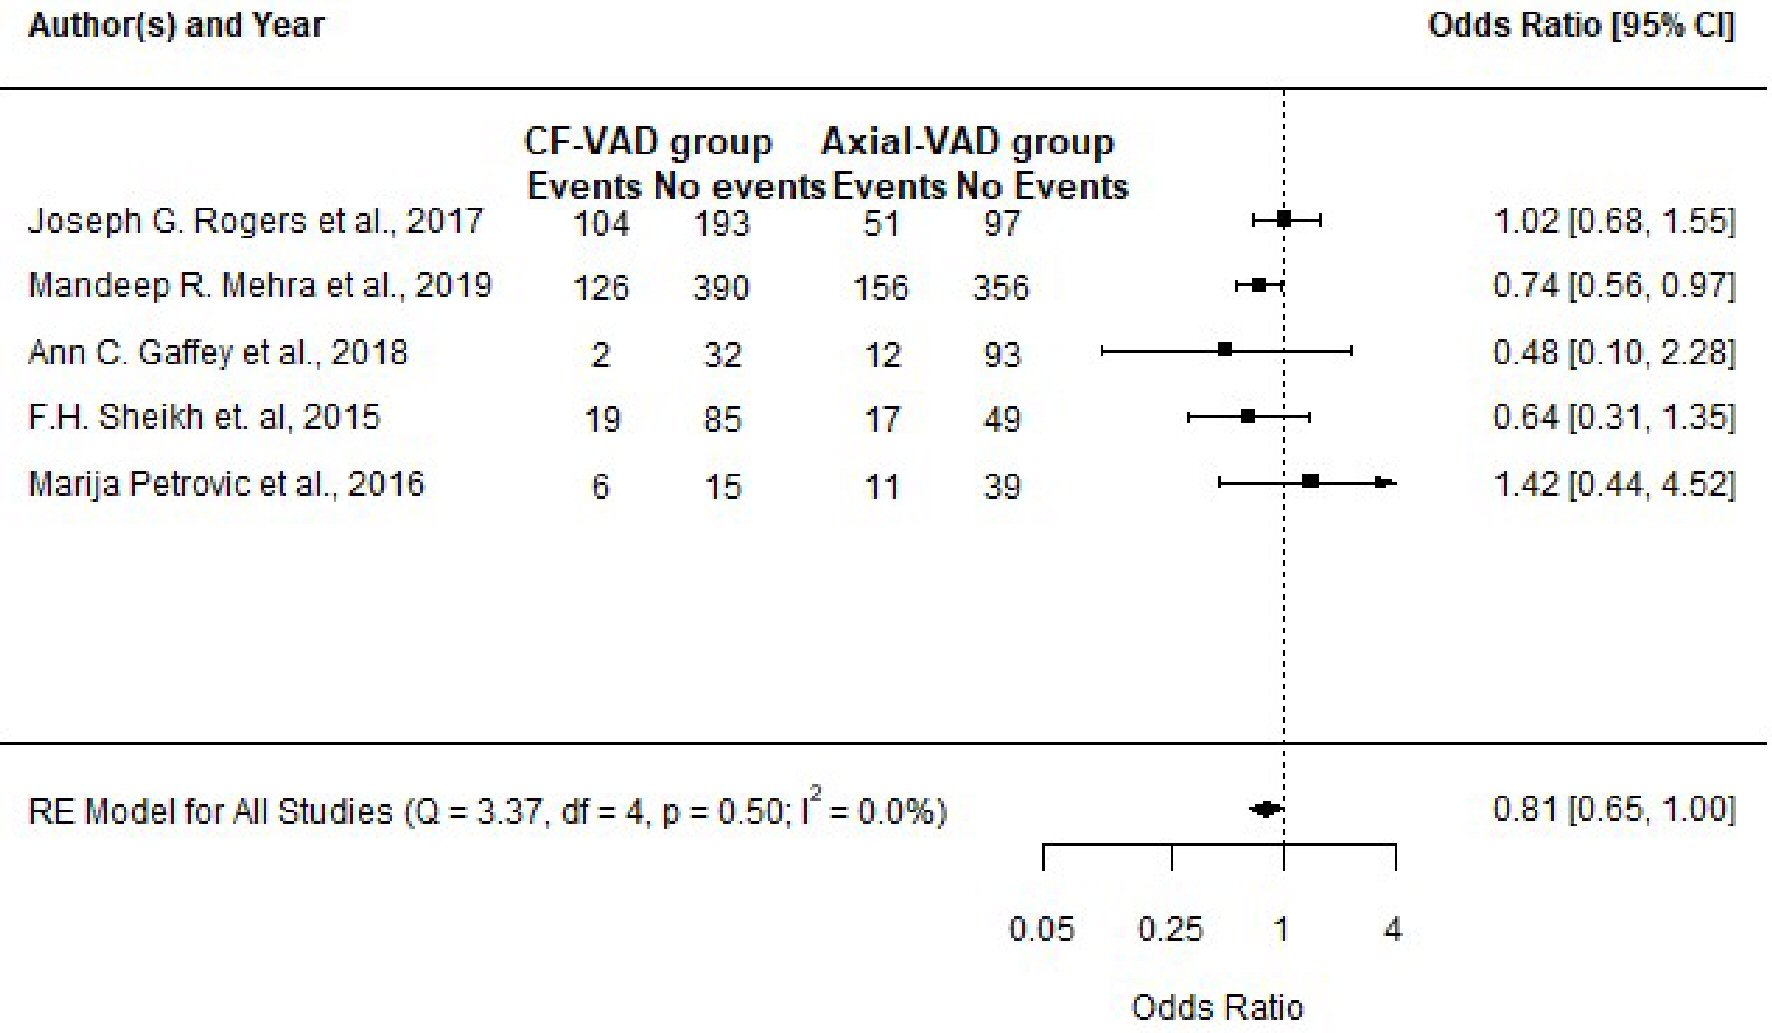
| Study | Centrifugal flow VAD group (events) | Axial flow VAD group (events) | P value (Fisher’s exact test) testing difference in proportion | Odds ratio with 95% CI and P value (inverse variance method; values confirmed with “epiR” tool) |
|---|---|---|---|---|
| VAD: ventricular assist device; n: sample size within each group per study; CI: confidence interval (95% limit). | ||||
| Rogers et al, 2017 [37] | 104 (n = 297) | 51 (n = 148) | 1.000 | 1.02 (0.68 - 1.55) |
| P value = 0.91 | ||||
| Mehra et al, 2019 [38] | 126 (n = 516) | 156 (n = 512) | 0.030 | 0.74 (0.56 - 0.97) |
| P value = 0.03 | ||||
| Gaffey et al, 2018 [33] | 2 (n = 34) | 12 (n = 105) | 0.517 | 0.48 (0.10 - 2.28) |
| P value = 0.35 | ||||
| Sheikh et al, 2015 [34] | 19 (n = 104) | 17 (n = 66) | 0.254 | 0.64 (0.31 - 1.35) |
| P value = 0.24 | ||||
| Petrovic et al, 2016 [35] | 6 (n = 21) | 11 (n = 50) | 0.557 | 1.42 (0.44 - 4.52) |
| P value = 0.55 | ||||