Journal of Clinical Medicine Research, ISSN 1918-3003 print, 1918-3011 online, Open Access
Article copyright, the authors; Journal compilation copyright, J Clin Med Res and Elmer Press Inc
Journal website https://www.jocmr.org

Original Article

Volume 12, Number 9, September 2020, pages 612-617


Serum Irisin Levels and Clinical Implication in Elderly Patients With Type 2 Diabetes Mellitus

Figure

Figure 1.
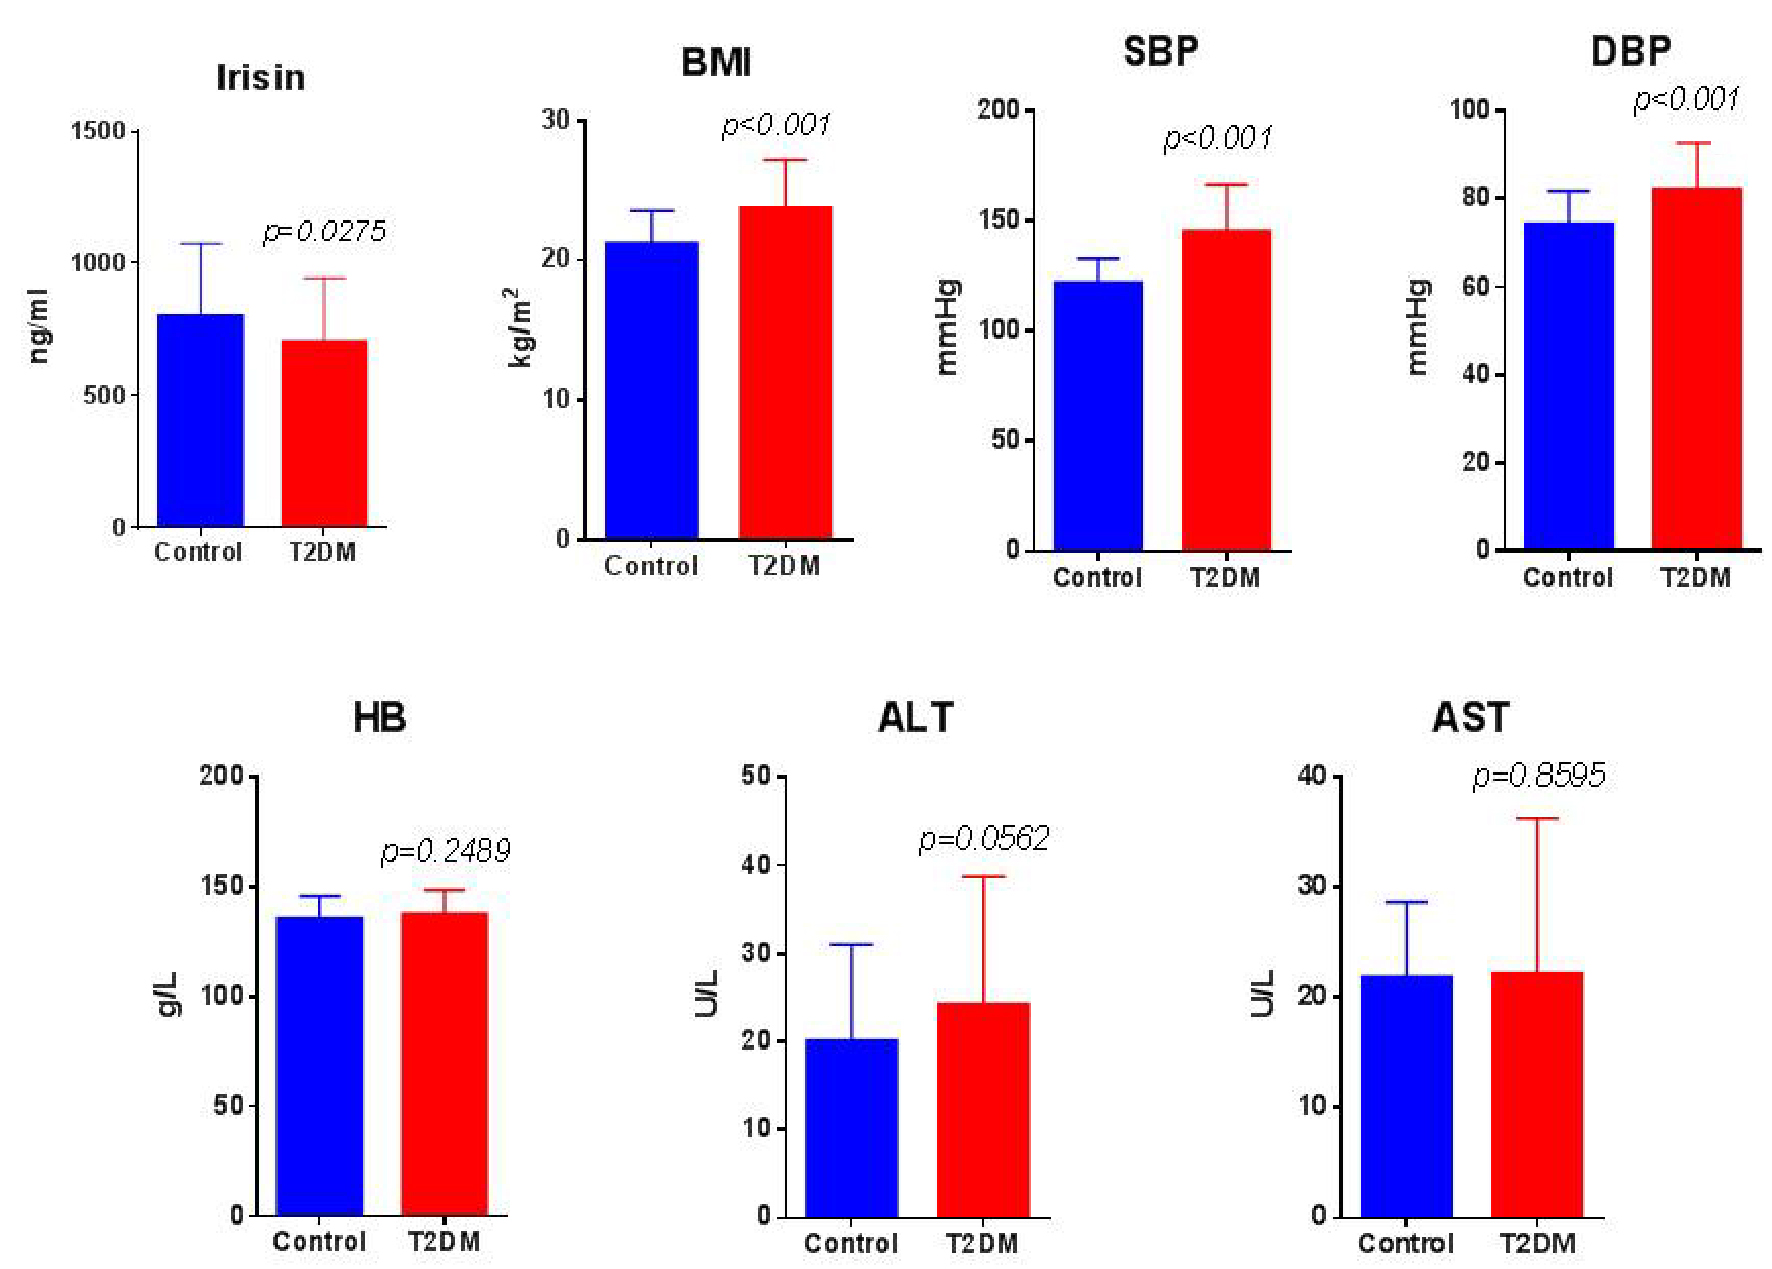
Figure 1. Irisin level in serum and clinical parameters between T2DM group and control group. Comparisons of irisin (ng/mL), BMI (kg/m2), systolic and diastolic blood pressure (SBP and DBP, mm Hg), hemoglobin (HB, g/L), alanine aminotransferase (ALT) and aspartate aminotransferase (AST, U/L) between groups. T2DM group: n = 71, and control group: n = 71. BMI: body mass index; T2DM: type 2 diabetes mellitus.

Tables

Table 1. Comparison of Irisin Level and Clinical Indices Between T2DM Group and Control Group
 
GroupsDiabetesControlP values
T2DM: type 2 diabetes mellitus; BMI: body mass index; SBP: systolic blood pressure; DBP: diastolic blood pressure; HB: hemoglobin; ALT: alanine aminotransferase; AST: aspartate aminotransferase.
Irisin (ng/mL)703.4 ± 241.5800.2 ± 275.60.03
BMI (kg/m2)23.7 ± 3.521.2 ± 2.3< 0.001
SBP (mm Hg)145.4 ± 21.3122.0 ± 10.9< 0.001
DBP (mm Hg)81.9 ± 10.774.1 ± 7.6< 0.001
HB (g/L)137.4 ± 11.2135.3 ± 10.60.25
ALT (U/L)24.2 ± 14.520.1 ± 11.00.06
AST (U/L)22.1 ± 14.121.8 ± 6.90.86


Table 2. Comparison of Laboratory Test Parameters Between T2DM Group and Control Group
 
GroupsDiabetesControlP values
* P < 0.05. T2DM: type 2 diabetes mellitus; ALB: albumin; Cr: serum creatinine; BUN: blood urea nitrogen; FPG: fasting plasma glucose; CHOL: total cholesterol; TG: triglyceride.
ALB (g/L)46.4 ± 2.446.0 ± 1.90.335
Cr (µmol/L)66.9 ± 20.869.8 ± 16.50.37
BUN (mmol/L)5.4 ± 1.35.3 ± 1.40.89
CHOL (mmol/L)5.6 ± 1.05.3 ± 0.80.06
TG (mmol/L)1.7 ± 1.31.0 ± 0.7< 0.001*
FPG (mmol/L)8.7 ± 5.55.3 ± 0.5< 0.001*


Table 3. Logistic Regression Analysis of Influencing Factors of Diabetes Mellitus
 
Influencing factorsβsxWaldχ2P valueOR (95% CI)
* P < 0.05. SBP: systolic blood pressure; FPG: fasting plasma glucose; OR: odds ratio; 95% CI: 95% confidence interval.
Irisin-0.0030.0015.8550.0160.997 (0.994 - 0.999)
SBP0.1150.02717.711< 0.001*1.122 (1.063 - 1.183)
FPG1.7830.43716.633< 0.001*5.950 (2.525 - 14.020)