Figures
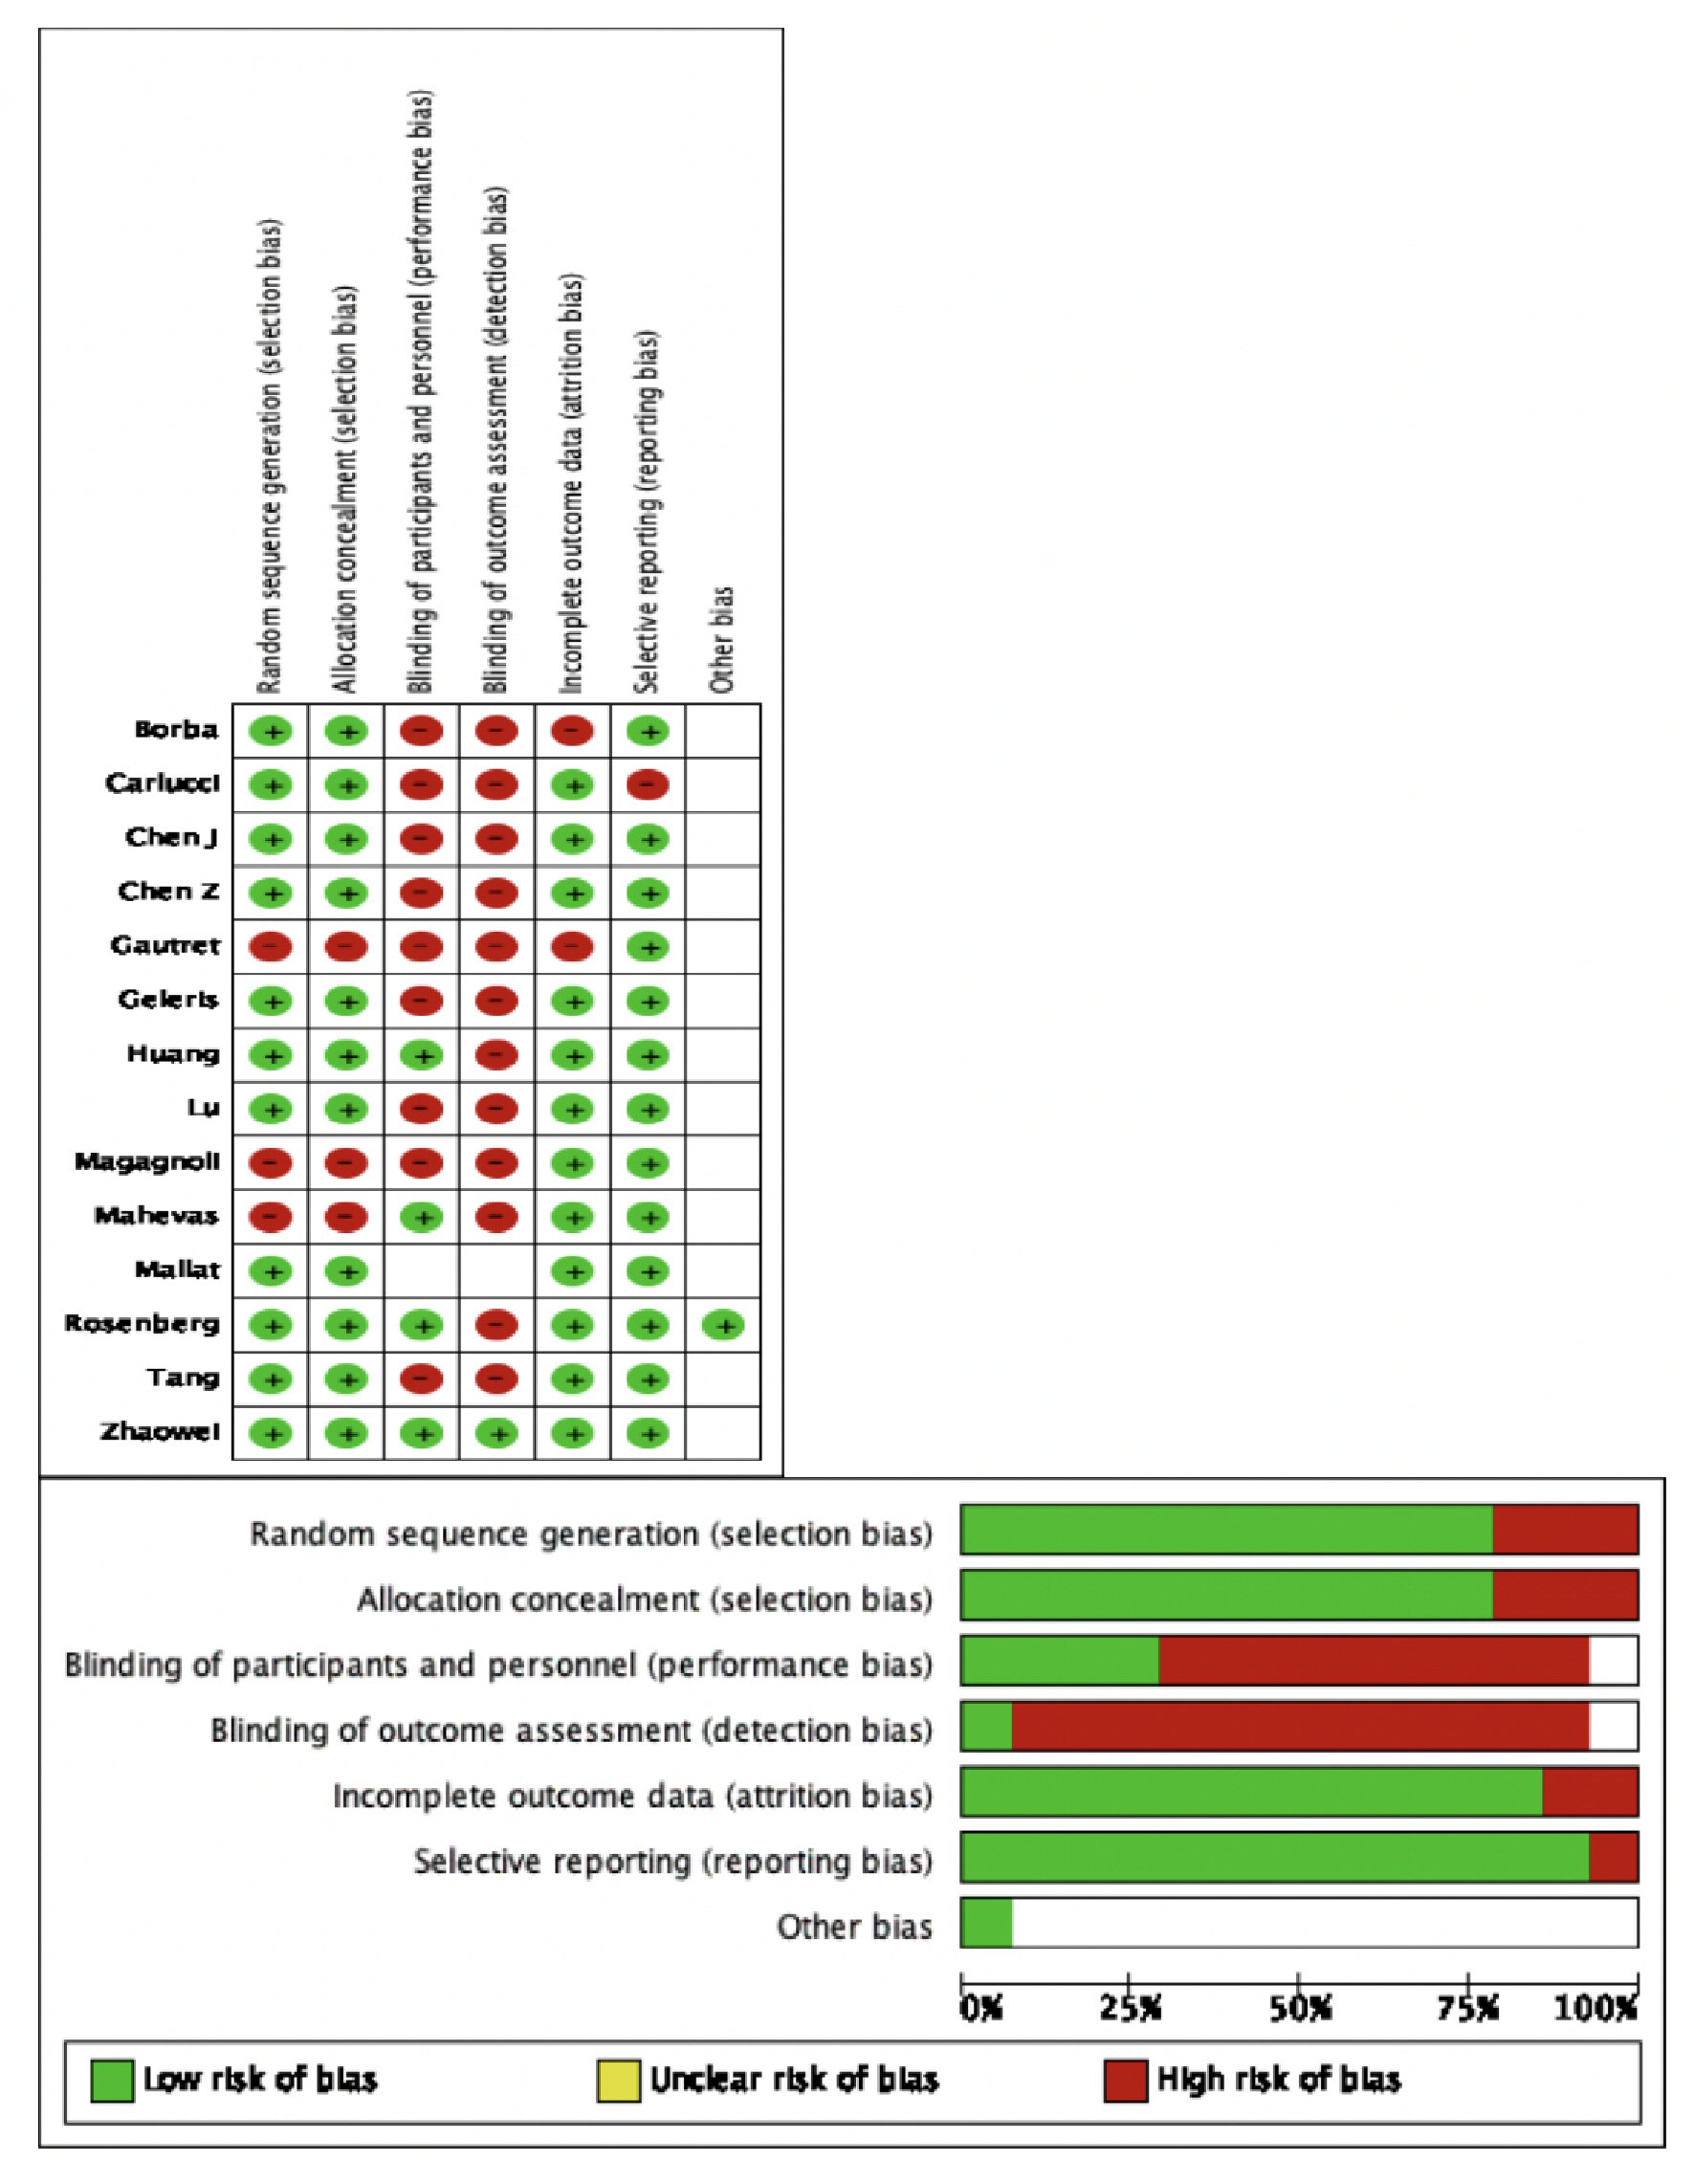
Figure 1. Methodological quality assessment of the included studies.
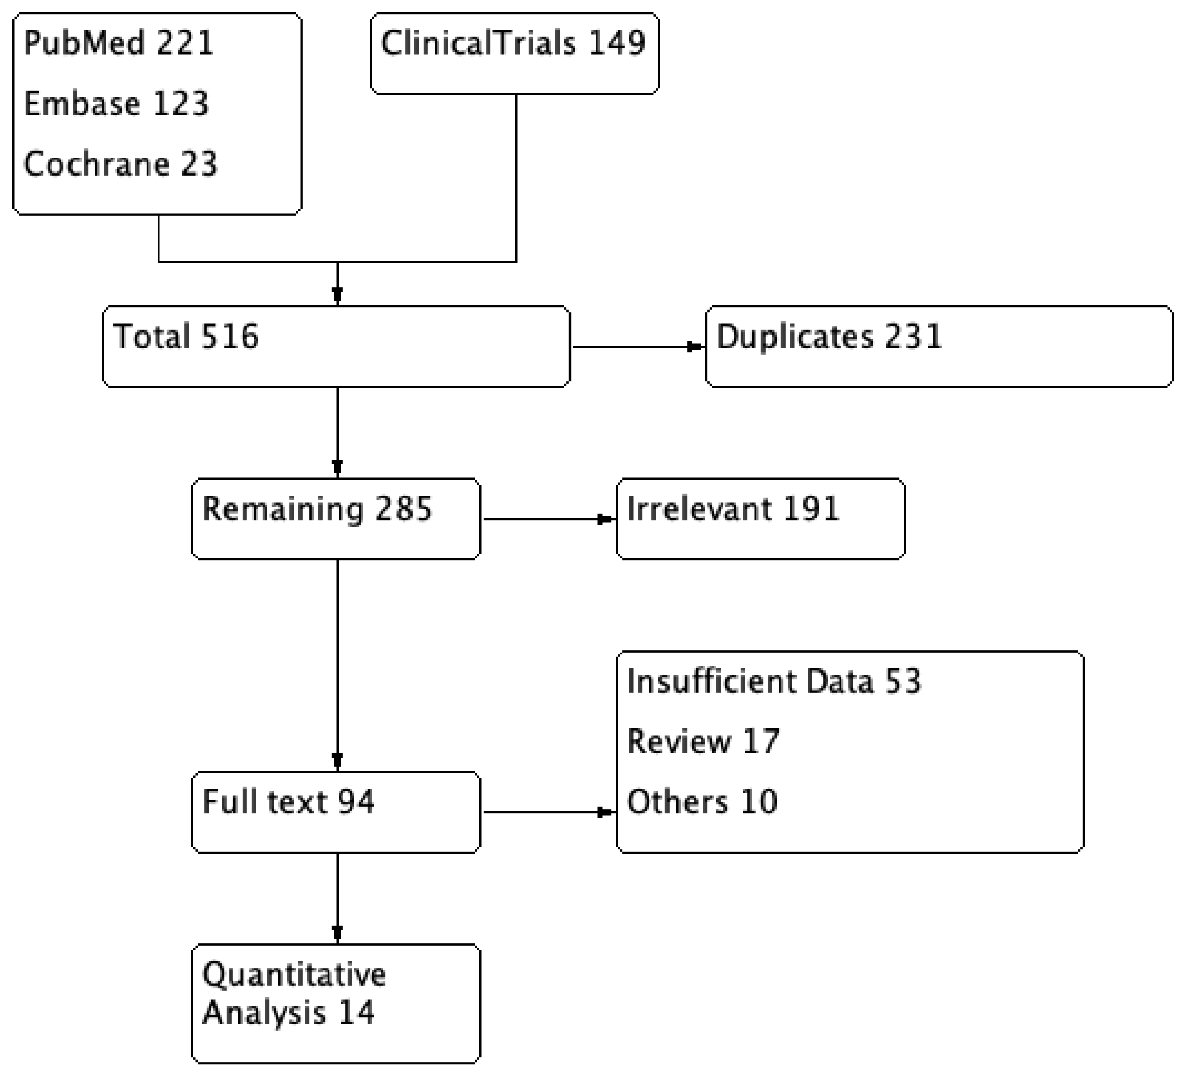
Figure 2. PRISMA flow diagram of the included studies in systematic review and meta-analysis. PRISMA: Preferred Reporting Items for Systematic Reviews and Meta-Analyses.
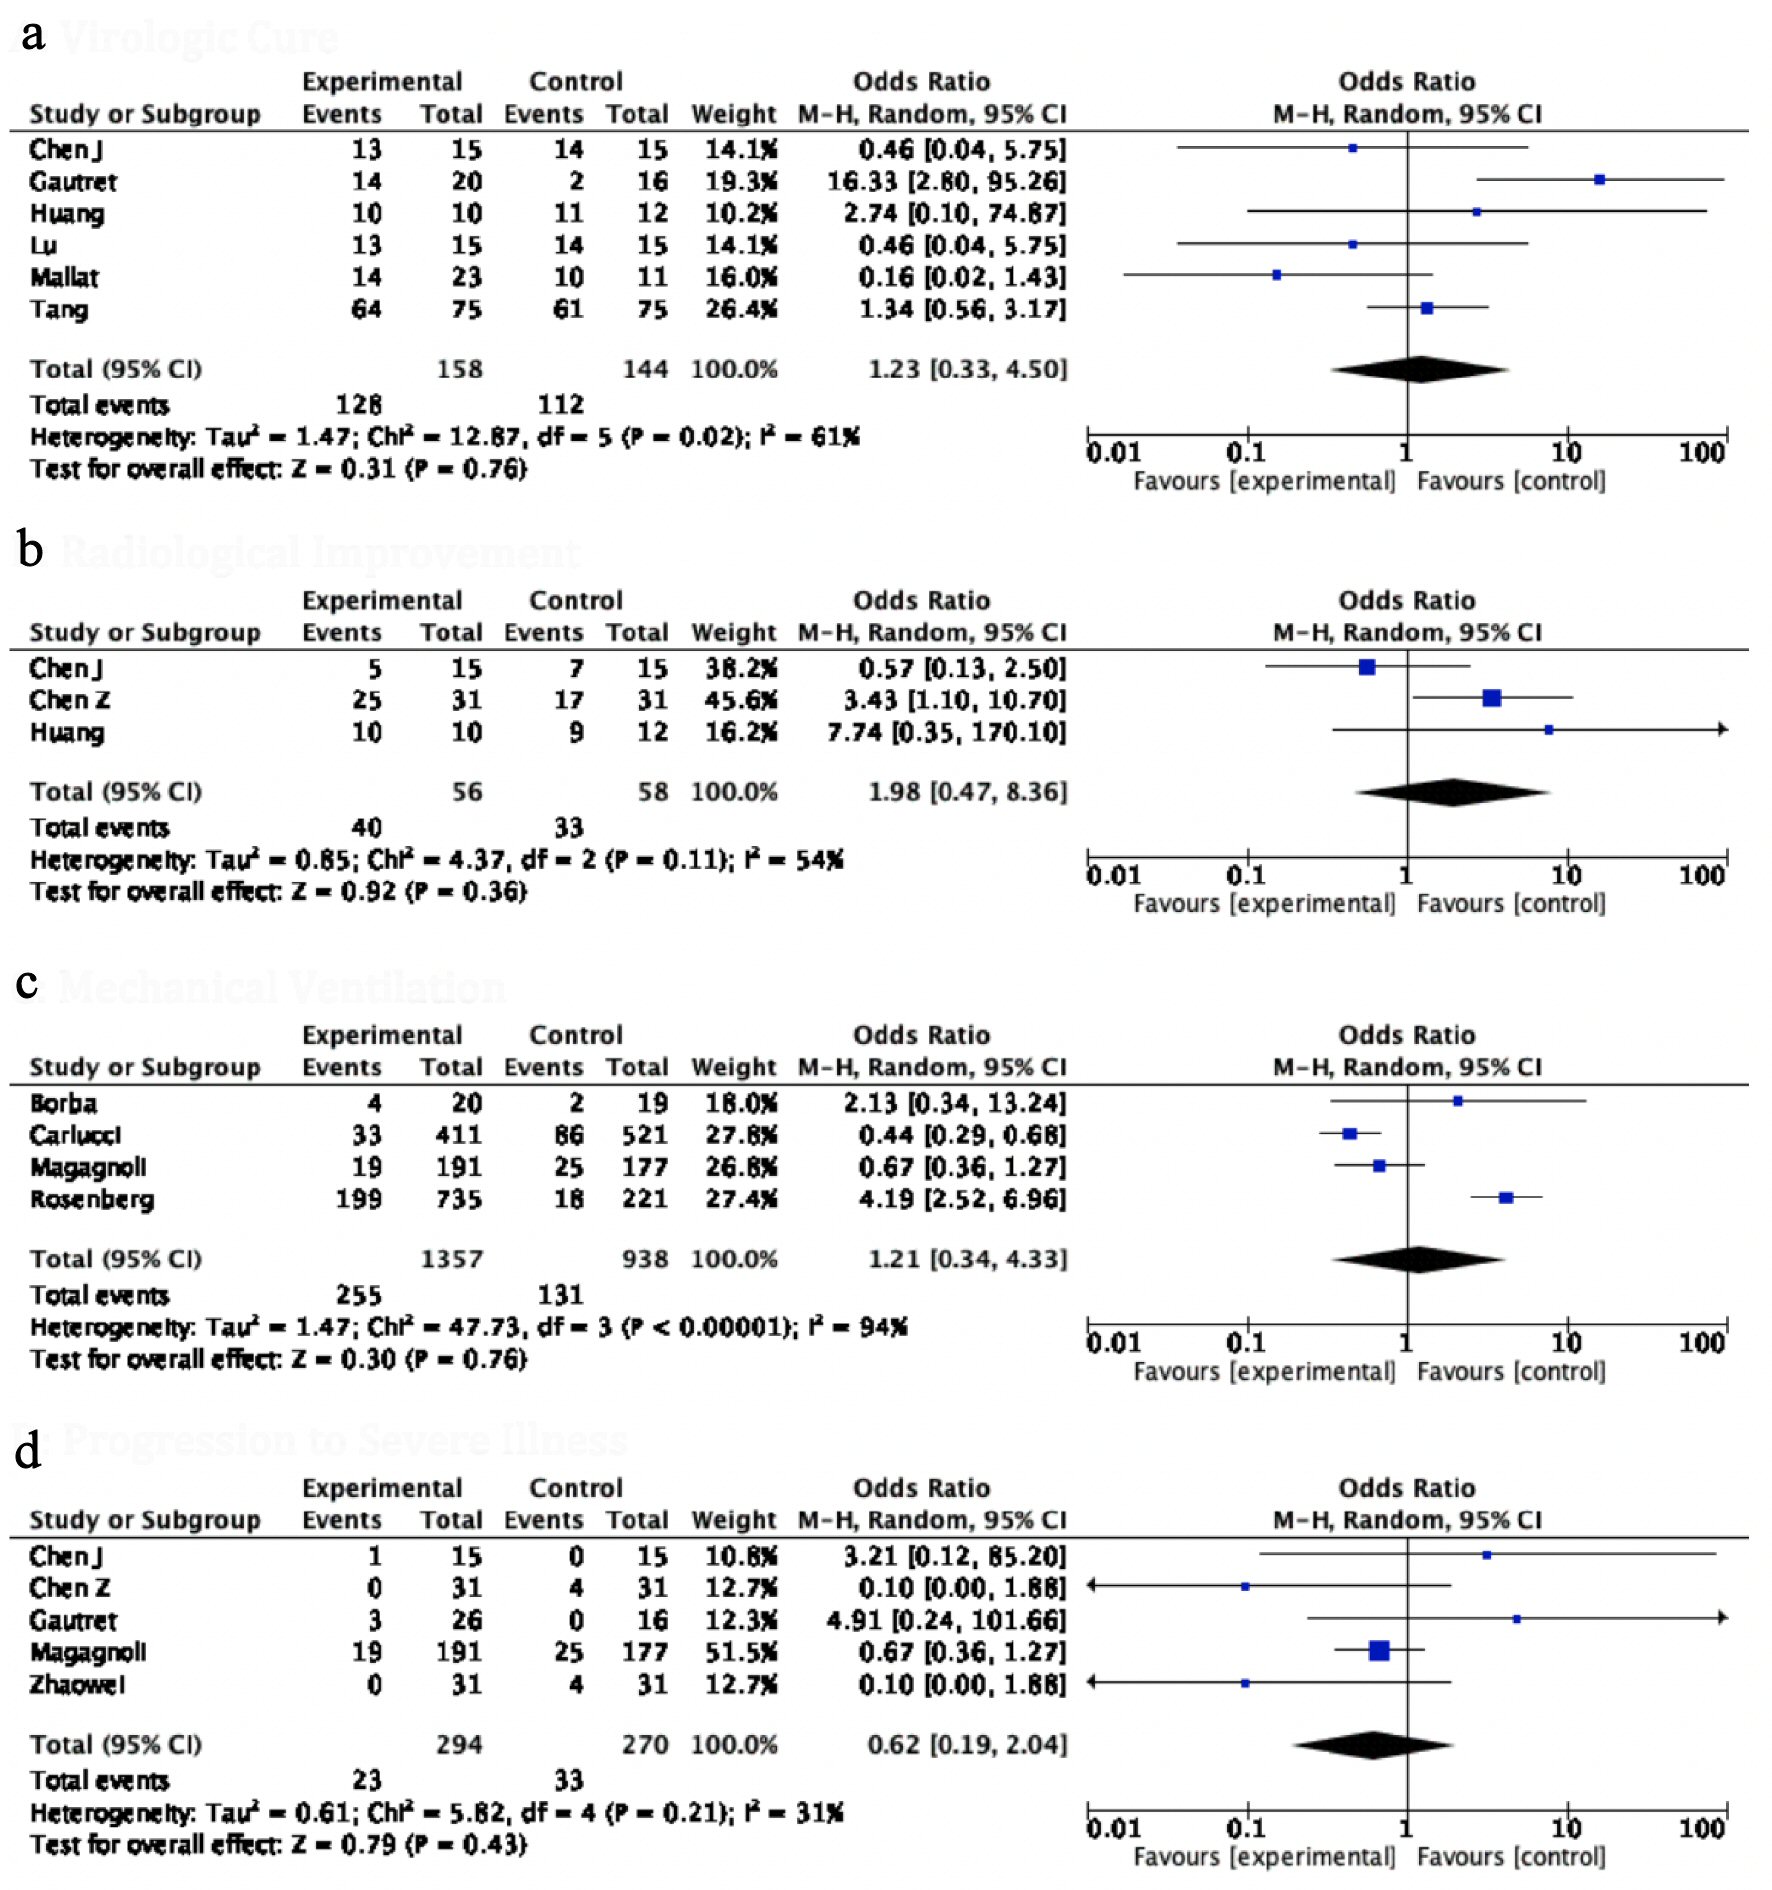
Figure 3. Forest plot for (a) virological cure, (b) radiological improvement, (c) ventilator required, and (d) progression to severe illness showing an individual and pooled OR for studies comparing HCQ-treated patients with control. OR: odds ratio; HCQ: hydroxychloroquine.
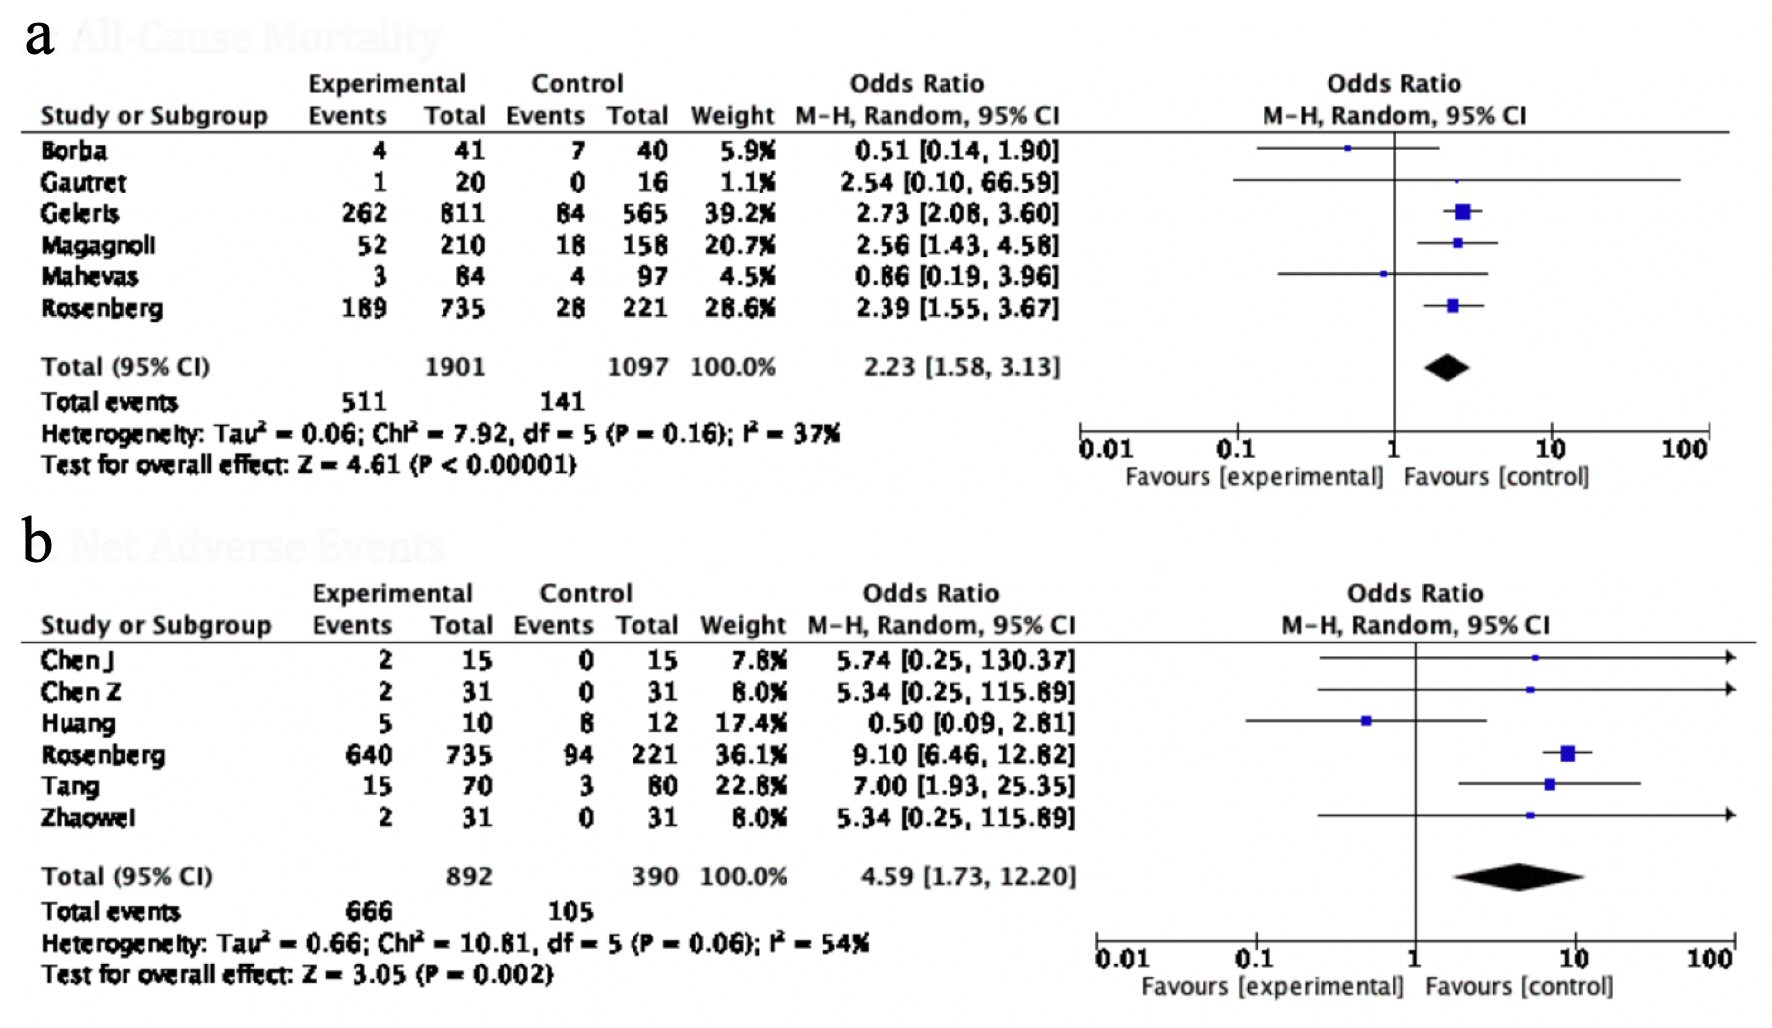
Figure 4. Forest plot for (a) all-cause mortality, and (b) NAE, showing an individual and pooled OR for studies comparing HCQ-treated patients with control. NAE: net adverse event; OR: odds ratio; HCQ: hydroxychloroquine.
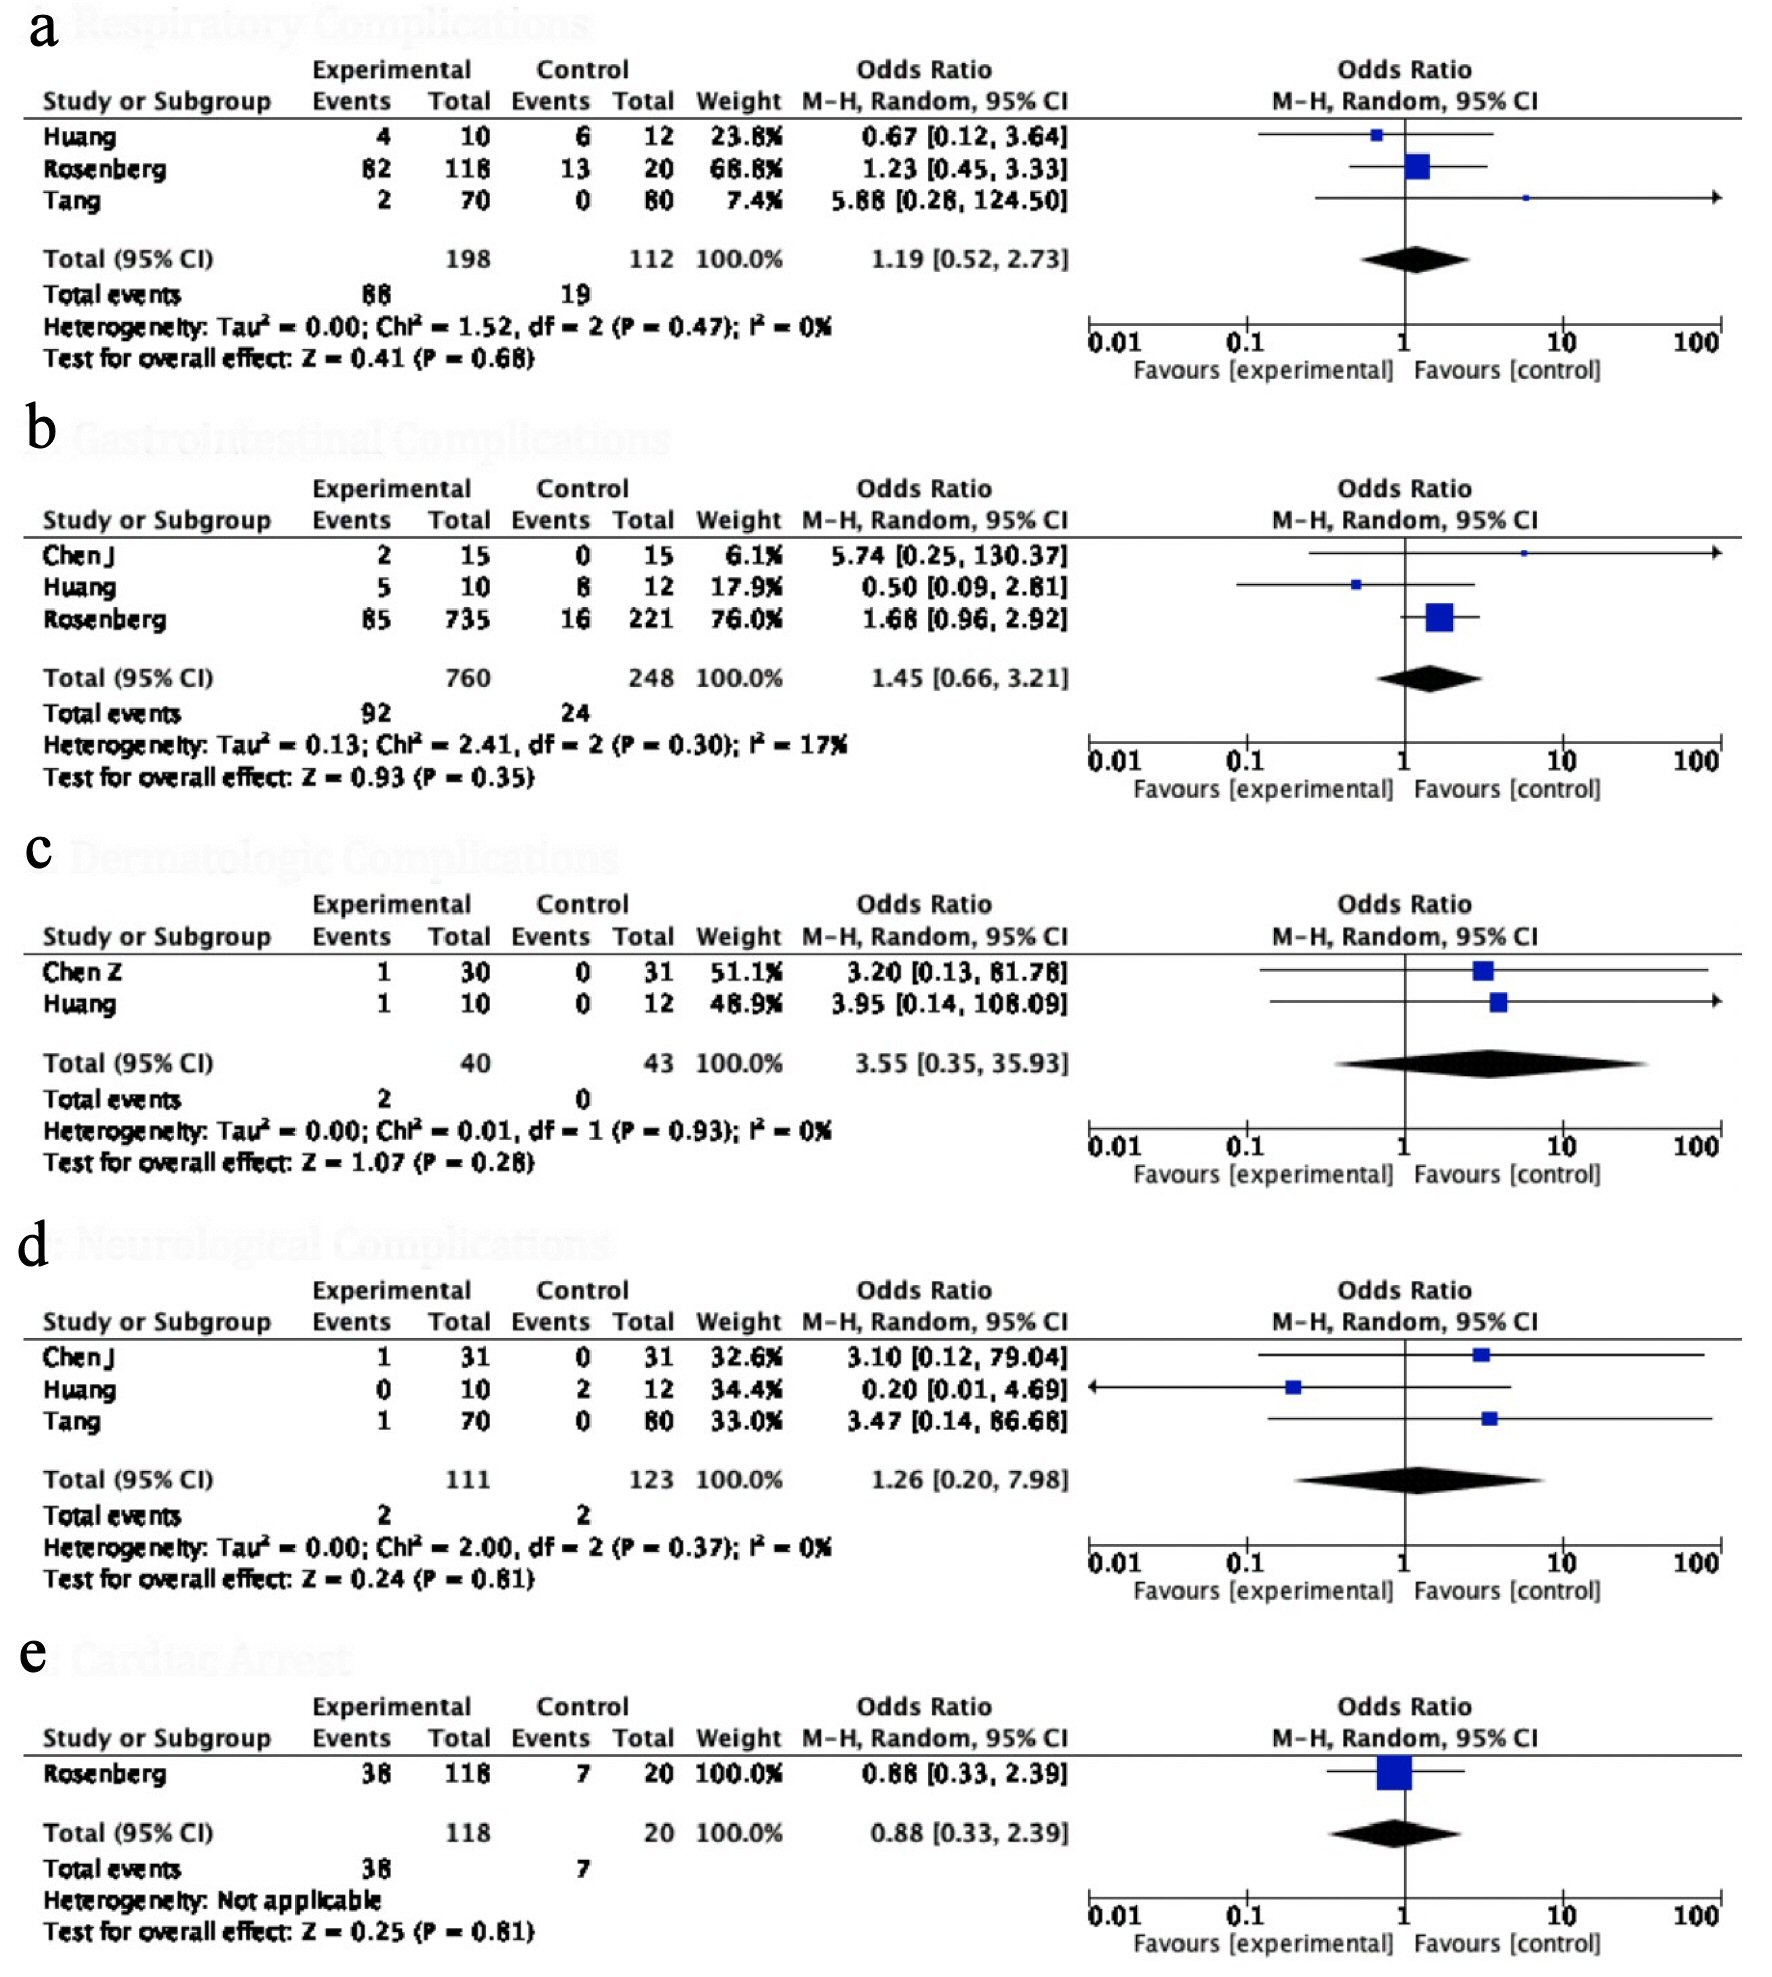
Figure 5. Forest plot for (a) respiratory complications, (b) gastrointestinal complications, (c) dermatological side effects, (d) neurological complications and (e) cardiac arrest showing an individual and pooled OR for all studies comparing HCQ treated patients with control. OR: odds ratio; HCQ: hydroxychloroquine.
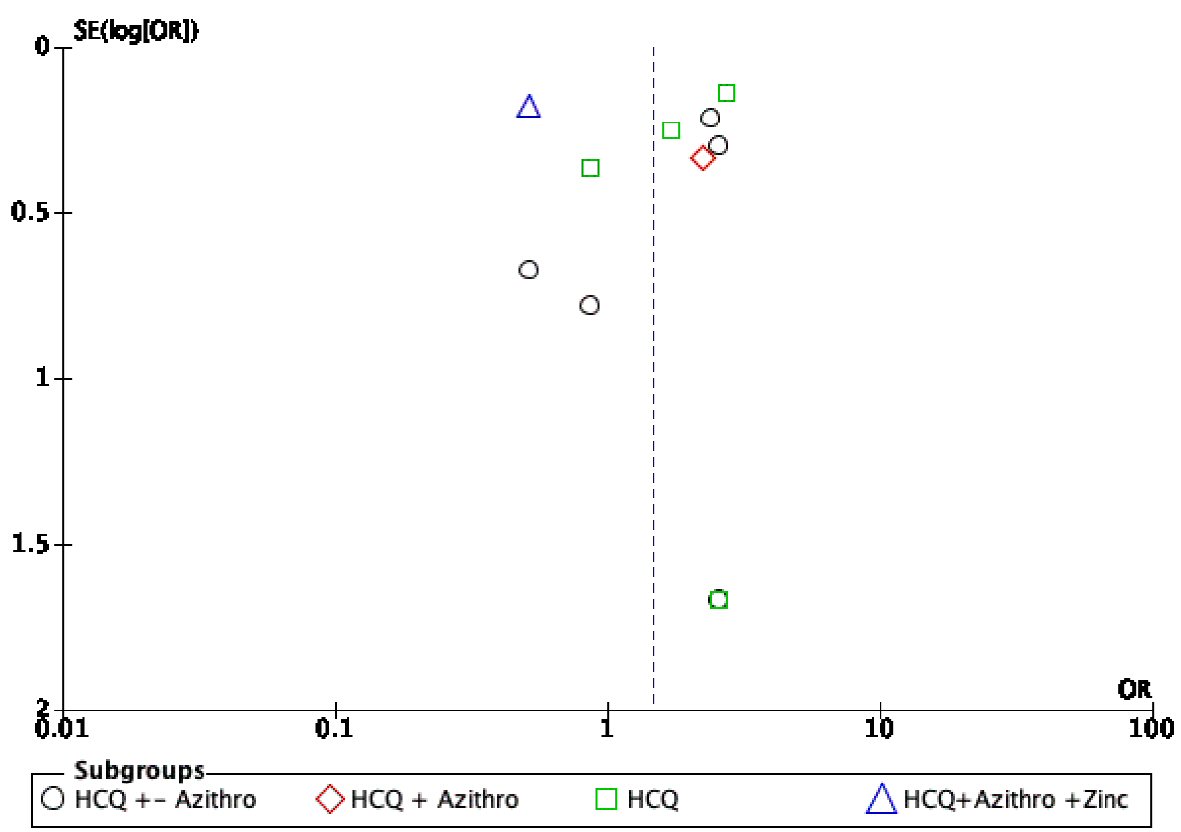
Figure 6. Funnel plot showing possible publication bias across all studies and subgroups.


