Journal of Clinical Medicine Research, ISSN 1918-3003 print, 1918-3011 online, Open Access
Article copyright, the authors; Journal compilation copyright, J Clin Med Res and Elmer Press Inc
Journal website https://www.jocmr.org

Original Article

Volume 13, Number 2, February 2021, pages 101-106


Evaluation of Gut Microbiota in Patients With Vulvovestibular Syndrome

Figures

Figure 1.
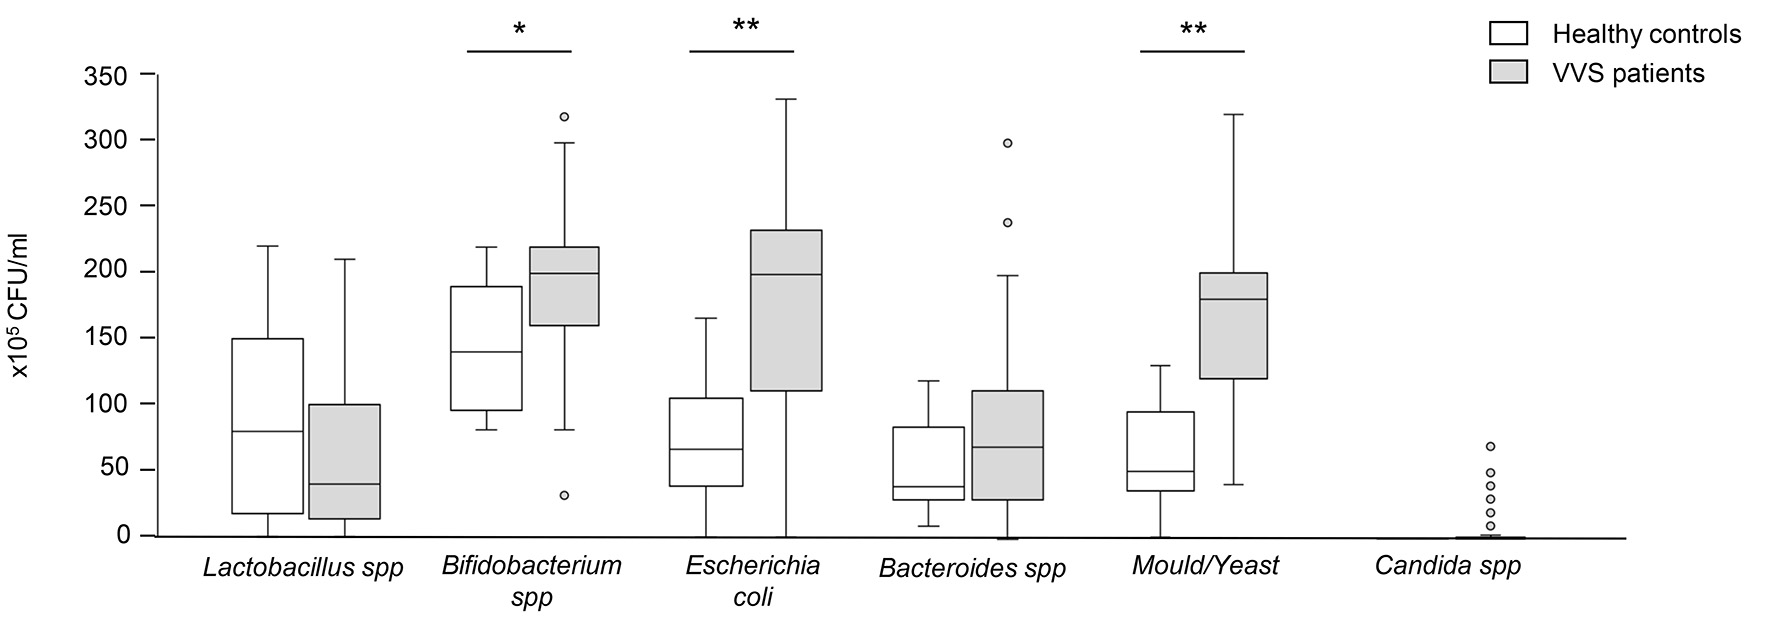
Figure 1. Evaluation of gut flora in healthy controls and VVS patients. The results are expressed in colony-forming units per milliliter (CFU/mL) of stool. Data are expressed as median and IQR, and were analyzed by the non-parametric Mann-Whitney U test. Asterisks indicate a significant difference between the two groups (*P < 0.05; **P < 0.0001). VVS: vulvovestibular syndrome; IQR: interquartile range.
Figure 2.
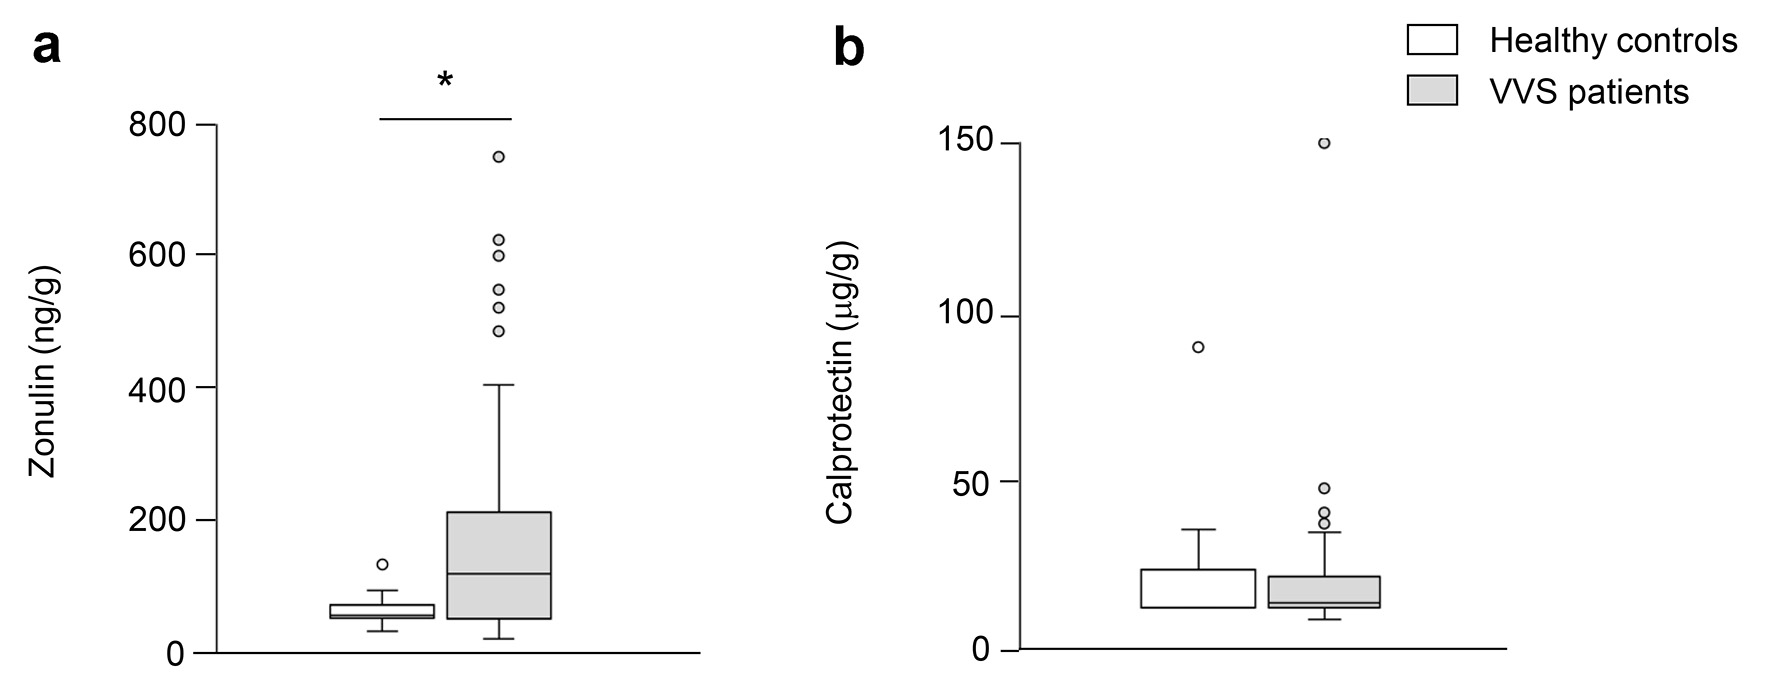
Figure 2. Evaluation of zonulin and calprotectin in healthy controls and VVS patients. Concentration of zonulin (a) and calprotectin (b) in fecal samples of healthy controls and VVS patients. Data are expressed as median and IQR, and were analyzed by the non-parametric Mann-Whitney U test. Asterisk indicates a significant difference between the two groups (P < 0.05). VVS: vulvovestibular syndrome; IQR: interquartile range.

Tables

Table 1. Characteristics of VVS Patients
 
ControlsVVS patients
Data are expressed as mean ± standard deviation. Pain severity was scored from 0 to 10. VVS: vulvovestibular syndrome; BMI: body mass index; IBS: irritable bowel syndrome; PBS: bladder pain syndrome.
No. of subjects1374
Age (years)38.3 ± 10.434.3 ± 10.9
Pain severity06.5 ± 2.7
Burning06.4 ± 2.7
Dryness05.6 ± 3.3
Hypertonicity02.0 ± 2.5
Lesions02.7 ± 2.5
BMI (kg/m2)23.0 ± 2.123.2 ± 2.0
Smokers316
Drinker422
No. of pregnancy0.9 ± 1.01.1 ± 1.1
IBS (No.)074
Anxiety (No.)130
PBS (No.)019


Table 2. Evaluation of Gut Flora in Healthy Patients (Controls) and VVS Patients
 
Genus/species (× 105 CFU/mL)ControlsVVS patientsP value
Data are expressed as mean ± standard deviation. VVS: vulvovestibular syndrome; CFU: colony-forming units.
Lactobacillus spp.85.8 ± 76.859.5 ± 56.80.288
Bifidocaterium spp.144.6 ± 50.3193 ± 62< 0.05
Escherichia coli65.2 ± 40.7169.2 ± 74.7< 0.0001
Bacteroides spp.54.6 ± 31.581 ± 630.237
Mould/yeast64.2 ± 38.4172.4 ± 61.7< 0.0001
Candida spp.0 ± 04.5 ± 13.10.052