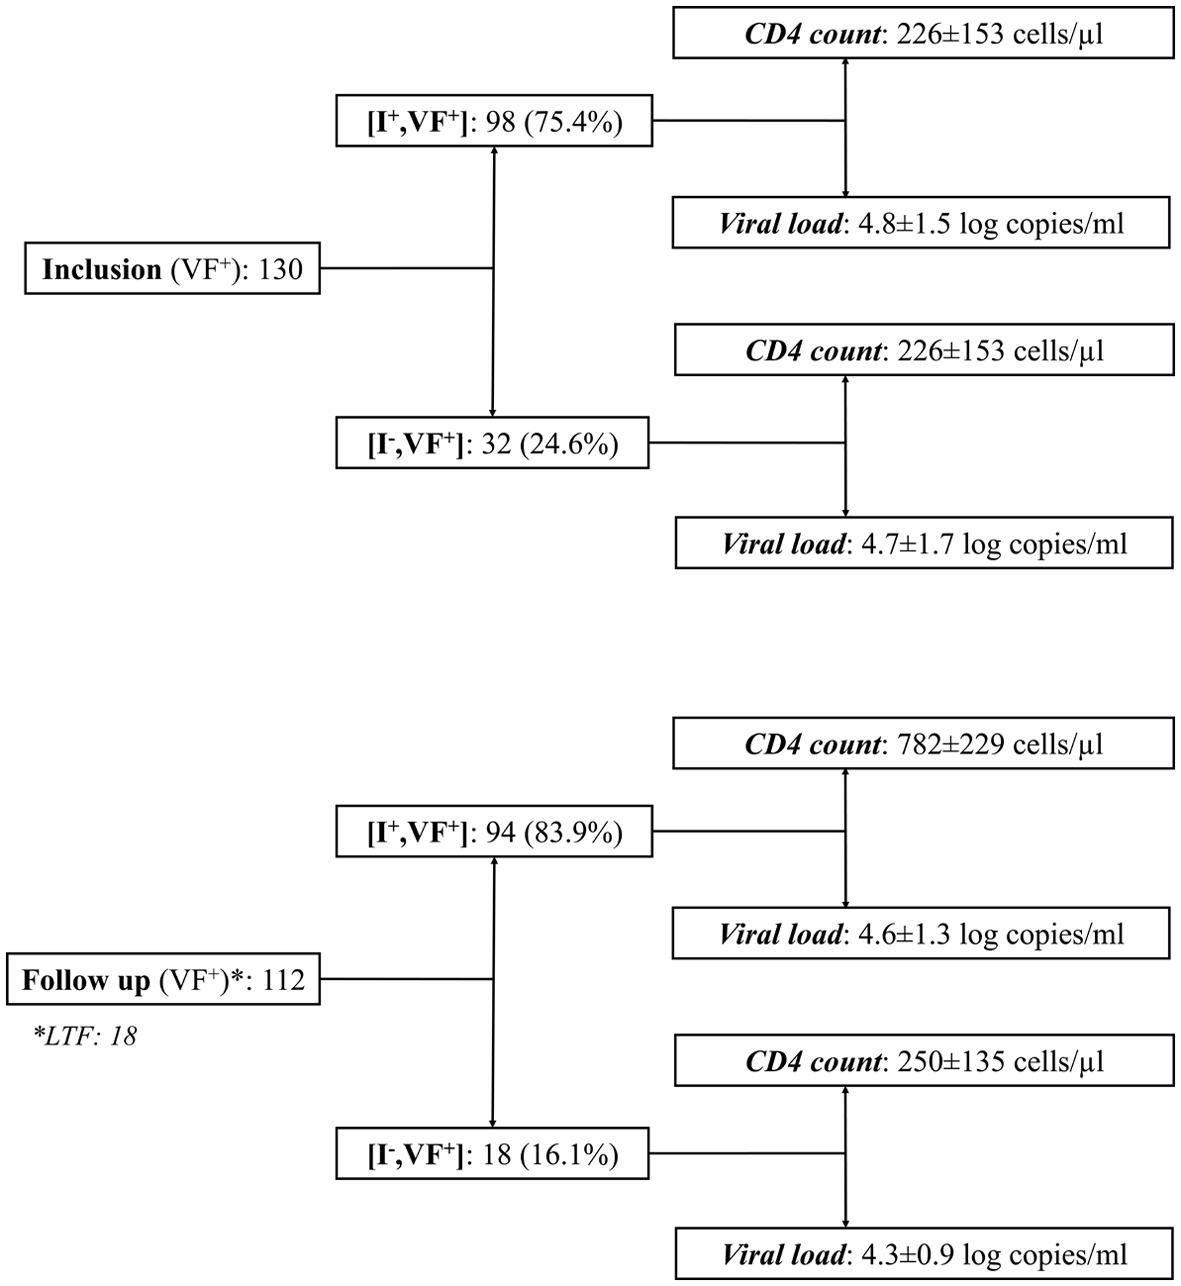
Figure 1. Distribution of study children in virological failure (VF+) at inclusion and after the follow-up period, according to their immunological (CD4 T cell count) and virological (circulating viral load) responses to antiretroviral treatment. Results are expressed as mean ± standard deviation. I+: immunological responders; I-: immunological nonresponders; LTF: lost-to-follow up; CD4: cluster of differentiation 4.
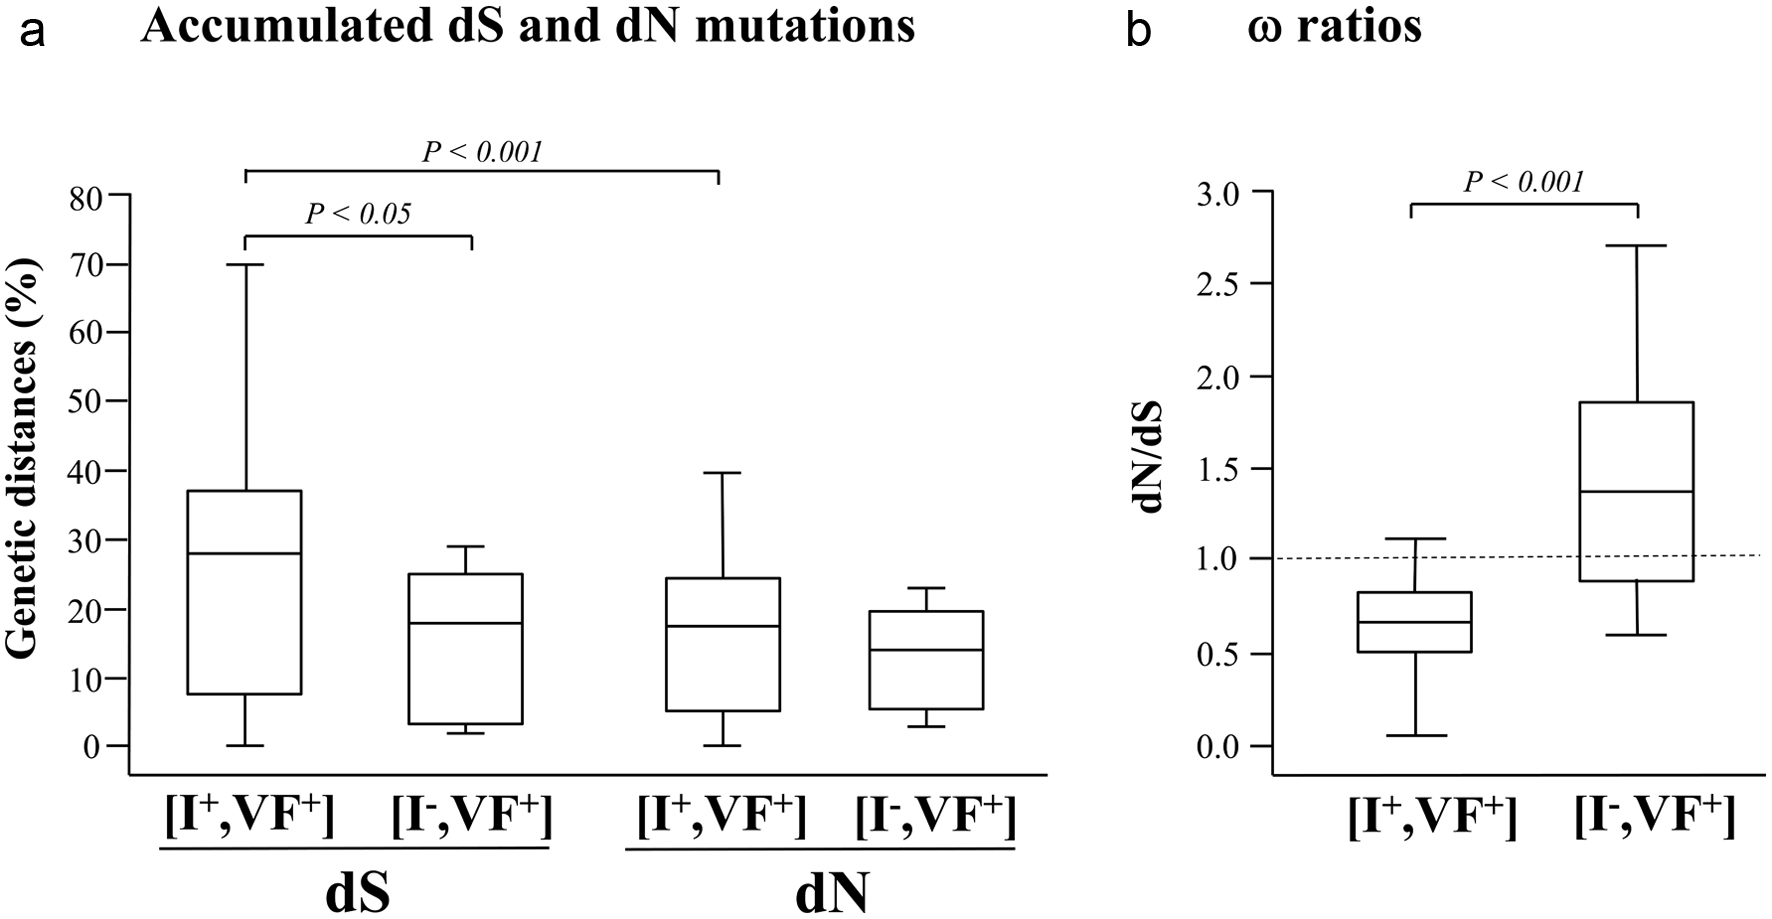
Figure 2. Estimates of codon-based evolutionary divergences between pairs of HIV-1 pol gene nucleotide sequences during a 39 months period of prospective follow-up of children and adolescents attending the Complexe Pediatrique of Bangui, Central African Republic. The genetic distances (expressed in percentage) of synonymous substitutions per 100 potential synonymous sites (dS) and of nonsynonymous substitutions per 100 potential nonsynonymous site (dN) accumulated during the follow-up period in circulating HIV-1 pol gene (a), as well as the (dN/dS) ω ratios (b) are shown for both (I+, VF+) and (I-, VF+) subgroups. For each distribution, the blank box represents the interquartile ranges, the horizontal bar corresponds to the median and the vertical bars and hats indicate the 10th and 90th percentiles. The dotted line identifies the neutral selection ratio (ω = 1). Comparisons used Wilcoxon’s test for paired data and Welch’s t-test between subgroups. P values are given above indentations.