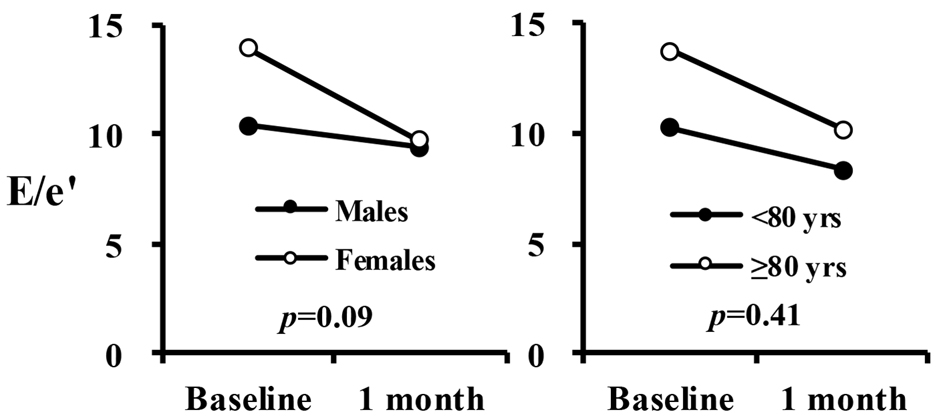
Figure 1. Interaction plot in E/e′ between time, gender and age.
| Journal of Clinical Medicine Research, ISSN 1918-3003 print, 1918-3011 online, Open Access |
| Article copyright, the authors; Journal compilation copyright, J Clin Med Res and Elmer Press Inc |
| Journal website http://www.jocmr.org |
Original Article
Volume 12, Number 3, March 2020, pages 165-171
Effects of Tofogliflozin on Cardiac Function in Elderly Patients With Diabetes Mellitus
Figure
Tables
| Variables | Number of patients |
|---|---|
| DDP-4: dipeptidyl peptidase-4; BG: biguanides; SU: sulphonylureas; ARB: angiotensin receptor blocker; CCB: calcium channel blocker. | |
| Gender (N, male/female) | 18/24 |
| Age (years) | 83.0 ± 7.6 |
| NYHA I/II (III, IV: none) | 33/9 |
| Co-administered drug | |
| DPP-4 | 33 |
| BG | 12 |
| SU | 10 |
| Insulin | 2 |
| ARB | 10 |
| β-blocker | 5 |
| CCB | 22 |
| Diuretics | 14 |
| Variables | Baseline | 1 month | P-value* |
|---|---|---|---|
| *Paired t-test. HbA1c: glycated hemoglobin; BNP: brain natriuretic peptide; eGFR: estimated glomerular filtration rate; BUN: blood urea nitrogen. | |||
| HbA1c (%) | 7.3 ± 1.1 | 7.1 ± 0.9 | 0.06 |
| Body weight (kg) | 55.1 ± 12.2 | 52.7 ± 11.6 | < 0.01 |
| Systolic blood pressure (mm Hg) | 137.4 ± 27.0 | 124.1 ± 18.8 | < 0.01 |
| Diastolic blood pressure (mm Hg) | 74.5 ± 13.5 | 69.3 ± 11.4 | < 0.01 |
| Hematocrit | 37.9 ± 6.9 | 38.4 ± 5.9 | 0.3 |
| BNP (pg/mL) | 321.5 ± 805.7 | 191.0 ± 371.0 | 0.08 |
| eGFR | 63.1 ± 23.2 | 60.9 ± 30.5 | 0.4 |
| BUN (mg/dL) | 19.1 ± 8.6 | 18.5 ± 7.7 | 0.6 |
| Na+ (mEq/L) | 139.1 ± 4.0 | 139.2 ± 3.5 | 0.9 |
| K+ (mEq/L) | 4.2 ± 0.7 | 4.1 ± 0.6 | 0.4 |
| Cl- (mEq/L) | 103.7 ± 4.1 | 103.8 ± 5.5 | 0.9 |
| Blood osmotic pressure (mOsm/L) | 293.0 ± 9.3 | 291.7 ± 7.5 | 0.3 |
| Renin (ng/mL) | 3.5 ± 5.2 | 7.0 ± 9.2 | < 0.01 |
| Aldosterone (pg/mL) | 89.3 ± 48.6 | 104.4 ± 59.7 | < 0.05 |
| Variables | Baseline | 1 month | P-value |
|---|---|---|---|
| *Paired t-test. EF: ejection fraction; E/A: early filling/atrial filling; E/e': change in inflow E and mitral e' annular velocities; LAD: left atrial dimension; IVCmax: maximal diameter of inferior vena cava. | |||
| EF | 63.6 ± 10.9 | 62.9 ± 11.0 | 0.1 |
| E/A | 0.7 ± 0.3 | 0.6 ± 0.2 | < 0.05 |
| E/e' | 12.6 ± 5.0 | 9.6 ± 3.2 | < 0.01 |
| LAD (mm) | 39.7 ± 7.4 | 36.8 ± 7.3 | < 0.01 |
| IVCmax (mm) | 13.7 ± 4.5 | 13.6 ± 4.2 | 0.6 |
| SOV | df | Sum sq. | Mean sq. | F | Prob > F | Significance |
|---|---|---|---|---|---|---|
| Analysis of variance table for the mixed effects model. SOV: source of variance; Sum sq.: sum of squares; df: degree of freedom; Mean sq.: mean squares; F: F statistic; Prob: probability. *P < 0.05; **P < 0.01. | ||||||
| Time | 1 | 76.6 | 76.6 | 8.0 | 0.01 | * |
| Subject | 23 | 574.2 | 25.0 | 2.6 | 0.01 | * |
| Gender | 1 | 43.5 | 43.5 | 1.7 | 0.2 | |
| Time × gender | 1 | 30.3 | 30.3 | 3.2 | 0.09 | |
| Error | 23 | 221.2 | 9.6 | |||
| Total | 49 | 984.1 | 20.1 | |||
| Time | 1 | 81.2 | 81.2 | 7.7 | 0.01 | * |
| Subject | 23 | 539.9 | 23.5 | 2.2 | 0.03 | * |
| Age (< 80 years) | 1 | 77.9 | 77.9 | 3.3 | 0.08 | |
| Time × age | 1 | 7.5 | 7.5 | 0.7 | 0.4 | |
| Error | 23 | 243.9 | 10.6 | |||
| Total | 49 | 984.1 | 20.1 | |||