Journal of Clinical Medicine Research, ISSN 1918-3003 print, 1918-3011 online, Open Access
Article copyright, the authors; Journal compilation copyright, J Clin Med Res and Elmer Press Inc
Journal website http://www.jocmr.org

Original Article

Volume 12, Number 3, March 2020, pages 184-189


Copy Number Variation of the Salivary Amylase Gene and Glucose Metabolism in Healthy Young Japanese Women

Figures

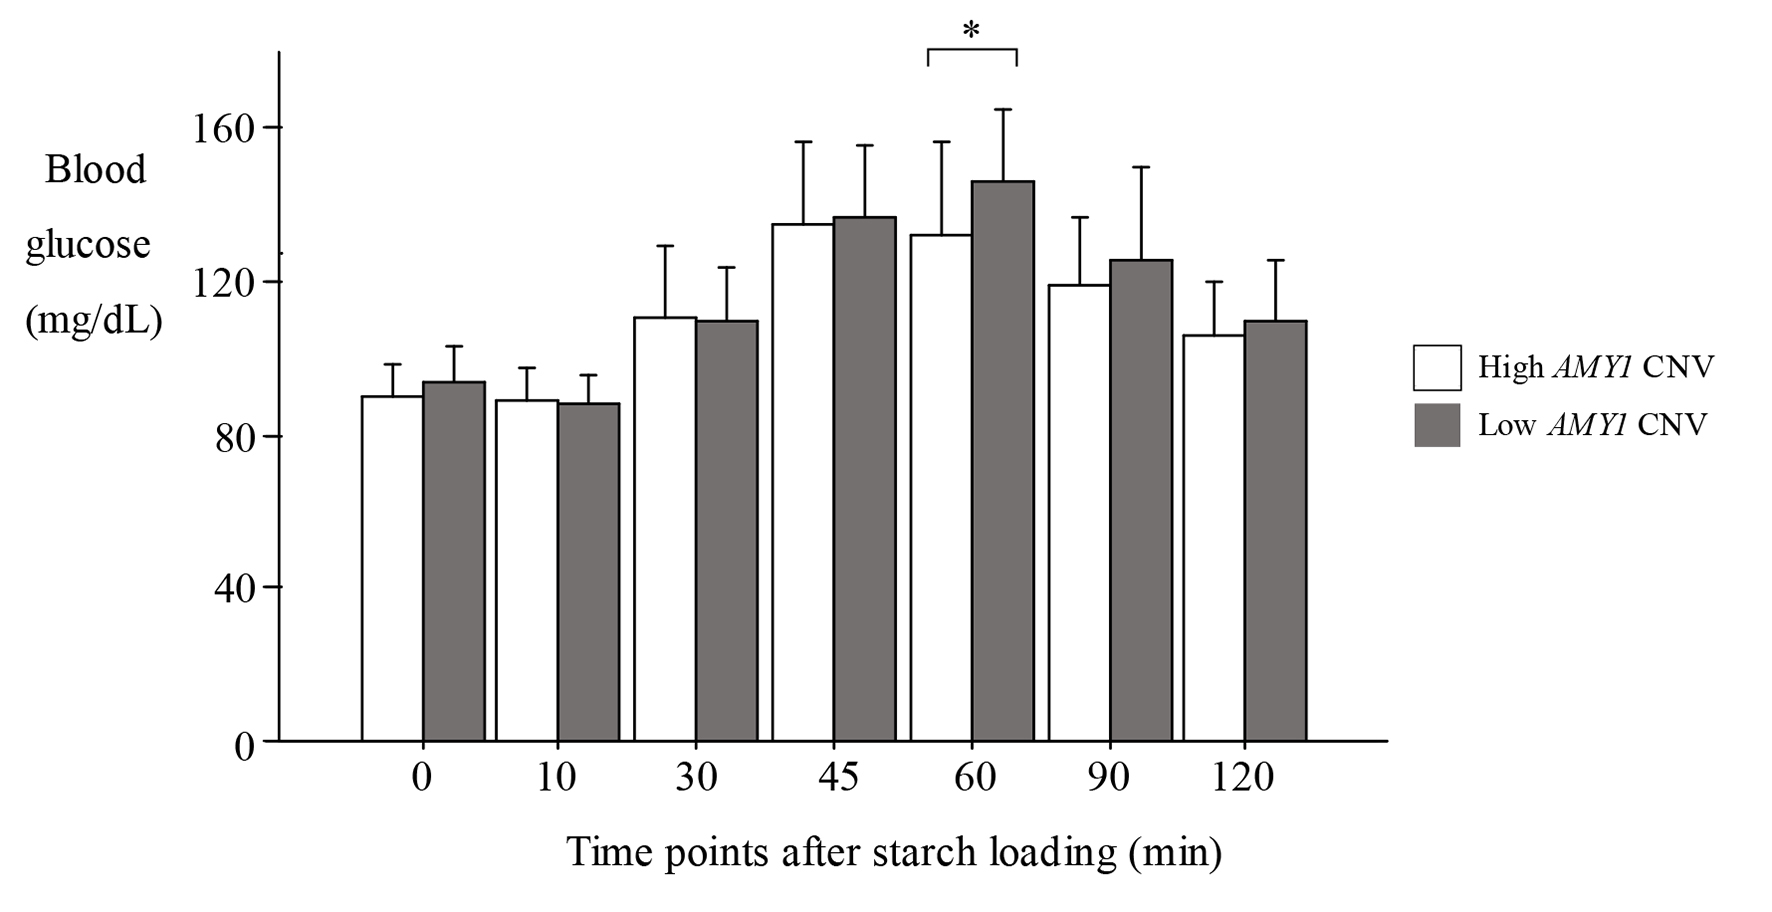
Figure 1.
Figure 1. Levels of blood glucose after starch loading. Data are expressed as the mean ± SD. *P < 0.05, t-test, high vs. low AMY1 CNV. High AMY1 CNV: 8 - 14; low AMY1 CNV: 4 - 7. SD: standard deviation; CNV: copy number variation; AMY1: salivary amylase gene.
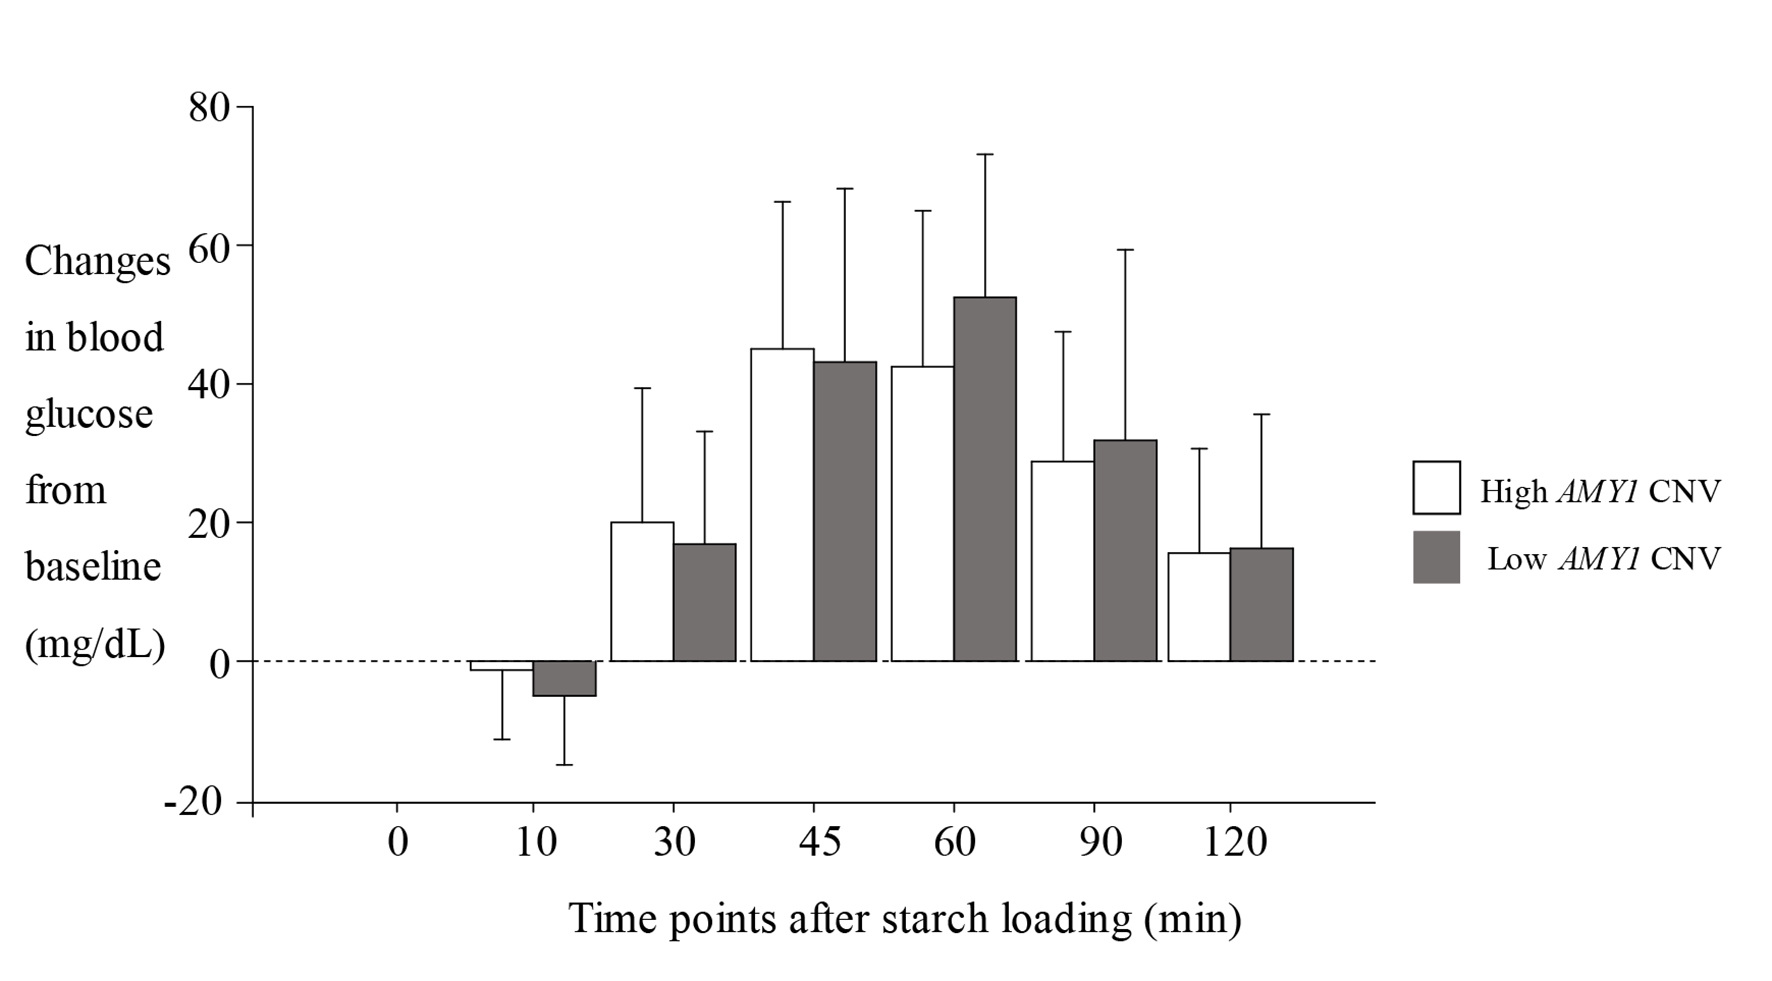
Figure 2.
Figure 2. Changes of blood glucose from baseline after starch loading. Data are expressed as the mean ± SD. High AMY1 CNV: 8 - 14; low AMY1 CNV: 4 - 7. SD: standard deviation; CNV: copy number variation; AMY1: salivary amylase gene.

Tables

Table 1. Characteristics of the Study Participants
 
CharacteristicsMeans ± SD or median (IQ)
*Divided by the protein concentration in each saliva sample. SD: standard deviation; BMI: body mass index; HDL-C: high-density lipoprotein cholesterol; HbA1c: glycated hemoglobin; AMY1: salivary amylase gene; CNV: copy number variation; IQ: interquartile range; TG: triglycerides; FPG: fasting plasma glucose.
Age (years)23.0 ± 4.2
BMI, kg/m2 (range)20.1 ± 1.6 (17.5 - 24.3)
TG, mg/dL (IQ)52 (38 - 68)
HDL-C, mg/dL73 ± 15.7
HbA1c, % (range)5.25 ± 0.19 (4.9-5.6%)
mmol/mol (range)33 (30 - 37)
Total ketone bodies, µmol/L (IQ)39.5 (29 - 66)
3-Hydroxybutyric acid, µmol/L (IQ)24 (15.5 - 42)
Acetoacetic acid, µmol/L (IQ)17 (11.5 - 24)
Respiratory quotient0.77 ± 0.05
Energy consumption, kcal1737 ± 350
Carbohydrate energy, % in total energy52.8 ± 5.2
Alcohol consumption, kcal (IQ)14 (0.0 - 29.0)
AMY1 CNV (range)8.3 ± 2.3 (4 - 14)
Salivary amylase, (U/L) IQ*100 (62 - 148)
Total serum amylase (U/L)91 ± 27.9
Serum salivary amylase(U/L)61.3 ± 25.5
Serum pancreatic amylase (U/L)29.9 ± 10.4
Percentage of serum salivary amylase (range)66.0 ± 10.8 (40 - 86)


Table 2. Correlation Coefficients Between the Study Parameters
 
AMY1 CNVSalivary amylaseSerum amylaseRQ
TotalSalivaryPancreatic% Salivary
*P < 0.05; **P < 0.01; ***P < 0.001. AMY1: salivary amylase gene; CNV: copy number variation; RQ: respiratory quotient; BMI: body mass index; HDL-C: high-density lipoprotein cholesterol; HbA1c: glycated hemoglobin.
BMI-0.020.02-0.29*-0.22-0.180.010.09
HbA1c-0.36**-0.13-0.17-0.30*0.14-0.37**-0.12
Triglyceride-0.150.23-0.04-0.05-0.01-0.040.10
HDL-C-0.14-0.17-0.16-0.200.06-0.170.02
Uric acid0.29*0.09-0.09-0.06-0.070.05-0.15
Total ketone bodies0.14-0.04-0.14-0.10-0.150.1-0.44***
Acetoacetic acid0.11-0.01-0.16-0.13-0.120.06-0.36**
3-Hydroxybutyric acid0.17-0.06-0.09-0.05-0.150.14-0.45***
AMY1 CNV-------
Salivary amylase0.39**------
Serum amylase
  Total0.29*0.34**-----
  Salivary0.36**0.36**0.91***----
  Pancreatic-0.080.130.40**0.04---
  % Salivary0.37**0.240.36**0.68***-0.64***--
RQ-0.06-0.020.210.120.29*-0.13-
Blood glucose time course
  Baseline-0.14-0.12-0.11-0.180.15-0.220.08
  10 min-0.050.08-0.030.02-0.250.130.15
  30 min0.050.110.170.26*-0.180.38**0.11
  45 min-0.02-0.060.040.14-0.220.27*-0.07
  60 min-0.140.04-0.20-0.10-0.220.16-0.18
  120 min-0.07-0.02-0.08-0.070.003-0.04-0.09


Table 3. Odds Ratios of Low AMY1 CNV for High HbA1c
 
High AMY1 CNV (8 - 14) (N = 40)Low AMY1 CNV (4 - 7) (N = 20)
High HbA1c ≥ 5.4% (34 mmol/mol), n (%)10 (25)11 (55)
Odds ratios (95% CI)P values
Model 1: unadjusted. Model 2: adjusted for age and BMI. Model 3: model 2 plus adjustments for energy consumption (kcal) and serum total amylase. Model 4: model 2 plus adjustments for energy consumption (kcal) and salivary amylase for its concentration. AMY1: salivary amylase gene; CNV: copy number variation; CI: confidence interval; HbA1c: glycated hemoglobin; BMI: body mass index.
Model 11 (reference)3.67 (1.18 - 11.4)0.02
Model 21 (reference)4.32 (1.36 - 31.8)0.02
Model 31 (reference)6.31 (1.34 - 29.8)0.02
Model 41 (reference)8.31 (1.81 - 36.6)0.006