Journal of Clinical Medicine Research, ISSN 1918-3003 print, 1918-3011 online, Open Access
Article copyright, the authors; Journal compilation copyright, J Clin Med Res and Elmer Press Inc
Journal website http://www.jocmr.org

Short Communication

Volume 12, Number 2, February 2020, pages 122-126


Effect of the Dipeptidyl Peptidase-4 Inhibitor Sitagliptin on Muscle Mass and the Muscle/Fat Ratio in Patients With Type 2 Diabetes

Figure

Figure 1.
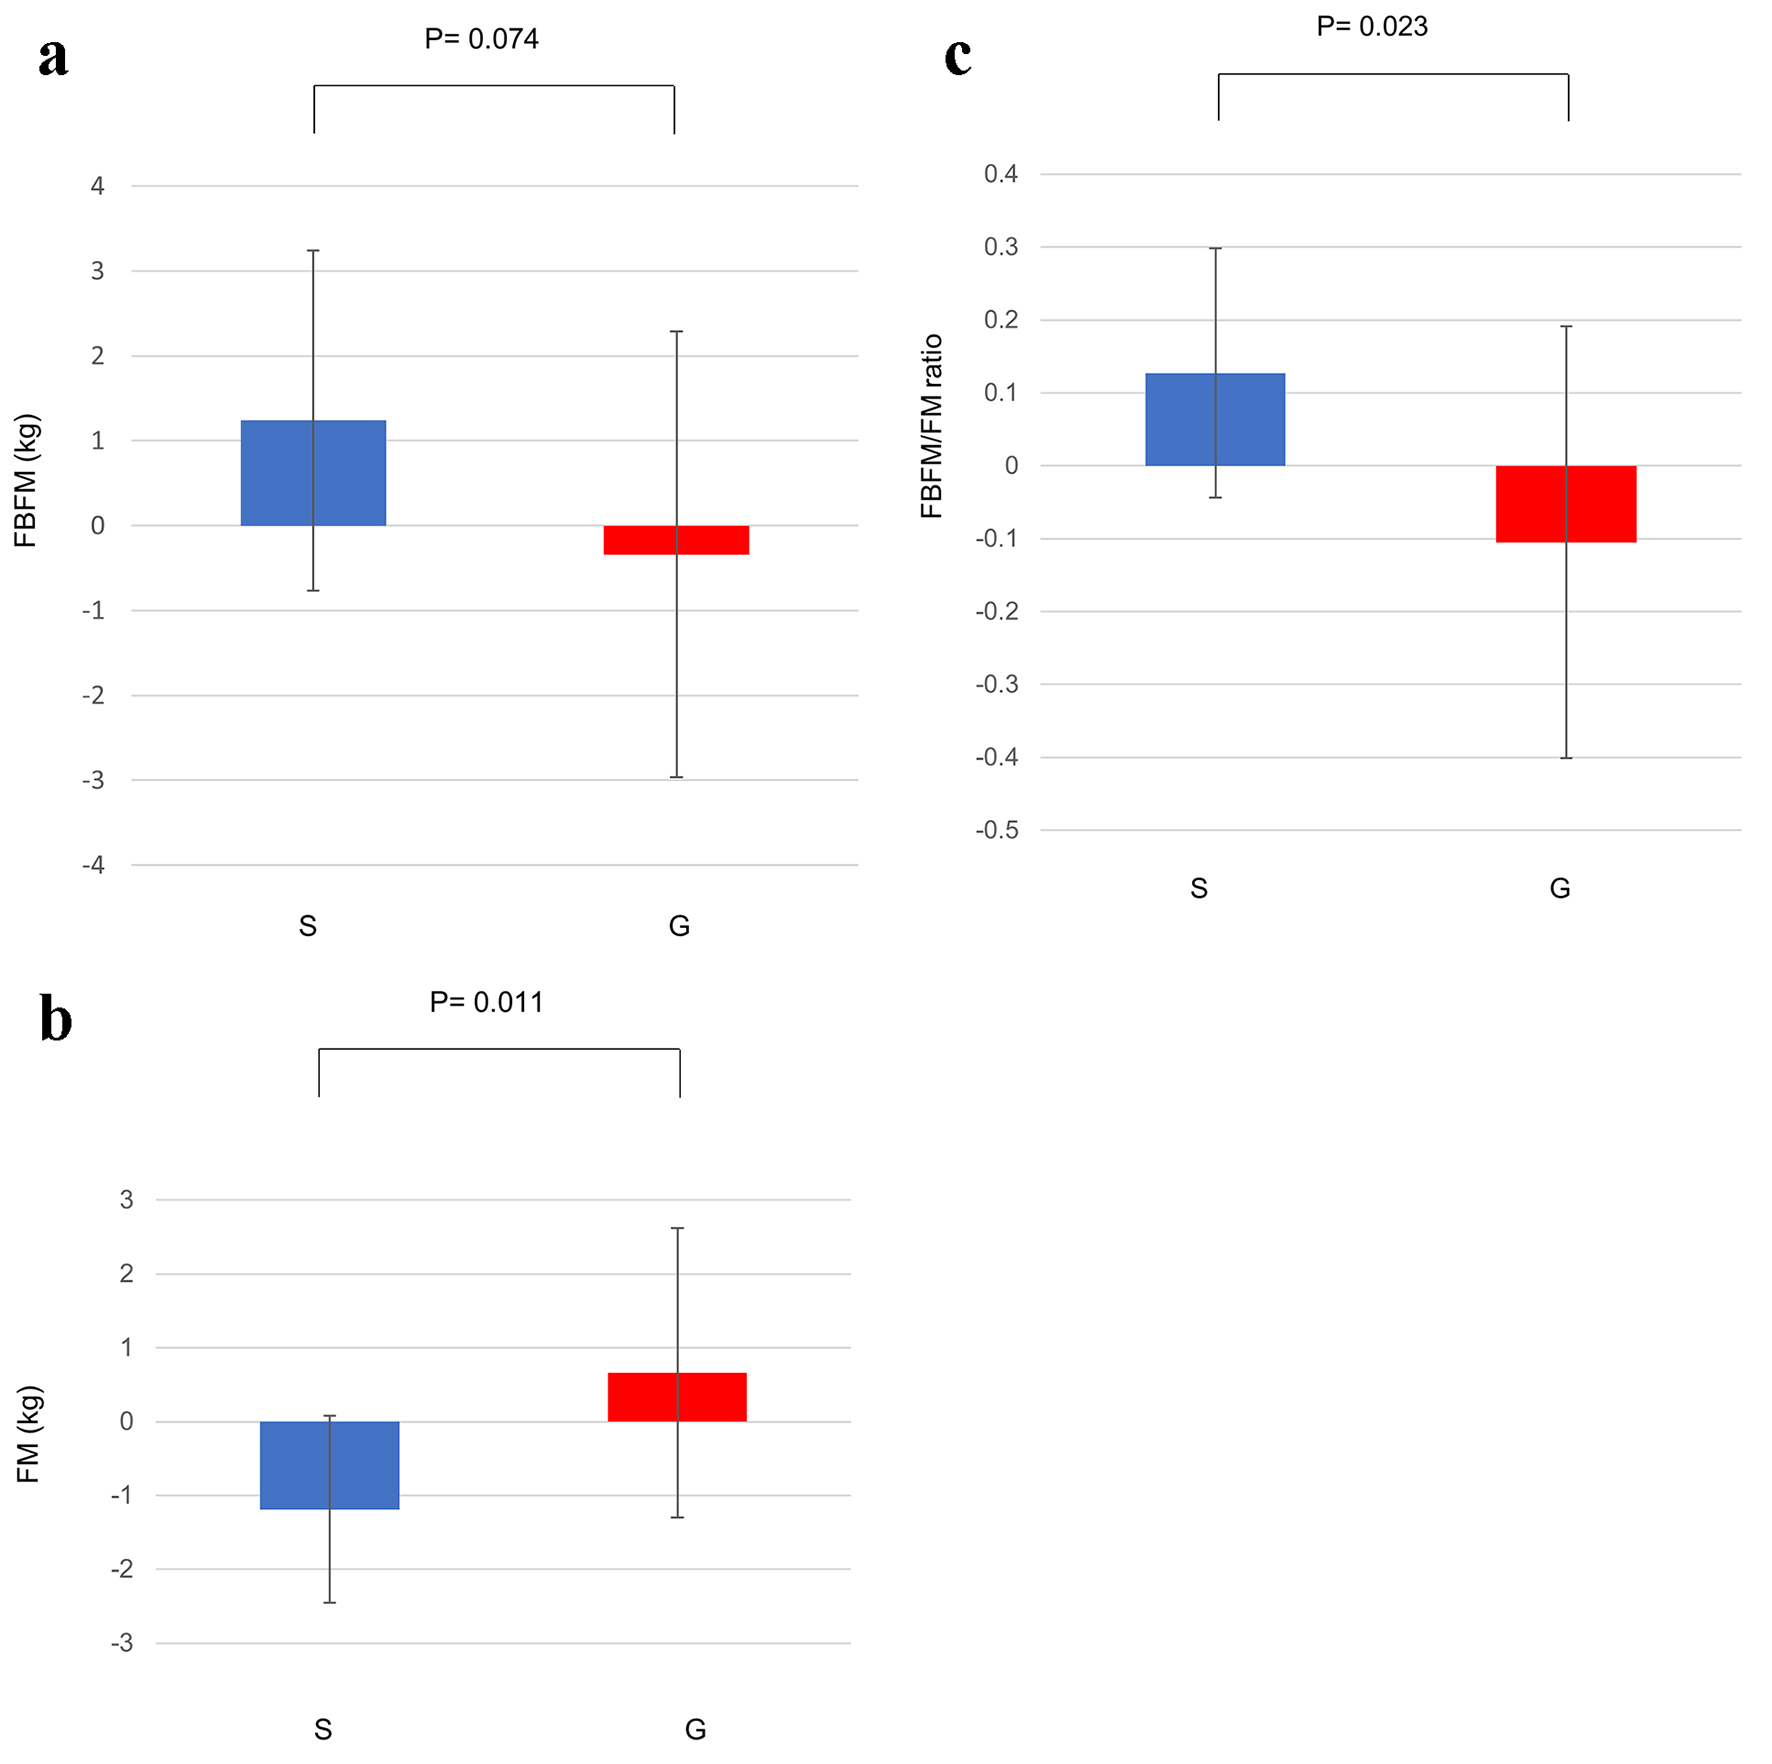
Figure 1. (a) Change in the FBFM from baseline to 24 weeks. (b) Change in the FM from baseline to 24 weeks. (c) Change in the FBFM/FM ratio from baseline to 24 weeks. Data are shown as mean ± SD. FBFM: fat and bone-free mass; FM: fat mass; G: glimepiride group; S: sitagliptin group; SD: standard deviation.

Table

Table 1. Change in Body Composition Parameters
 
Sitagliptin groupGlimepiride group
Baseline12 weeksP (vs. baseline)24 weeksP (vs. baseline)Baseline12 weeksP (vs. baseline)24 weeksP (vs. baseline)
Data are expressed as mean ± SD. FBFM: fat and bone-free mass, FM: fat mass.
Age (years)61.3 ± 13.251.8 ± 13.2
Gender (male/female)6/45/5
Body weight (kg)75.9 ± 16.575.5 ± 15.50.75876.0 ± 16.50.45177.9 ± 18.277.5 ± 17.90.72878.0 ± 18.30.407
FBFM (kg)47.6 ± 10.347.5 ± 10.10.54948.8 ± 11.00.04149.7 ± 10.648.8 ± 9.50.85949.3 ± 9.90.655
FM (kg)26.4 ± 9.026.0 ± 8.10.22625.2 ± 8.10.00826.0 ± 10.826.6 ± 11.00.76226.7 ± 10.80.842
FBFM/FM ratio2.0 ± 0.82.0 ± 0.70.5562.1 ± 0.80.0222.1 ± 0.92.0 ± 0.60.7842.0 ± 0.70.855