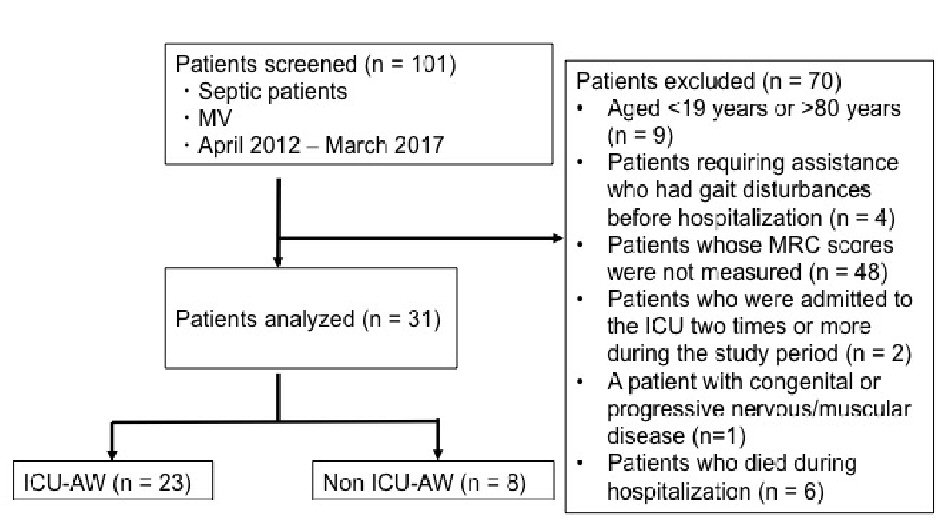
Figure 1. Study flowchart. MV: mechanical ventilator; ICU-AW: intensive care unit-acquired weakness; MRC: Medical Research Council.
| Journal of Clinical Medicine Research, ISSN 1918-3003 print, 1918-3011 online, Open Access |
| Article copyright, the authors; Journal compilation copyright, J Clin Med Res and Elmer Press Inc |
| Journal website http://www.jocmr.org |
Original Article
Volume 11, Number 12, December 2019, pages 834-841
Skeletal Muscle Index at Intensive Care Unit Admission Is a Predictor of Intensive Care Unit-Acquired Weakness in Patients With Sepsis
Figures
Tables
| Group AW (n = 23) | Group NAW (n = 8) | P value | |
|---|---|---|---|
| Data are expressed as means ± standard deviation. Categorical variables were compared using Fisher’s exact test, and continuous variables were compared using the Mann-Whitney U test. BMI: body mass index; APACHE: Acute Physiology and Chronic Health Evaluation; ICU-AW: AW: acquired weakness; NAW: non-acquired weakness. | |||
| Age (years) | 66.0 ± 11.9 | 66.1 ± 13.3 | 0.511 |
| Gender, male (%) | 7 (30.4%) | 6 (75.0%) | 0.043 |
| BMI (kg/m2) | 24.5 ± 5.0 | 24.3 ± 1.9 | < 0.999 |
| Height | 155.7 ± 11.9 | 162.0 ± 13.1 | 0.182 |
| Weight (kg) | 63.1 ± 14.7 | 59.6 ± 14.2 | 0.443 |
| Barthel index | 13.0 ± 19.6 | 16.2 ± 16.6 | 0.305 |
| APACHE II score | 22.8 ± 8.8 | 17.8 ± 4.1 | 0.167 |
| ICU admission | ICU discharge | |||||
|---|---|---|---|---|---|---|
| Group AW (n = 23) | Group NAW (n = 8) | P value | Group AW (n = 23) | Group NAW (n = 8) | P value | |
| Data are expressed as means ± standard deviation. Categorical variables were compared using Fisher’s exact test, and continuous variables were compared using the Mann-Whitney U test. Alb: serum albumin; BUN: blood urea nitrogen; Cre: creatinine; CRP: C-reactive protein; AST: aspartate aminotransferase; ALT: alanine aminotransferase; T-bil: total bilirubin; CK: creatine kinase; WBC: white blood cell count; ICU-AW: intensive care unit-acquired weakness; AW: acquired weakness; NAW: non-acquired weakness. | ||||||
| Alb (g/dL) | 2.08 ± 0.4 | 1.9 ± 0.4 | 0.496 | 2.1 ± 0.4 | 2.1 ± 0.3 | 0.602 |
| BUN (mg/dL) | 44.4 ± 18.6 | 45.0 ± 29.0 | 0.769 | 28.5 ± 22.5 | 16.6 ± 5.8 | 0.09 |
| Cre (mg/dL) | 1.9 ± 1.3 | 2.9 ± 2.7 | 0.892 | 1.1 ± 1.4 | 0.6 ± 0.3 | 0.391 |
| CRP (mg/dL) | 24.5 ± 9.6 | 24.1 ± 6.8 | 0.964 | 8.7 ± 7.9 | 8.7 ± 7.9 | 0.964 |
| Glucose (mg/dL) | 155.3 ± 108.9 | 142.5 ± 57.3 | 0.701 | 121.2 ± 28.7 | 136 ± 30.2 | 0.13 |
| Lactate (mg/dL) | 4.2 ± 3.2 | 3.1 ± 1.6 | 0.54 | 1.3 ± 0.7 | 1.1 ±0.1 | 0.329 |
| AST (U/L) | 349.1 ± 925.9 | 132.7 ± 185.2 | 0.857 | 31.3 ± 21.3 | 42.7 ± 24 | 0.175 |
| ALT(U/L) | 248.2 ± 763.8 | 60.5 ± 71.1 | 0.786 | 33.6 ± 35.3 | 52.7 ± 38.5 | 0.114 |
| T-bil (mg/dL) | 1.54 ± 1.2 | 1.8 ± 1.1 | 0.442 | 0.9 ± 1 | 1 ± 0.7 | 0.275 |
| CK (U/L) | 887.3 ± 1435.6 | 1117.1 ± 1733.6 | 0.685 | 47.3 ± 80.1 | 101 ± 134.1 | 0.175 |
| WBC (103/µL) | 9536.5 ± 7131.5 | 8405.0 ± 6932.1 | 0.498 | 9536.5 ± 7131.5 | 8405 ± 6932.1 | 0.391 |
| PO2 (mm Hg +) | 121 ± 117.0 | 83.3 ± 19.2 | 0.542 | 82.2 ± 15 | 83.2 ± 13 | 0.769 |
| pH | 7.4 ± 0.1 | 7.4 ± 0.1 | 0.557 | 7.4 ± 0 | 7.4 ± 0 | 0.701 |
| PCO2 (mm Hg +) | 31.4 ± 6.7 | 30.7 ± 7.9 | 0.874 | 39.4 ± 7.9 | 36.2 ± 5.5 | 0.404 |
| Group AW (n = 23) | Group NAW (n = 8) | P value | |
|---|---|---|---|
| Data are expressed as means ± standard deviation or as n (%). Categorical variables were compared using Fisher’s exact test, and continuous variables were compared using the Mann-Whitney U test. BMI: body mass index; ICU LOS: intensive care unit length of stay; MV: mechanical ventilation; AW: acquired weakness; NAW: non-acquired weakness. | |||
| BMI | 23.3 ± 5.4 | 22.8 ± 2.1 | 0.874 |
| ICU LOS (day) | 23.4 ± 20.6 | 11.8 ± 8.3 | 0.214 |
| Hospital LOS (day) | 95.5 ± 61.9 | 32.3 ± 14.1 | 0.007 |
| Days until first upright sitting (day) | 25.4 ± 35.6 | 8.8 ± 8 | 0.015 |
| Days until first sitting in a wheelchair (day) | 26.2 ± 27.2 | 9.2 ± 7.9 | 0.007 |
| Blood purification therapy (%) | 7 (30.4%) | 1 (12.5%) | 0.642 |
| Barthel index | 49.7 ± 33.3 | 81.2 ± 21.1 | 0.021 |
| MV day | 5.9 ± 7.5 | 2.6 ± 2.2 | 0.243 |
| ICU admission | ICU discharge | |||||
|---|---|---|---|---|---|---|
| Group AW (n = 23) | Group NAW (n = 8) | P value | Group AW (n = 23) | Group NAW (n = 8) | P value | |
| Data are expressed as means ± standard deviation. Categorical variables were compared using Fisher’s exact test, and continuous variables were compared using the Mann-Whitney U test. CT: computed tomography; SMI: skeletal muscle index; ICU: intensive care unit; AW: acquired weakness; NAW: non-acquired weakness. | ||||||
| Days until CT imaging | 0.5 ± 1.3 | 1.3 ± 2.5 | 0.241 | 18.1 ± 11.8 | 14.3 ± 5.7 | 0.825 |
| SMI | 40.7 ± 9.4 | 46.4 ± 6.4 | 0.042 | 36.9 ± 6.4 | 43.4 ± 4.1 | 0.029 |
| Lower SMI (n = 20) | Higher SMI (n = 11) | P value | |
|---|---|---|---|
| Data are expressed as n (%). P < 0.05 was considered significant. Categorical variables were compared by Fisher’s exact test. ICU-AW: intensive care unit-acquired weakness; SMI: skeletal muscle index. | |||
| ICU-AW + | 18 (58.0) | 5 (16.1) | 0.012 |
| ICU-AW - | 2 (6.4) | 6 (19.3) | |
| Variable | OR (95% CI) | P value | Percentage of correct classifications |
|---|---|---|---|
| Data were analyzed by logistic regression analysis model. OR: odds ratio; CI: confidence interval; SMI: skeletal muscle index; ICU: intensive care unit. | |||
| SMI at ICU admission | |||
| > 44.1 cm2/m2 | 1.000 | ||
| ≤ 44.1 cm2/m2 | 10.800 (1.644 - 70.934) | 0.013 | 77.4% |