Figures
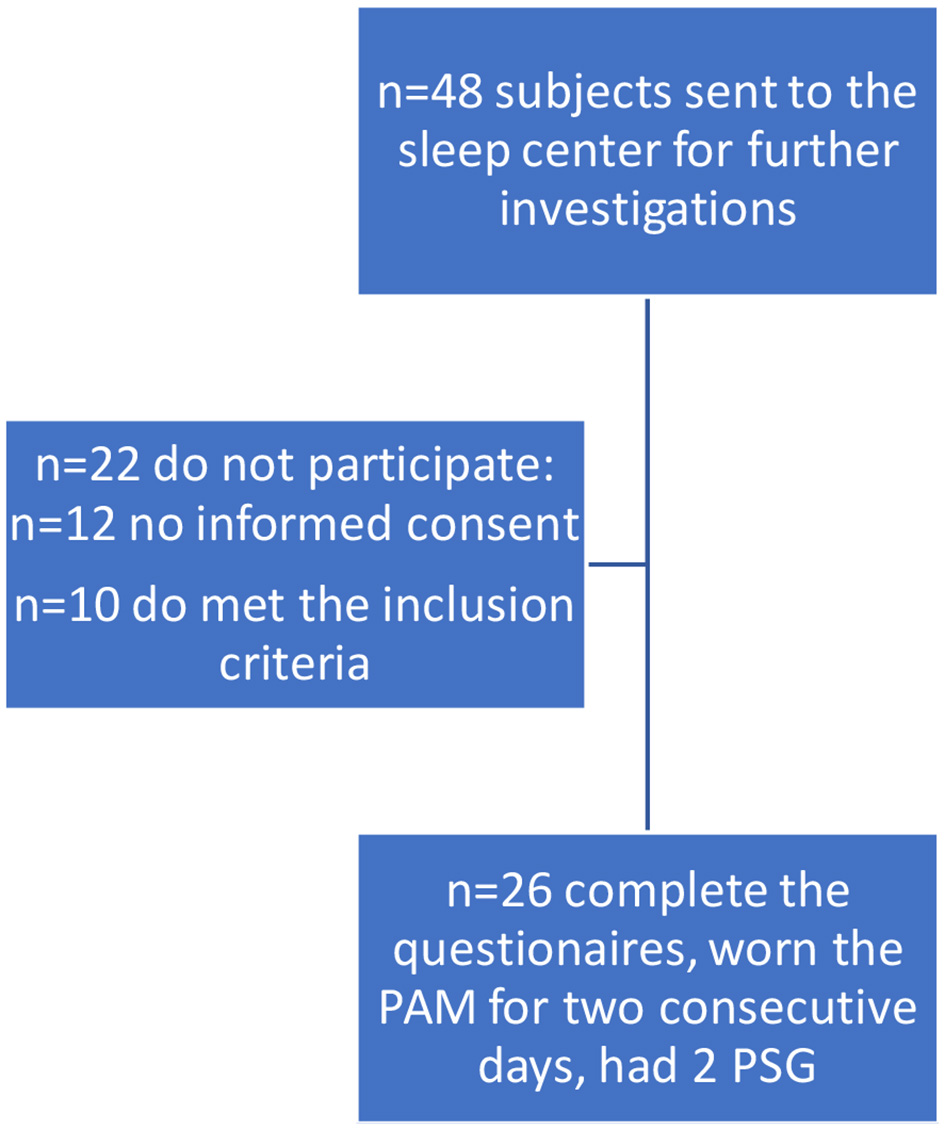
Figure 1. Flow chart. PSG: polysomnography; PAM: physical activity monitor.
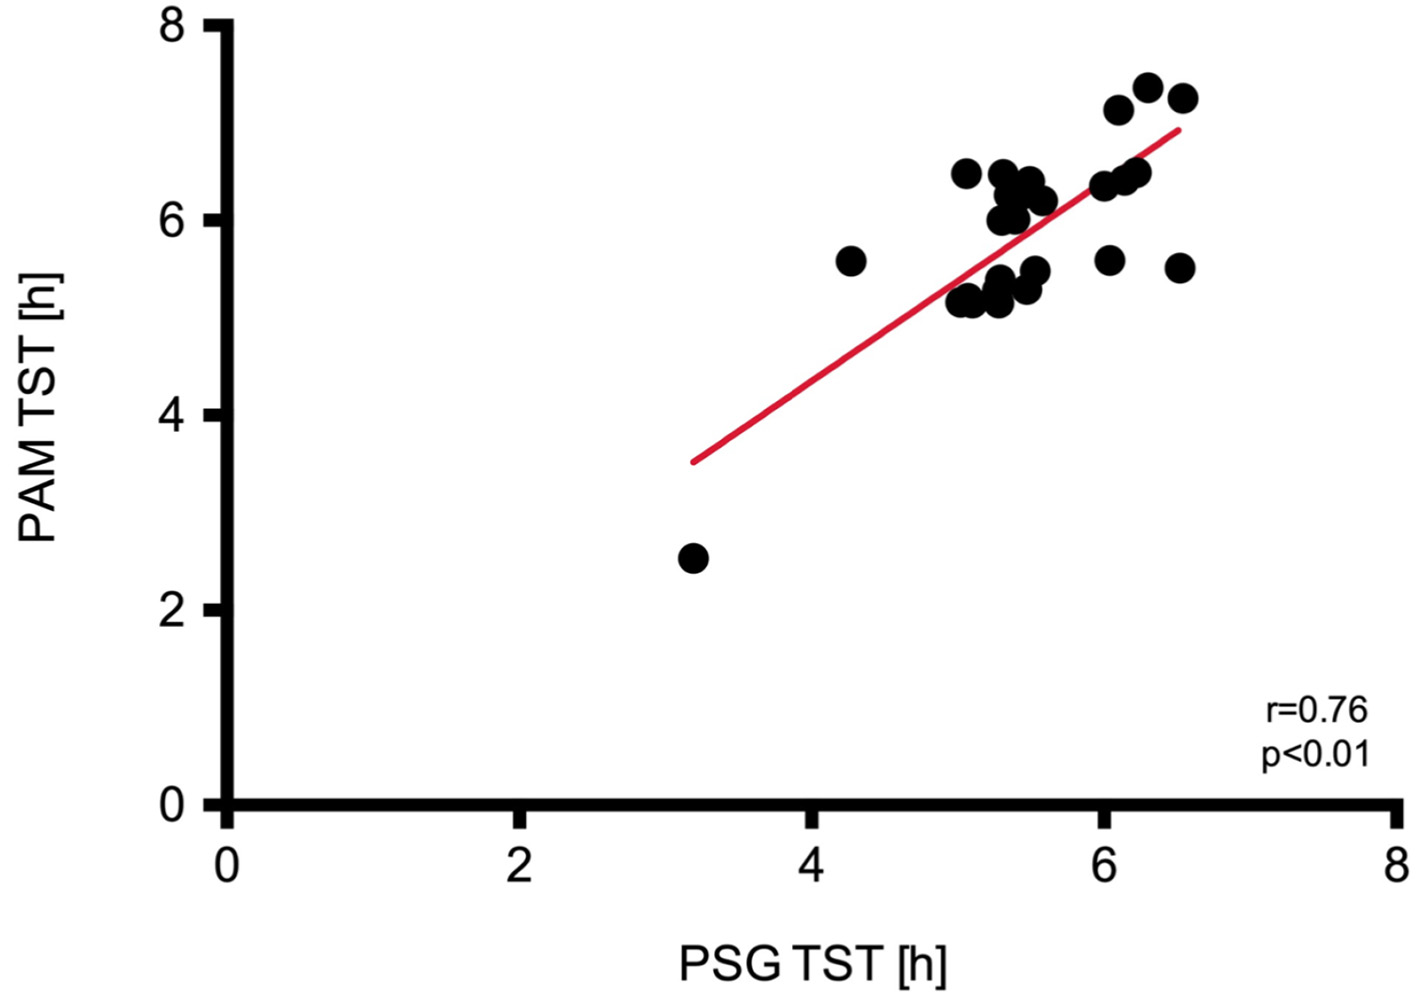
Figure 2. Regression analysis and identity plots. Total sleep time (TST) between Polar A300 and polysomnography (PSG). PAM: physical activity monitor.
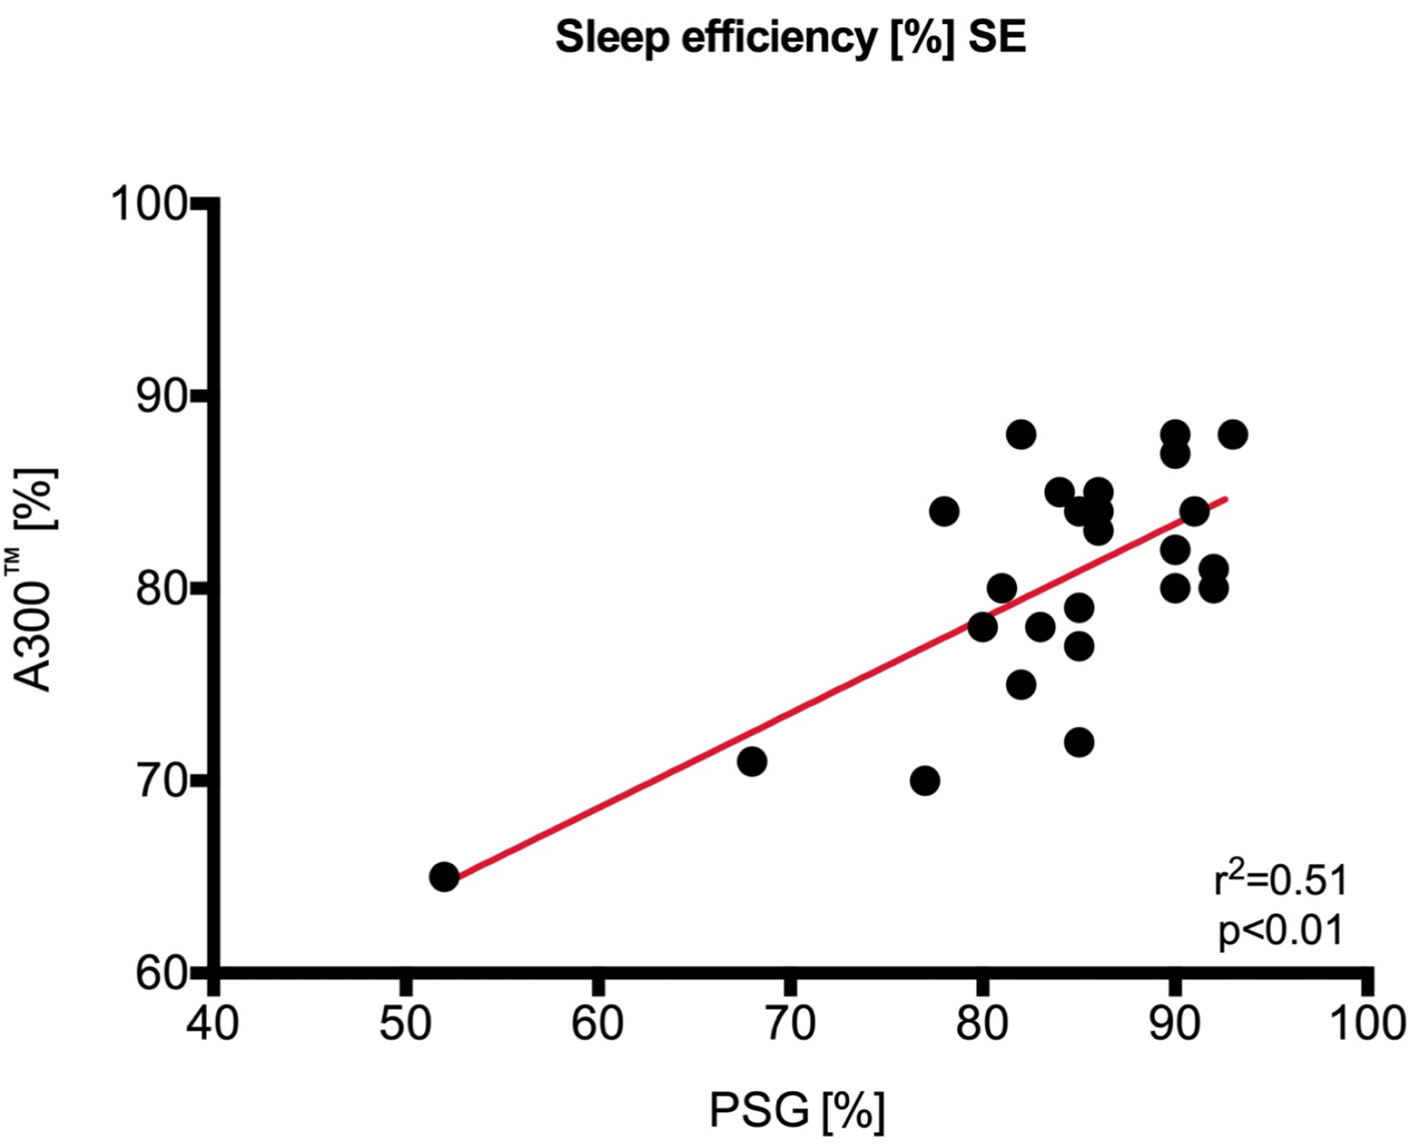
Figure 3. Regression analysis and identity plots. Sleep efficiency between Polar A300 and polysomnography (PSG). SE: standard error.
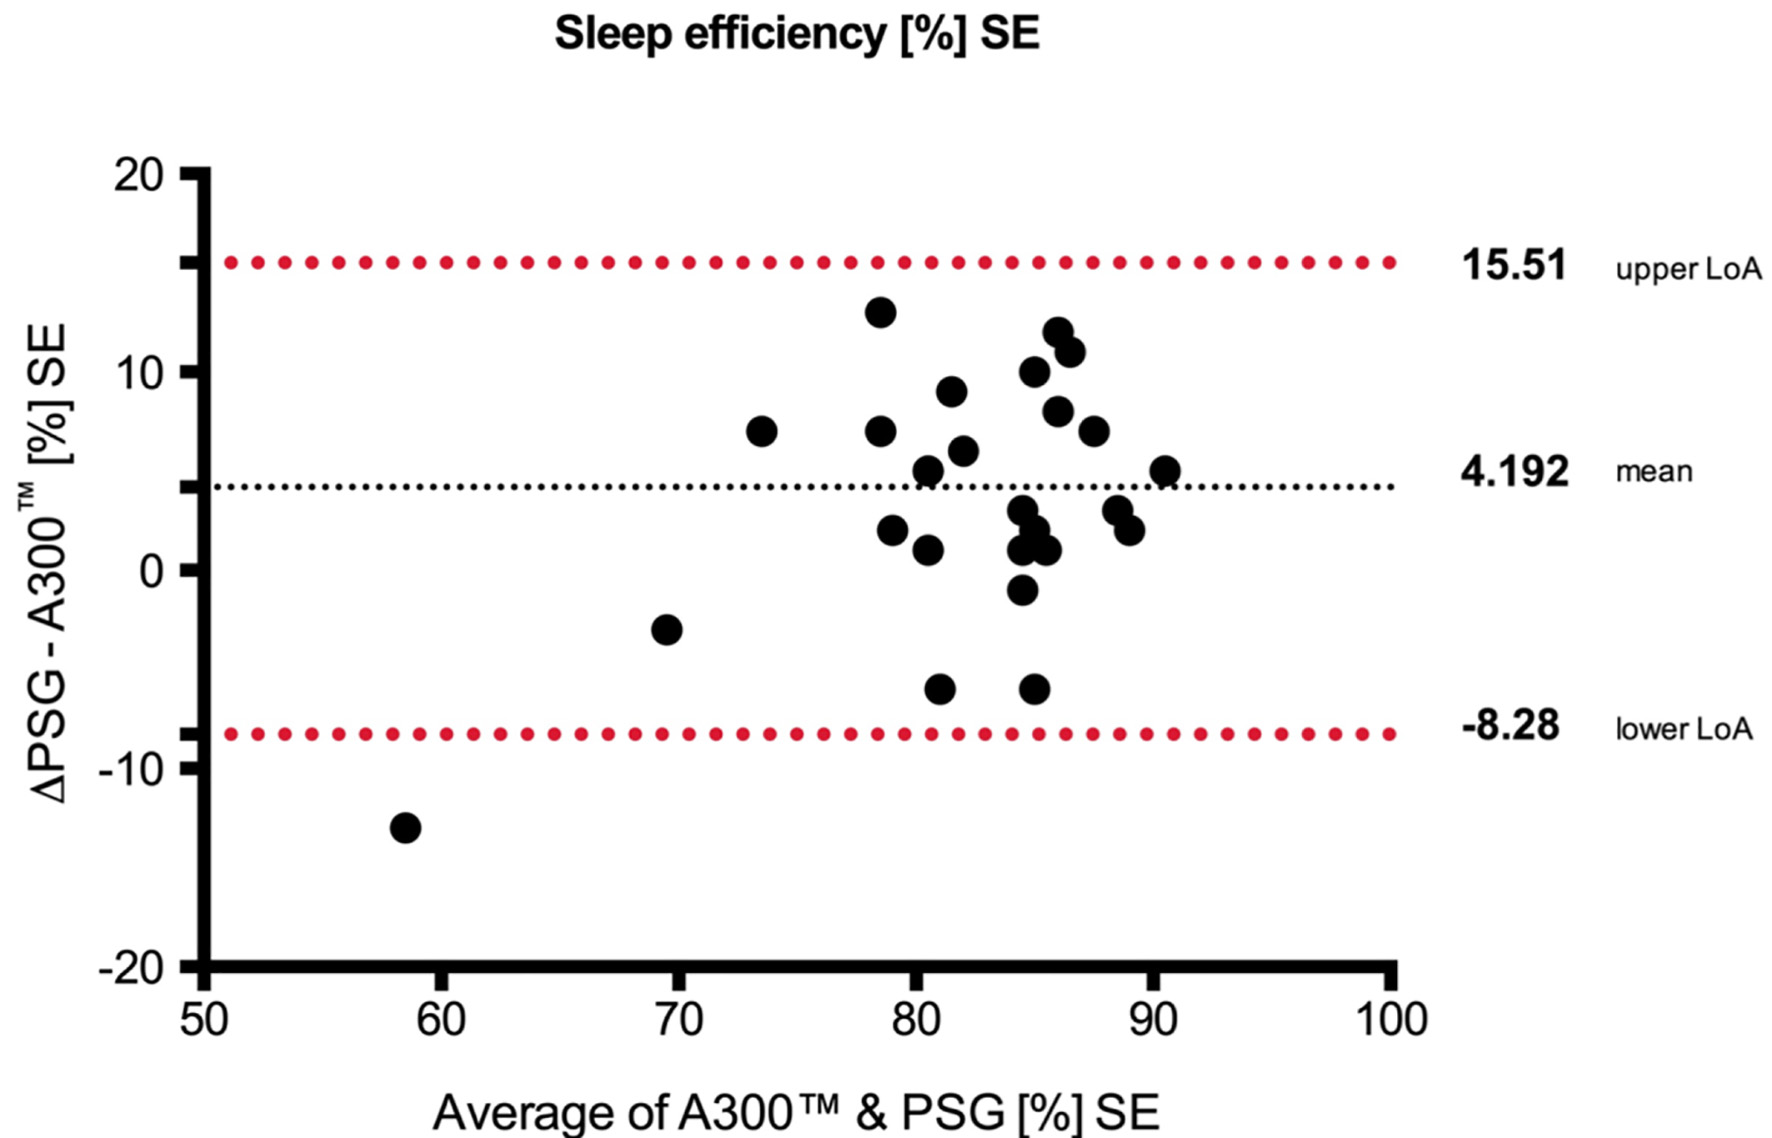
Figure 4. Bland-Altman plots with the mean over 2 days. Upper/lower limits of agreement (LoA) and 95% confidence interval (CI) (over/under the means) of sleep efficiency between (SE) Polar A300 and polysomnography (PSG). SE: standard error.
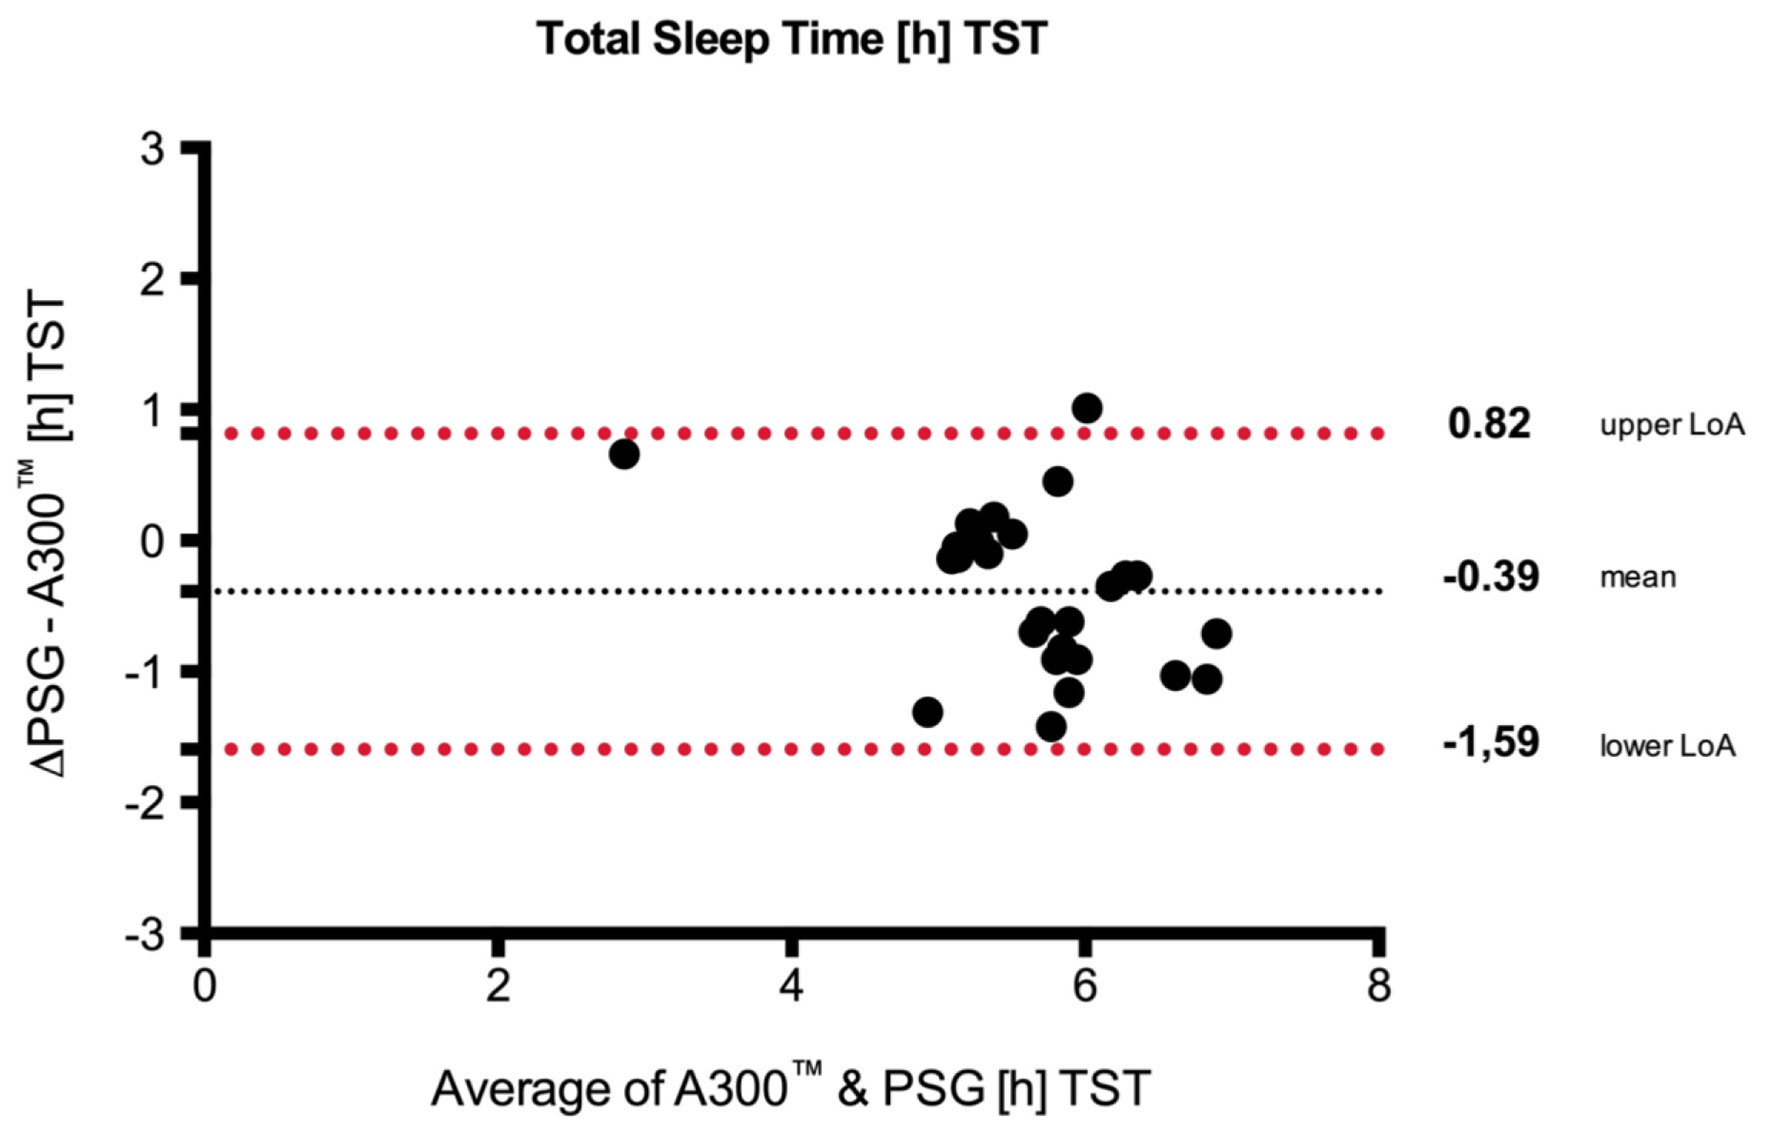
Figure 5. Bland-Altman plots with the mean over 2 days. Upper/lower limits of agreement (LoA) and 95% CI (over/under the means) of total sleep time (TST) between SE Polar A300 and polysomnography (PSG). SE: standard error.
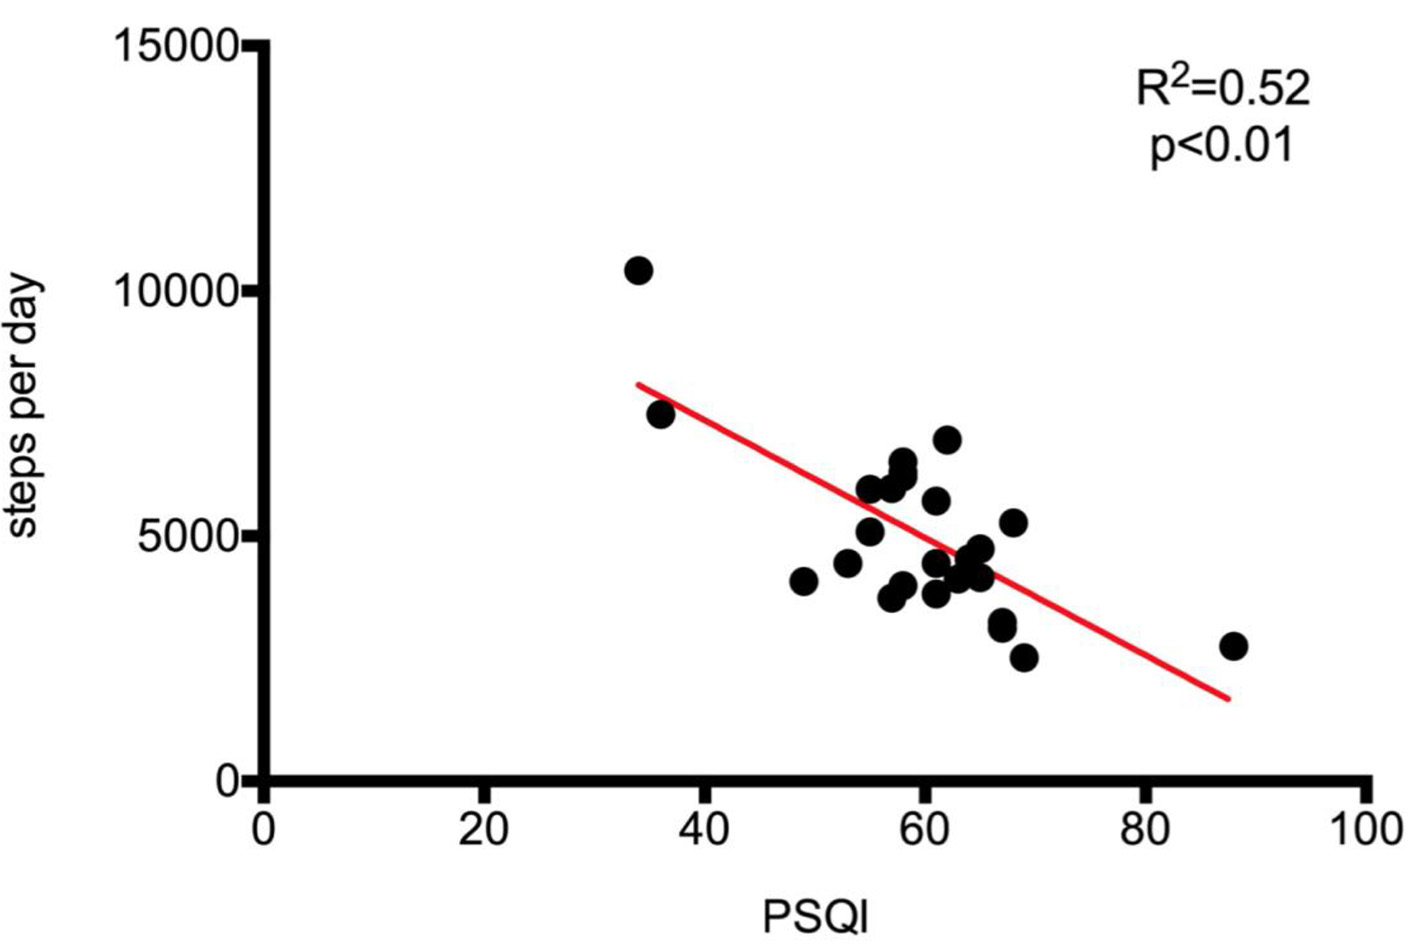
Figure 6. Regression analysis and identity plots. Steps per day between Polar A300 and Pittsburgh sleep quality index (PSQI).
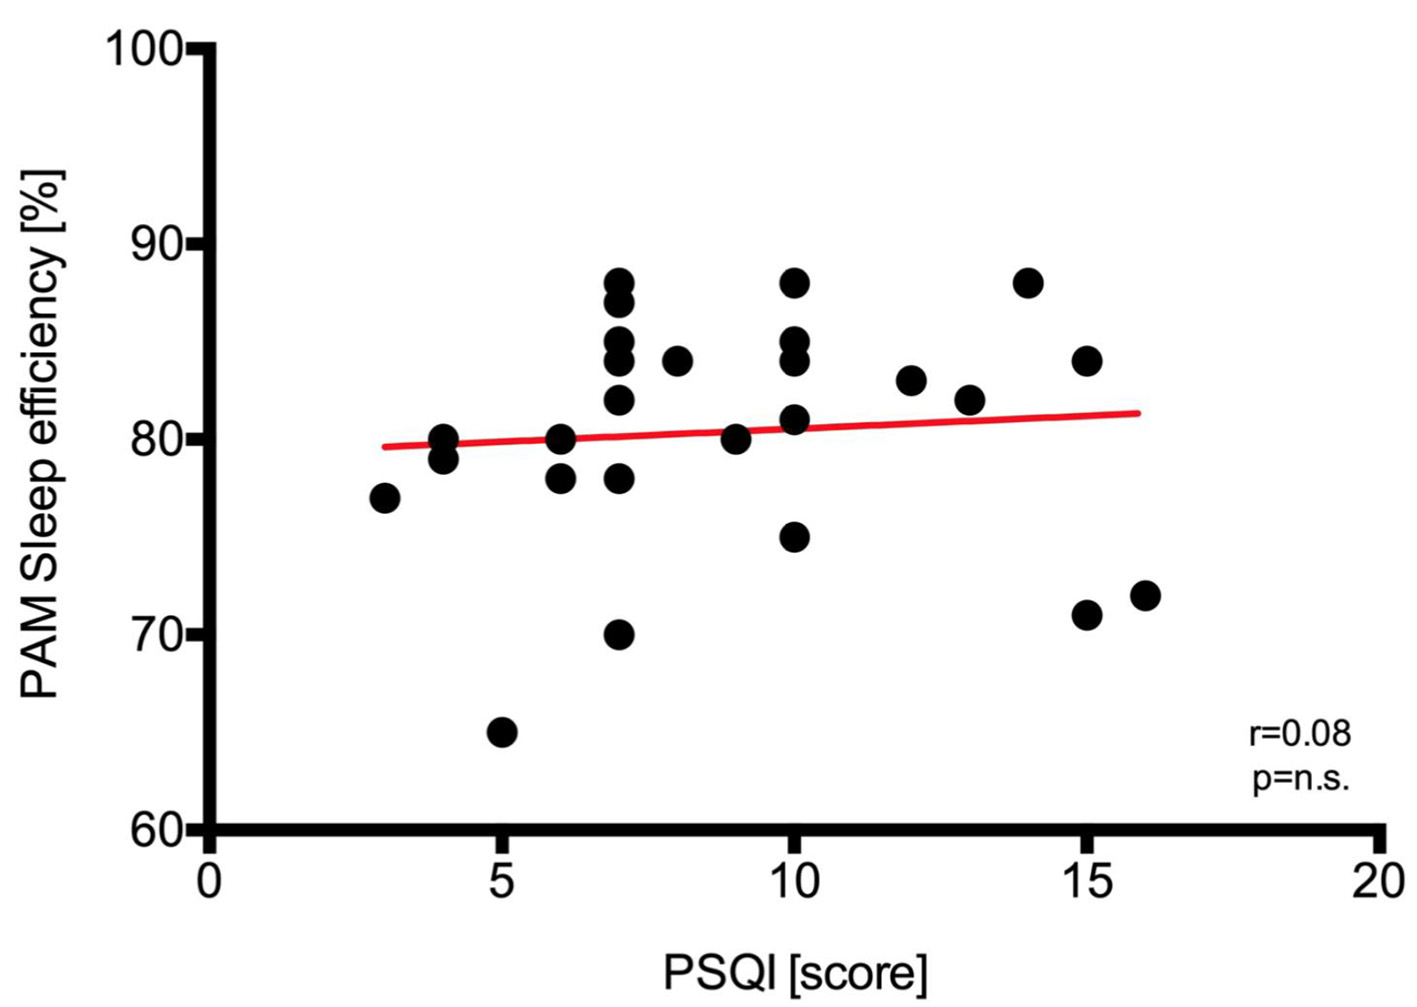
Figure 7. Regression analysis and identity plots. Sleep efficiency between Polar A300 and Pittsburgh sleep quality index (PSQI). PAM: physical activity monitor.
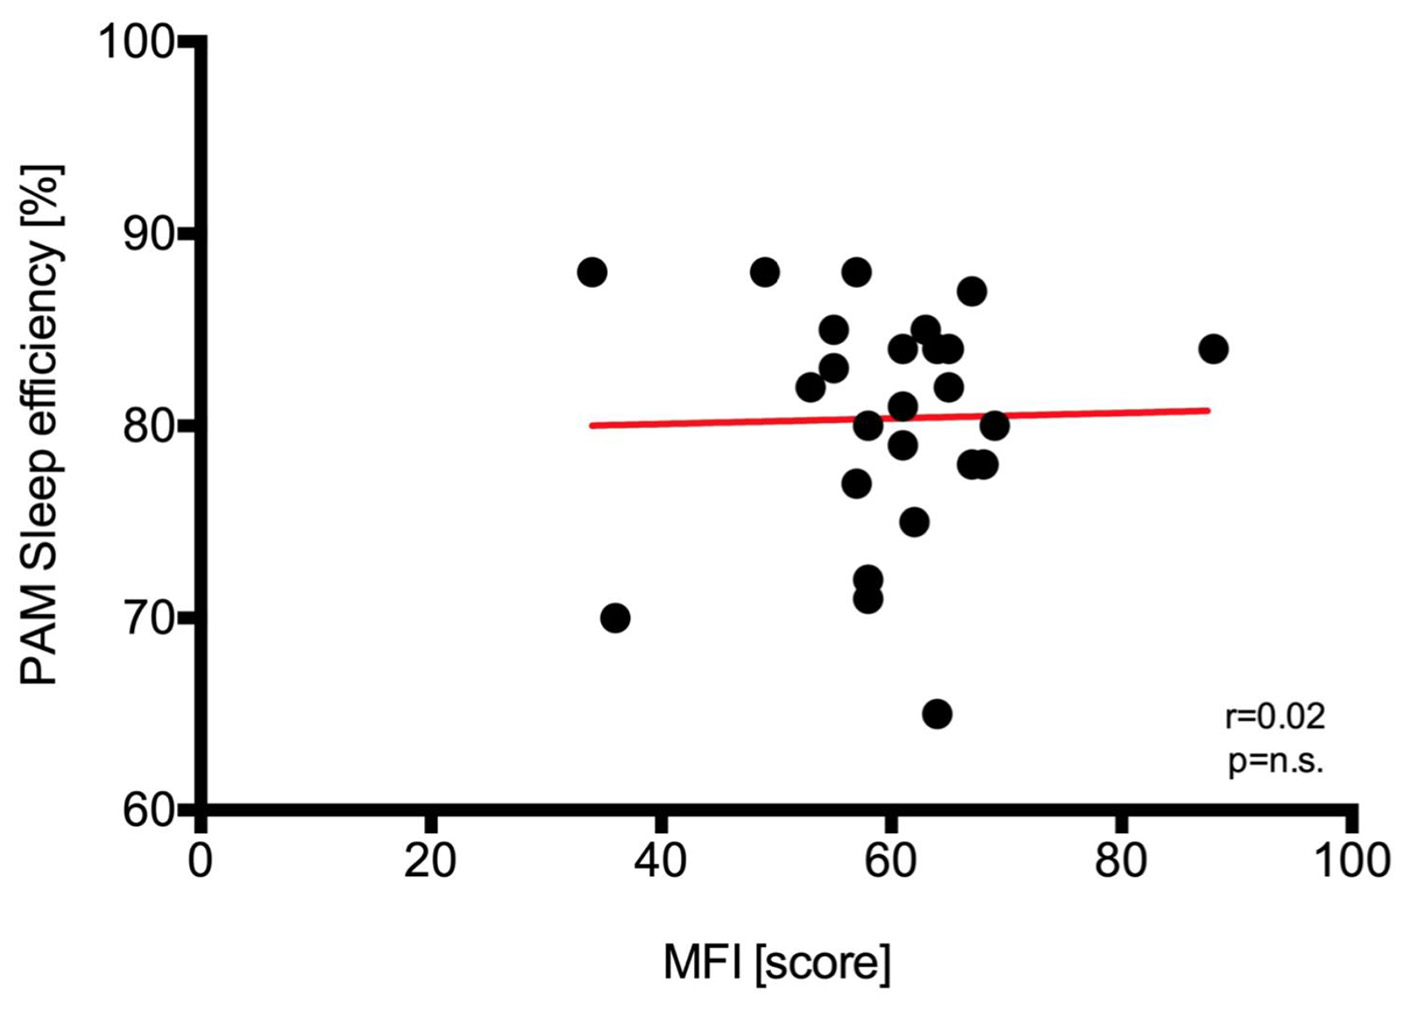
Figure 8. Regression analysis and identity plots. Sleep efficiency between Polar A300 and multidimensional fatique inventory (MFI). PAM: physical activity monitor.
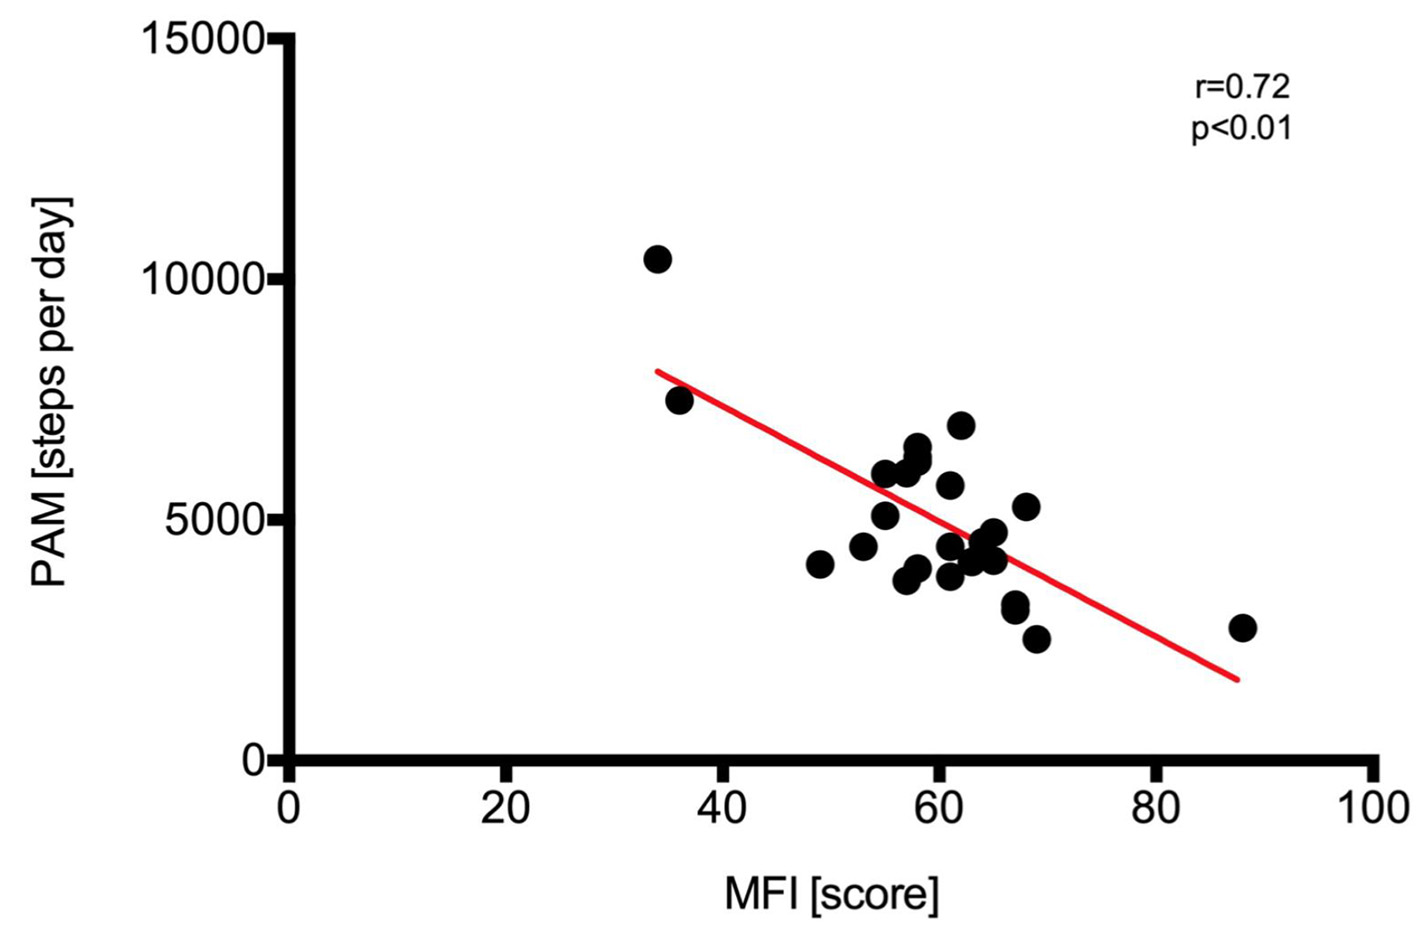
Figure 9. Regression analysis and identity plots. Steps per day between Polar A300 and multidimensional fatique inventory (MFI). PAM: physical activity monitor.
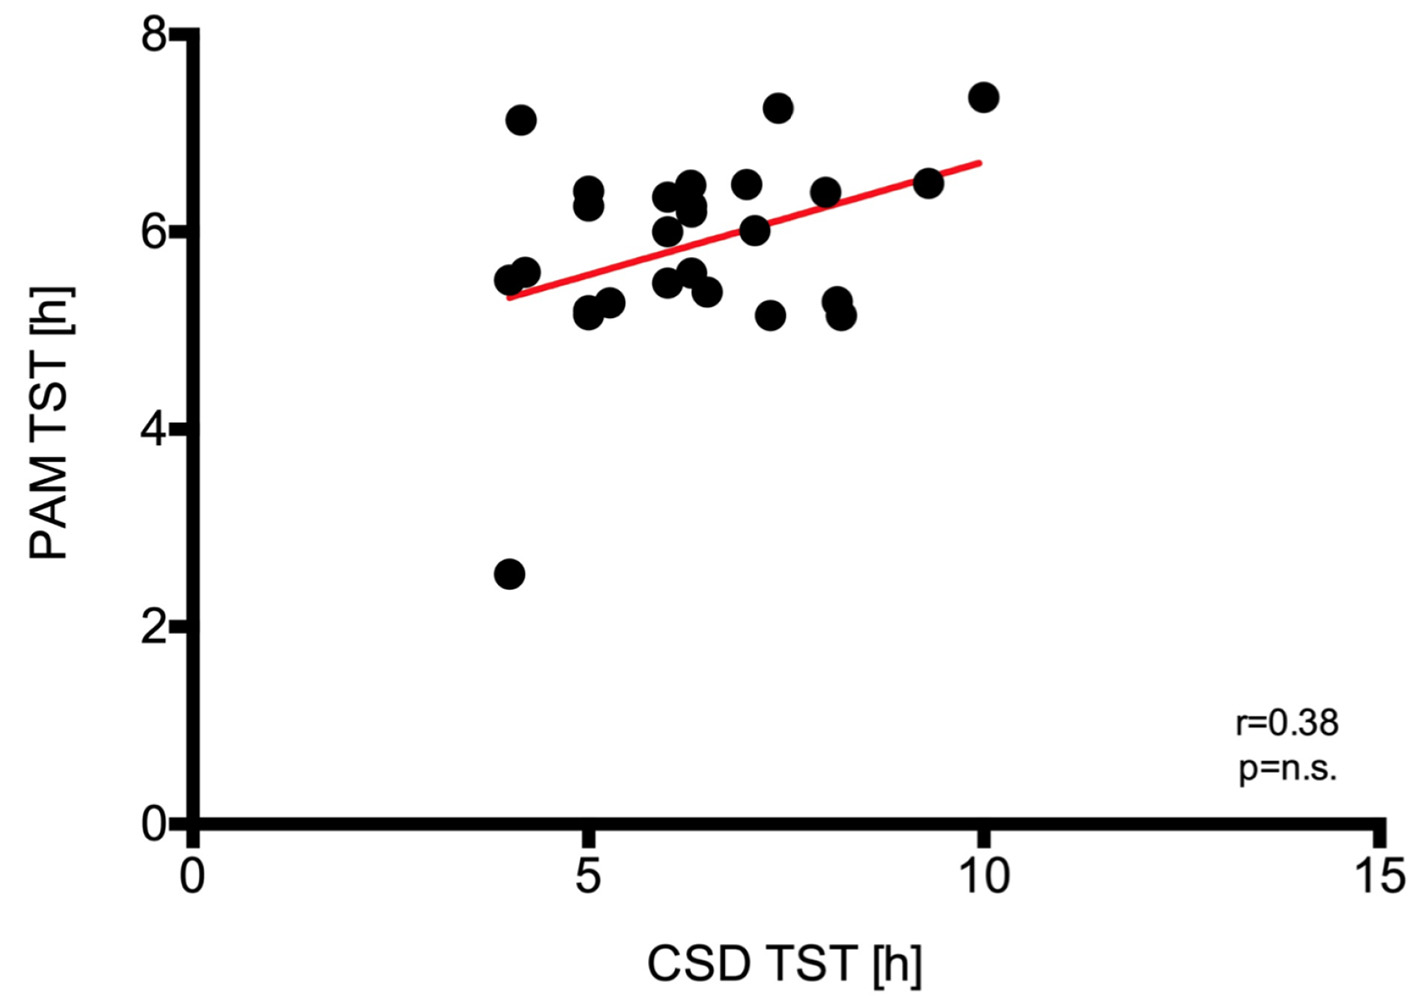
Figure 10. Regression analysis and identity plots. Total sleep time (TST) between Polar A300 and consensus sleep diary (CSD). PAM: physical activity monitor.
Tables
Table 1. Baseline Parameters (n = 26)
| Variables | Value (mean ± SD) (min. - max.) |
|---|
| SD: standard deviation; BMI: body mass index; AHI: apnea-hypopnea index; PAL: physical activity level. |
| Age (years) | 54.8 ± 14.4 (27 - 86) |
| Sex (male/female) | 17/9 |
| BMI (kg/m2) | 30.4 ± 4.8 (21 - 41) |
| AHI (per h) | 8.1 ± 9 (0 - 34) |
| Smoking (pack years) | 16.6 ± 4.8 (0 - 40) |
| PAL | 1.51 ± 0.1 (1.4 - 1.8) |
Table 2. Comorbidities of the Patients
| Disease | Patient count |
|---|
| RLS: restless leg syndrome; COPD: chronic obstructive pulmonary disease. |
| Arterial hypertension | 7 |
| Asthma | 2 |
| Hypothyreose | 2 |
| RLS | 1 |
| Diabetes mellitus (type II) | 1 |
| Depression | 1 |
| COPD | 1 |