Journal of Clinical Medicine Research, ISSN 1918-3003 print, 1918-3011 online, Open Access |
Article copyright, the authors; Journal compilation copyright, J Clin Med Res and Elmer Press Inc |
Journal website http://www.jocmr.org |
Original Article
Volume 11, Number 11, November 2019, pages 745-759
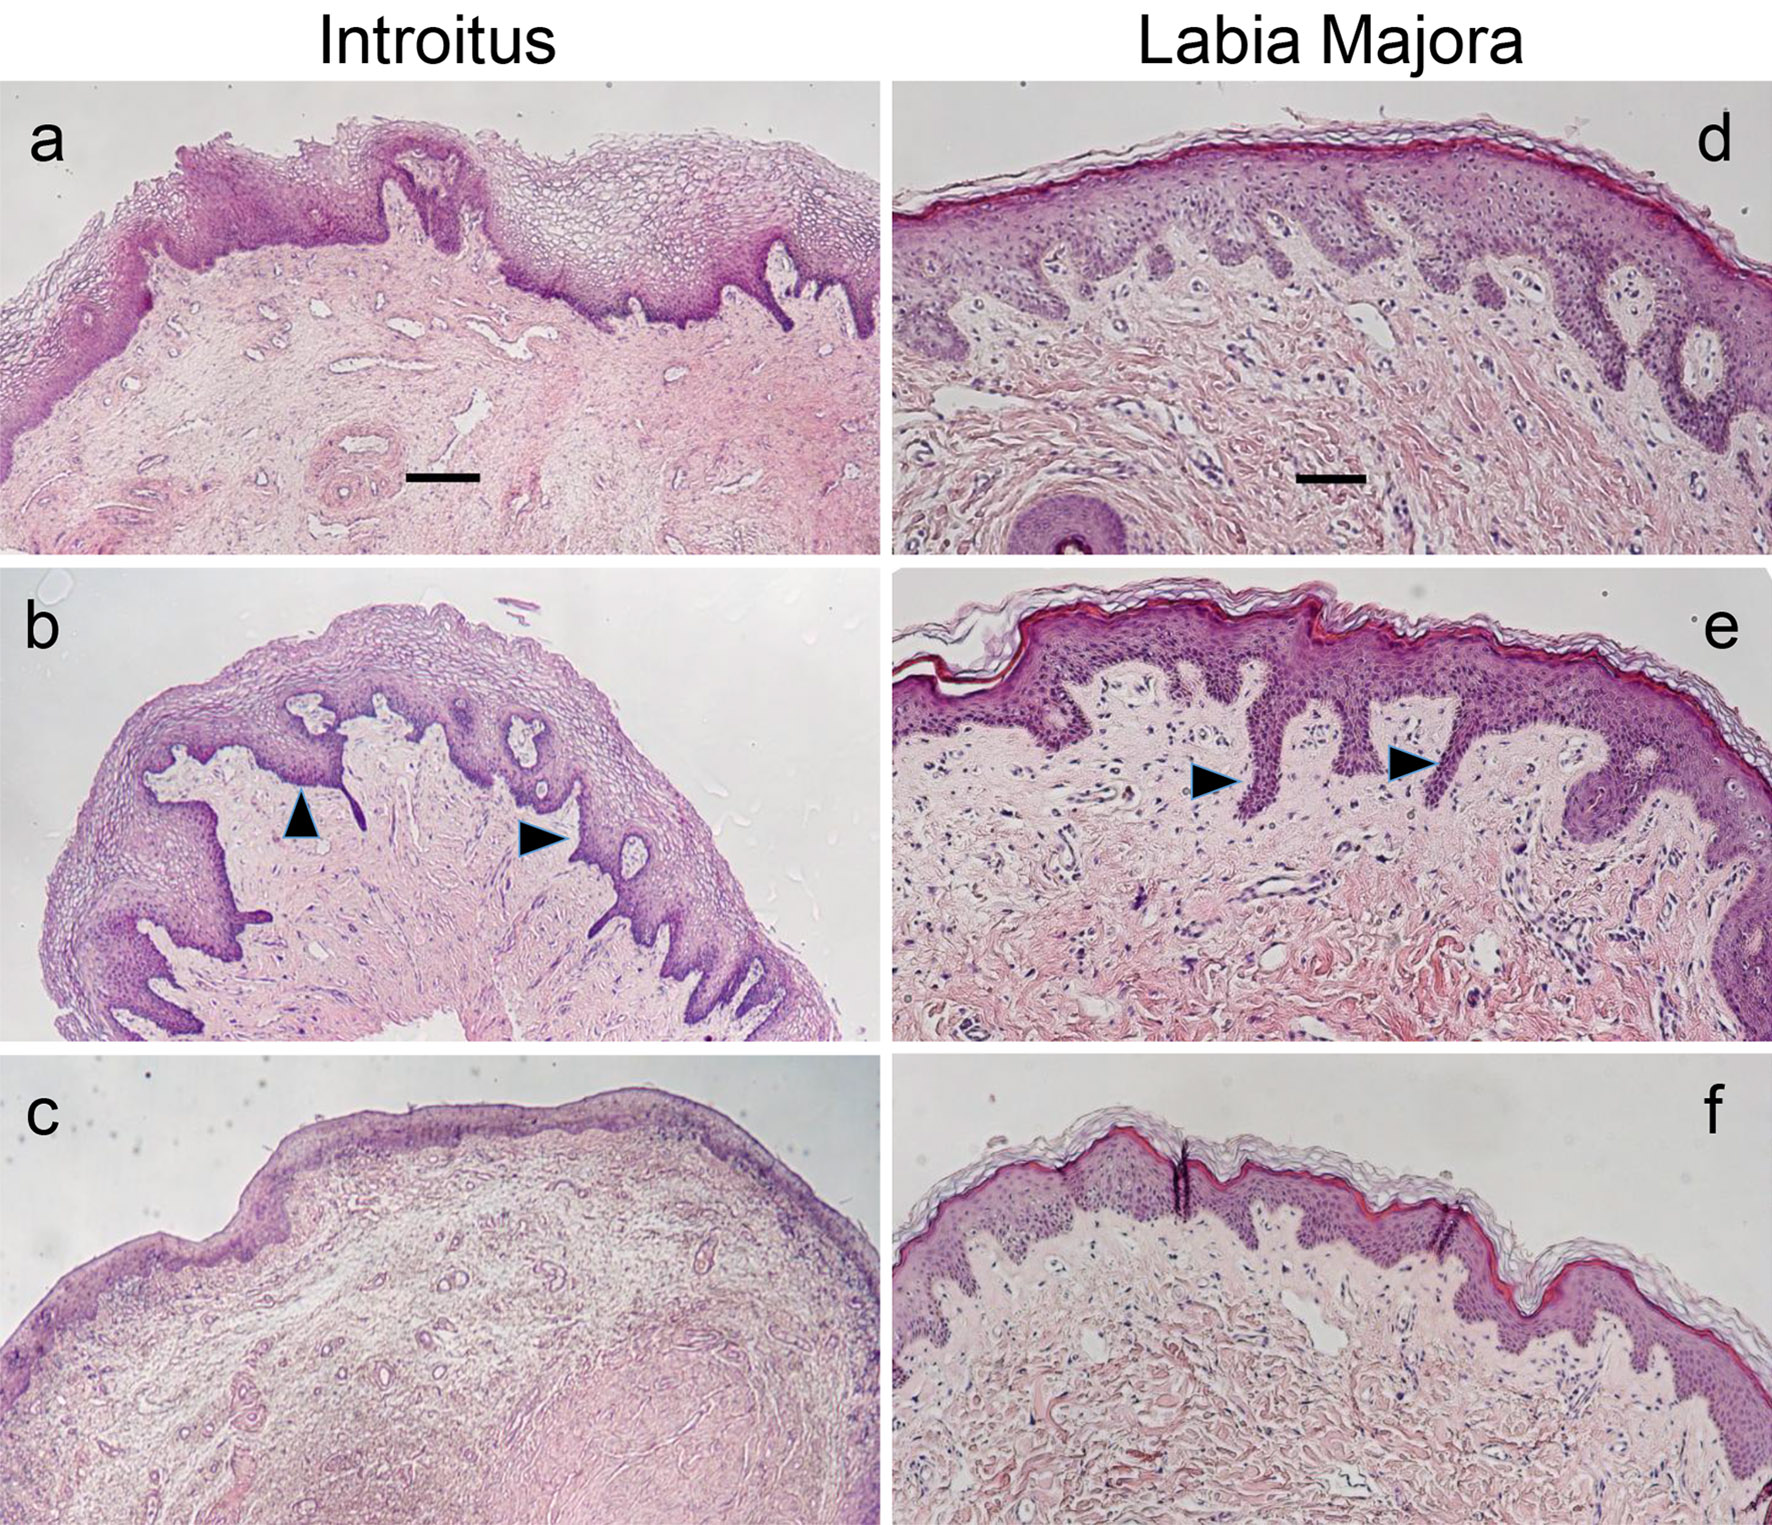
Histological and Gene Expression Analysis of the Effects of Menopause Status and Hormone Therapy on the Vaginal Introitus and Labia Majora
Figures
Tables
Attribute | Pre-M | P value of Pre-M vs. Post-M | Post-M | P value of Post-M vs. Post-M + HT | Post-M + HT |
---|---|---|---|---|---|
N = 10 per group. Data are mean ± SE. Pre-M: pre-menopause; Post-M: post-menopause; NA: not applicable; SE: standard error; HT: hormone therapy; SHBG: serum hormone binding globulin. | |||||
Mean age | 30.5 ± 2.1 | 62.9 ± 1.1 | 59.5 ± 1.7 | ||
Years on HT | NA | NA | 15.7 ± 2.2 | ||
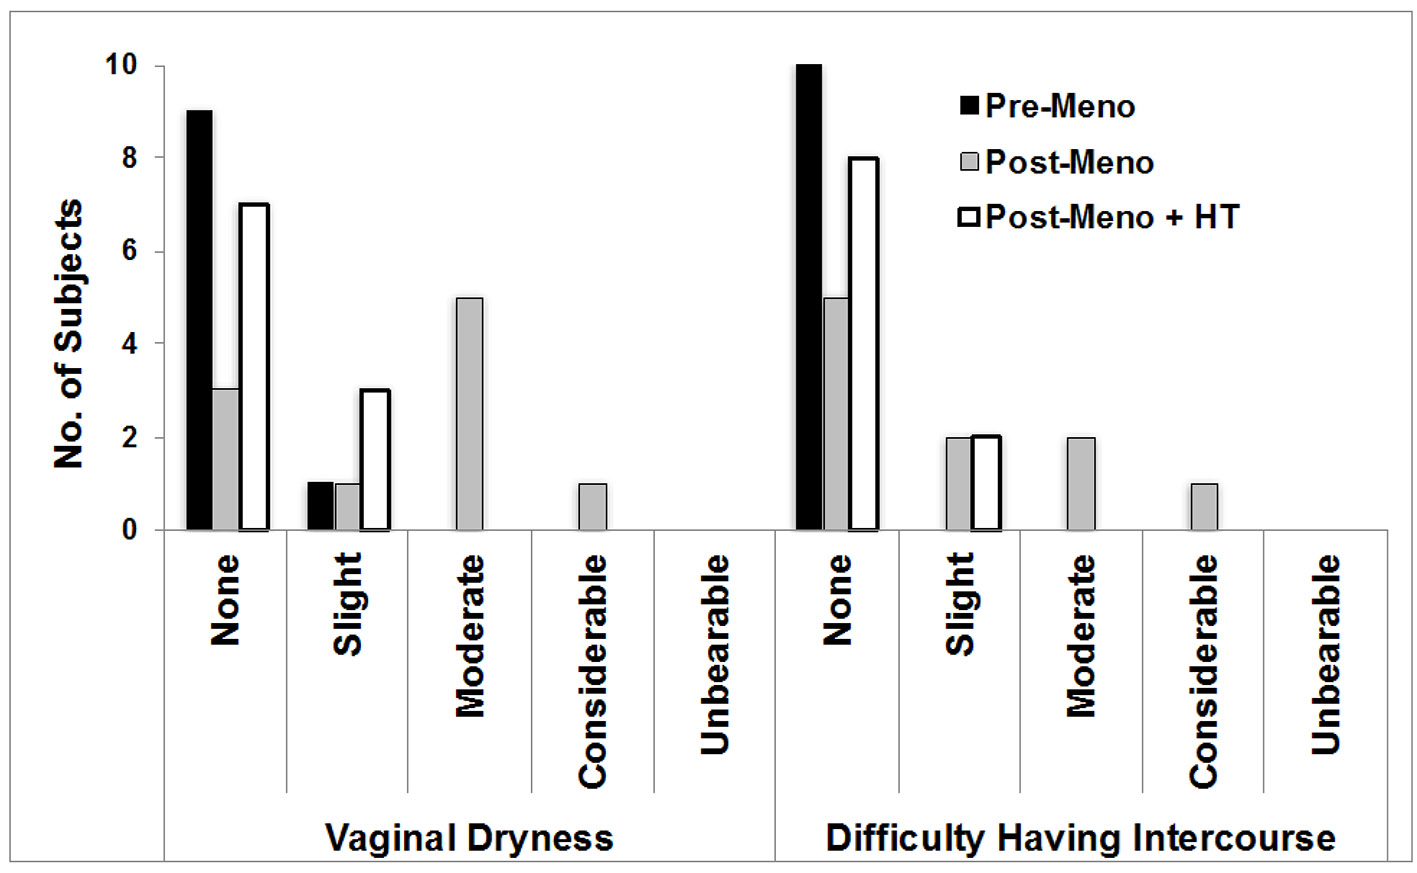
Clinical atrophy grade (0 - 10) | 0 | < 0.0001 | 8.1 ± 0.4 | < 0.0001 | 0.6 ± 0.3 |
Vaginal pH | 4.2 ± 0.1 | < 0.0002 | 5.4 ± 0.1 | < 0.0002 | 4.1 ± 0.1 |
Labial pH | 5.4 ± 0.2 | < 0.03 | 5.9 ± 0.2 | 5.55 ± 0.1 | |
Estradiol (pg/mL) | 61 ± 17 | < 0.002 | 10 ± 2 | < 0.0001 | 164 ± 58 |
SHBG (nmol/L) | 104 ± 22 | 67 ± 12 | 82 ± 16 | ||
Testosterone (ng/dL) | 30 ± 5 | 20 ± 4 | < 0.009 | 89 ± 19 |
Up-regulated in atrophic introitus | Down-regulated in atrophic introitus | ||||
---|---|---|---|---|---|
Most significant term in cluster | P value | Number of genes in cluster | Most significant term in cluster | P value | Number of genes in cluster |
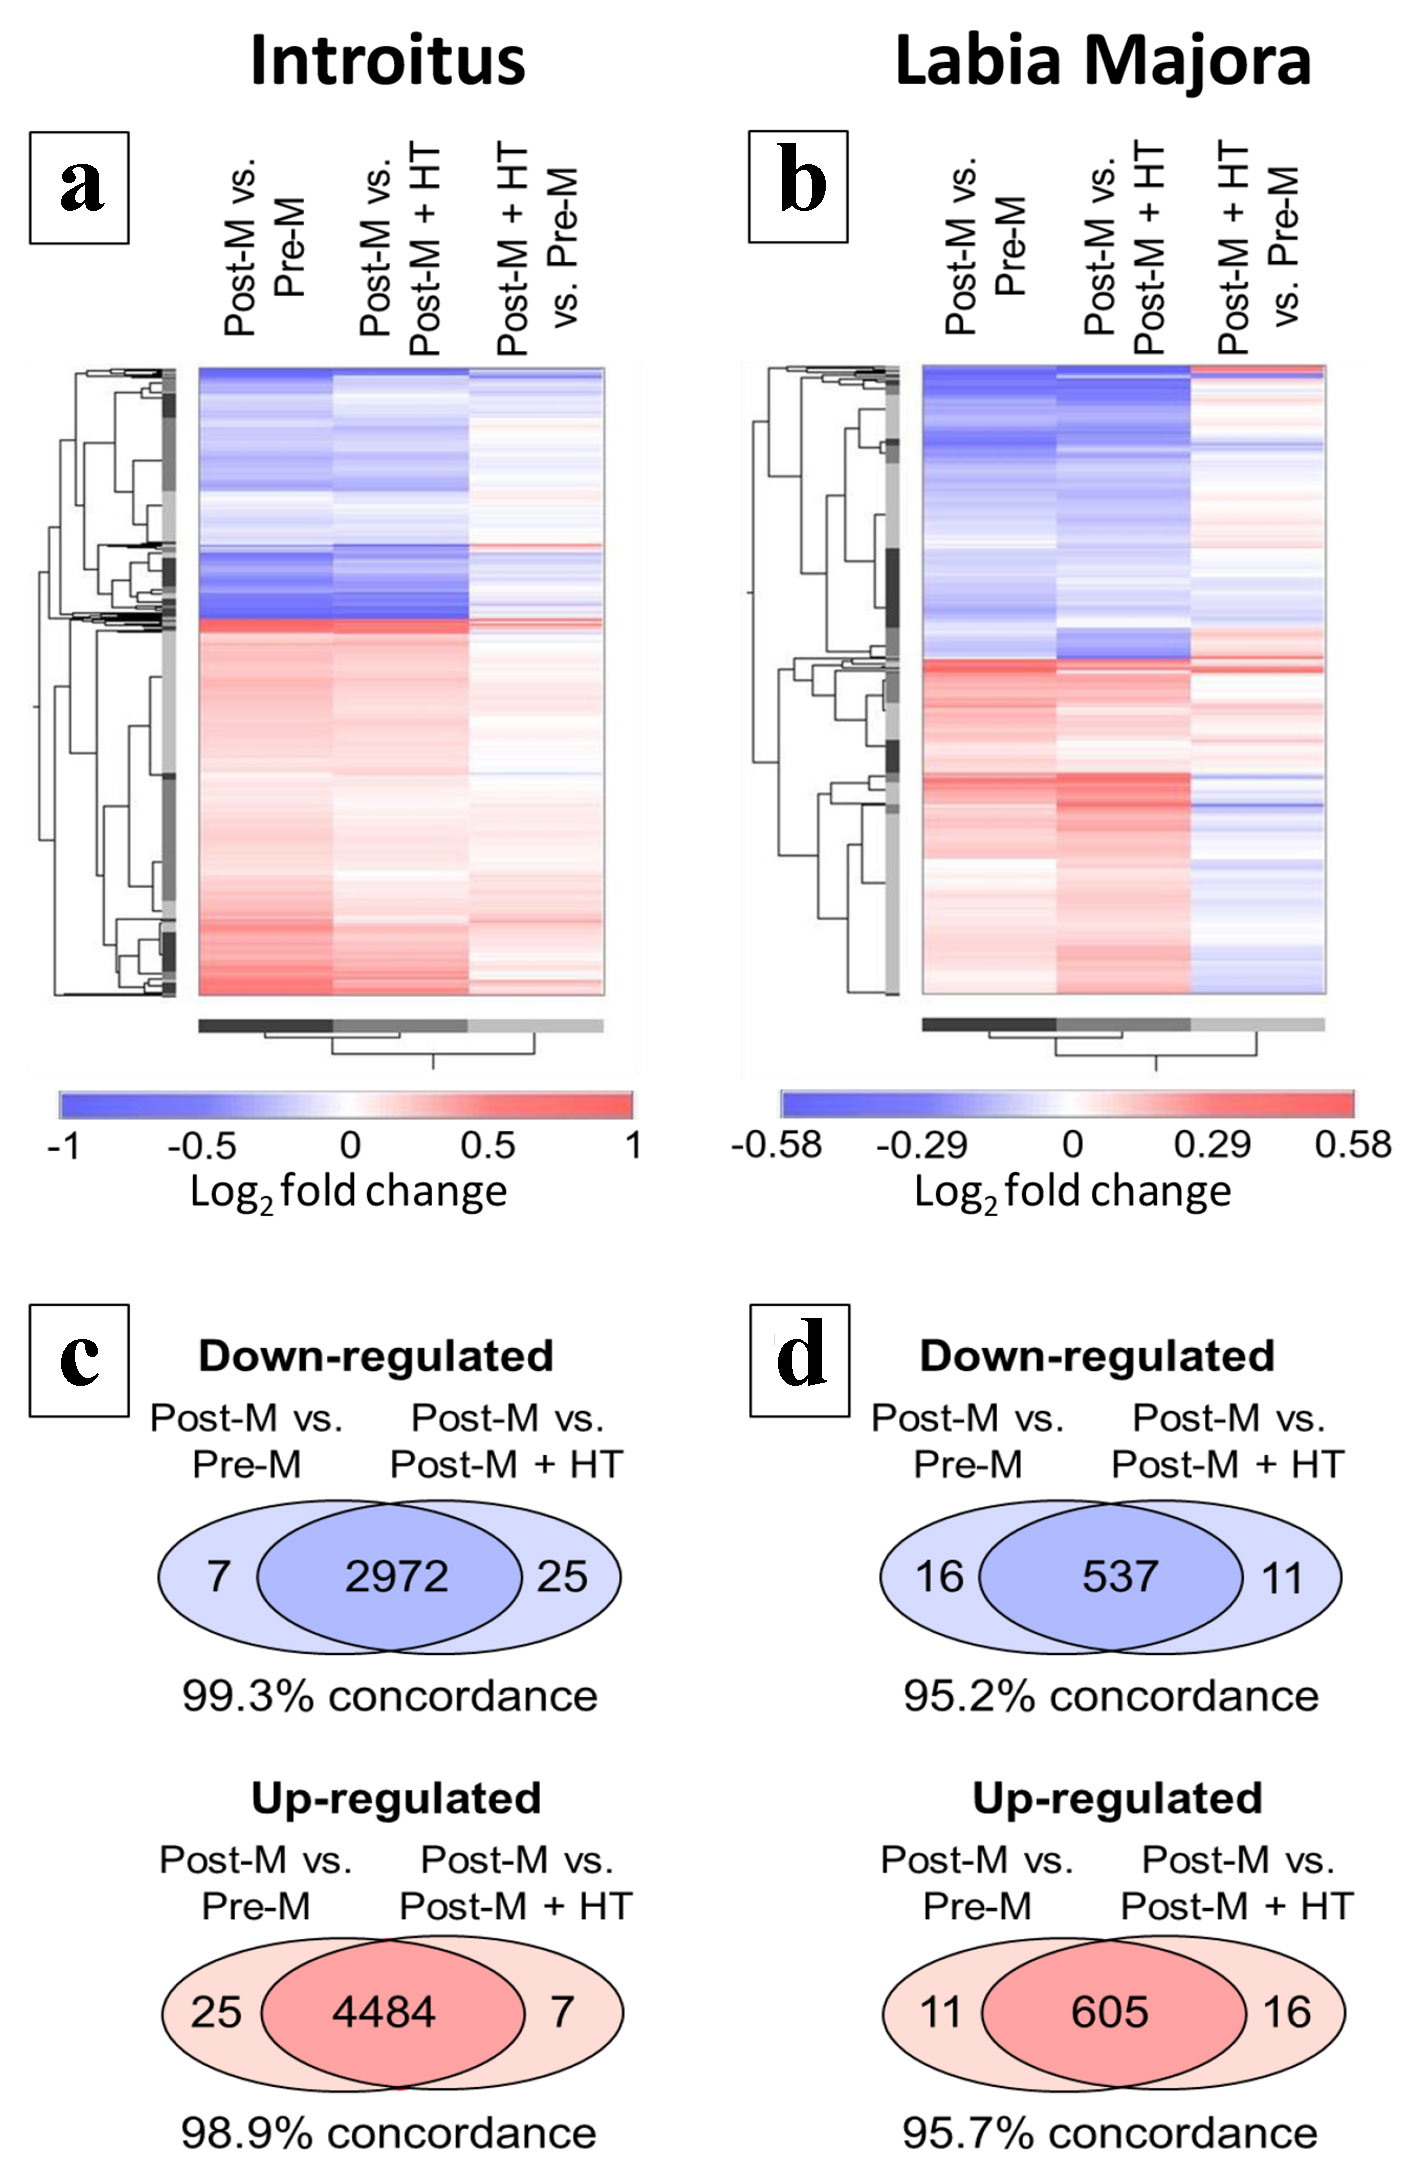
The online DAVID functional annotation clustering tool was used for GO term enrichment analysis as described in “Methods”. The probe set lists subjected to enrichment analysis were filtered as follows: Post-M vs. Pre-M introitus fold change up or down ≥ 1.2 and t-test P < 0.05 (corresponding to 1,479 up-regulated and 1,008 down-regulated genes with DAVID IDs). For conciseness only the top 6 most significant clusters are shown for the up- and down-regulated gene lists, as less significant clusters tended to have redundant terms. GO: gene ontology; Pre-M: pre-menopause; Post-M: post-menopause. | |||||
Blood vessel morphogenesis | 1.21 × 10⁻¹¹ | 56 | Epithelial cell differentiation | 9.34 × 10⁻⁹ | 50 |
Response to wounding | 4.92 × 10⁻¹¹ | 124 | Fatty acid metabolic process | 5.75 × 10⁻³ | 31 |
Cell migration | 1.07 × 10⁻⁸ | 79 | Steroid metabolic process | 1.48 × 10⁻³ | 23 |
Actin cytoskeleton organization | 1.13 × 10⁻⁹ | 64 | Hormone metabolic process | 7.23 × 10⁻³ | 15 |
Regulation of locomotion | 1.47 × 10⁻⁶ | 43 | Pyridine nucleotide metabolic process | 5.99 × 10⁻³ | 29 |
Positive regulation of immune system process | 1.07 × 10⁻⁷ | 85 | Monosaccharide metabolic process | 1.17 × 10⁻² | 25 |
Probe set ID | Gene symbol | Gene name | Fold change | ||||
---|---|---|---|---|---|---|---|
Introitus | Labia majora | ||||||
Post-M vs. Pre-M | Post-M vs. Post-M + HT | Post-M vs. Pre-M | Post-M vs. Post-M + HT | ||||
The gene list was obtained by stringently filtering the gene expression data as follows: 1) Each of the four introitus or labia majora comparisons shown were significant by t-test P < 0.01; and 2) For each of the comparisons differential gene expression was > 1.2-fold up or down. Other generally applied filtering is described in “Methods”. aDown-regulated genes. Although not used as a filtering criterion all of the genes shown were significant at q < 0.05 for the Post-M vs. Pre-M comparison. Pre-M: pre-menopause; Post-M: post-menopause; HT: hormone therapy. | |||||||
11755246_x_at | GREB1 | Growth regulating estrogen receptor binding 1a | -3.85 | -3.23 | -1.54 | -1.49 | |
11739292_at | EHF | ETS homologous factora | -1.82 | -1.59 | -1.28 | -1.23 | |
11721579_a_at | DIO2 | Iodothyronine deiodinase 2a | -1.64 | -1.85 | -1.92 | -2.17 | |
11743202_x_at | IGF1 | Insulin like growth factor 1a | -1.61 | -1.72 | -1.33 | -1.47 | |
11741132_a_at | TP63 | Tumor protein p63a | -1.54 | -1.45 | -1.27 | -1.23 | |
11755523_a_at | RBM47 | RNA binding motif protein 47a | -1.43 | -1.33 | -1.23 | -1.30 | |
11729157_a_at | MFAP4 | Microfibril associated protein 4 | 1.94 | 2.05 | 1.39 | 1.37 | |
11715393_a_at | C3 | Complement C3 | 2.94 | 3.28 | 1.61 | 1.82 |
Probe set ID | Gene symbol | Gene name | Fold change | t-test P values | ||
---|---|---|---|---|---|---|
Post-M vs. Pre-M | Post-M vs. Post-M + HT | Post-M vs. Pre-M | Post-M vs. Post-M + HT | |||
The gene list was obtained by filtering the gene expression data for probe sets meeting the following criteria: 1) Annotated with the gene ontology biological process term “collagen fibril organization”; 2) Significant by t-test at P < 0.05 for each of the comparisons; and 3) > 10% change in relative expression up or down. Other generally applied probe set filtering is described in “Methods”. aDown-regulated genes. Pre-M: pre-menopause; Post-M: post-menopause; HT: hormone therapy. | ||||||
11715415_a_at | COL3A1 | Collagen type III alpha 1 chaina | -2.22 | -2.22 | 3.48 × 10⁻² | 2.61 × 10⁻⁴ |
11746872_a_at | COL1A1 | Collagen type I alpha 1 chaina | -1.72 | -1.54 | 4.48 × 10⁻² | 6.79 × 10⁻⁴ |
11758995_at | LOX | Lysyl oxidasea | -1.45 | -1.41 | 2.06 × 10⁻³ | 1.95 × 10⁻⁴ |
11739134_a_at | COL5A2 | Collagen type V alpha 2 chaina | -1.41 | -1.43 | 2.82 × 10⁻² | 7.00 × 10⁻⁵ |
11753295_x_at | COL1A2 | Collagen type I alpha 2 chaina | -1.18 | -1.16 | 7.76 × 10⁻³ | 1.23 × 10⁻³ |
11758519_s_at | PLOD3 | Procollagen-lysine, 2-oxoglutarate 5-dioxygenase 3 | 1.34 | 1.25 | 1.74 × 10⁻³ | 1.06 × 10⁻² |
11715796_s_at | LUM | Lumican | 1.82 | 1.31 | 4.10 × 10⁻⁴ | 1.37 × 10⁻² |
11744168_at | DPT | Dermatopontin | 1.93 | 1.45 | 9.00 × 10⁻⁶ | 1.01 × 10⁻² |
11720606_a_at | SFRP2 | Secreted frizzled related protein 2 | 2.12 | 1.84 | 4.65 × 10⁻³ | 2.22 × 10⁻² |
Most significant GO term in cluster | P value | Genes in cluster(s) |
---|---|---|
Gene lists from the cross-study comparison presented in Figure 4 were subjected to GO term enrichment analysis as described in “Methods”. The table displays results for the five most highly enriched clusters of GO biological process terms for the up- or down-regulated gene lists and the P value of the most significant term for each cluster. There was substantial overlap of the genes in the first three up-regulated clusters, so they were grouped together for conciseness. GO: gene ontology. | ||
Up-regulated with atrophy | ||
Immunoglobulin mediated immune response | 1.81 × 10⁻⁴ | ACKR1, ARHGDIB, C1RL, C3AR1, CD74, CFH, CTSS, CXCL16, ENPP2, GALNT2, HLA-DMA, HLA-DPA1, HLA-DRB1, HLA-E, HRH1, INPP5D, ITPKB, LGALS3BP, MYD88, NTRK3, PRKCA, RGS1, SERPING1, SRGN, STAT5B, SWAP70, TAP2, TCIRG1, TNFRSF1A, VSIG4 |
Antigen processing and presentation | 5.11 × 10⁻³ | |
Immune effector process | 4.02 × 10⁻⁴ | |
Actin cytoskeleton organization | 1.04 × 10⁻² | ABI2, ARAP3, ARHGDIB, DAAM2, DBN1, EHD2, FGD5, LIMCH1, PACSIN2, PRR5, PTK2, SHROOM4, TLN1 |
Apoptosis | 1.67 × 10⁻² | AARS, BAG1, BCL2A1, BMF, CD74, CIB1, DPF2, DYRK2, ERCC3, GATA6, GSPT1, HIP1, HTRA2, IGFBP3, ILK, INPP5D, ITSN1, LITAF, MCF2L, MDM4, MOAP1, MYD88, NEK6, PCGF2, PRKCA, RPS27L, SETX, SLC11A2, SRGN, STAT5B, TNFRSF1A, TNFRSF21 |
Down-regulated with atrophy | ||
Epithelial cell differentiation | 3.00 × 10⁻⁴ | DHRS9, HECTD1, KAZN, LCE3D, PGR, PPL, SCEL, SHROOM3, SPRR2A, SPRR3, UPK1A |
Regulation of cellular catabolic process | 2.69 × 10⁻² | ABHD5, HIF1A, ITCH, PPP1CB, PPP1R3C, PTPN3 |
Phospholipid metabolic process | 2.32 × 10⁻² | ABHD5, AGPS, ALOX12, CMAS, CWH43, DHRS9, GPAT3, PIGN, PIK3R1, PLAA, PLD1, PRDX6, PTEN, SCD, SPTLC1 |
Cellular response to insulin stimulus | 3.48 × 10⁻² | CDKN2B, ERO1A, GAB1, GATM, GLUL, GNG12, HMOX1, KAT2B, LPIN1, ME1, NOD2, PIK3R1, PLD1, PTEN, VLDLR |
Polysaccharide biosynthetic process | 3.48 × 10⁻² | B3GNT2, CMAS, GALNT5, PPP1CB, PPP1R3C, UGDH |
Probe set identifiers | Gene symbol | Gene name | Fold change | |||
---|---|---|---|---|---|---|
Introitus | Vagina | |||||
HG-U219 | HG-U133 Plus 2.0 | Post-M vs. Pre-M | Post-M vs. Post-M + HT | Control vs. ET | ||
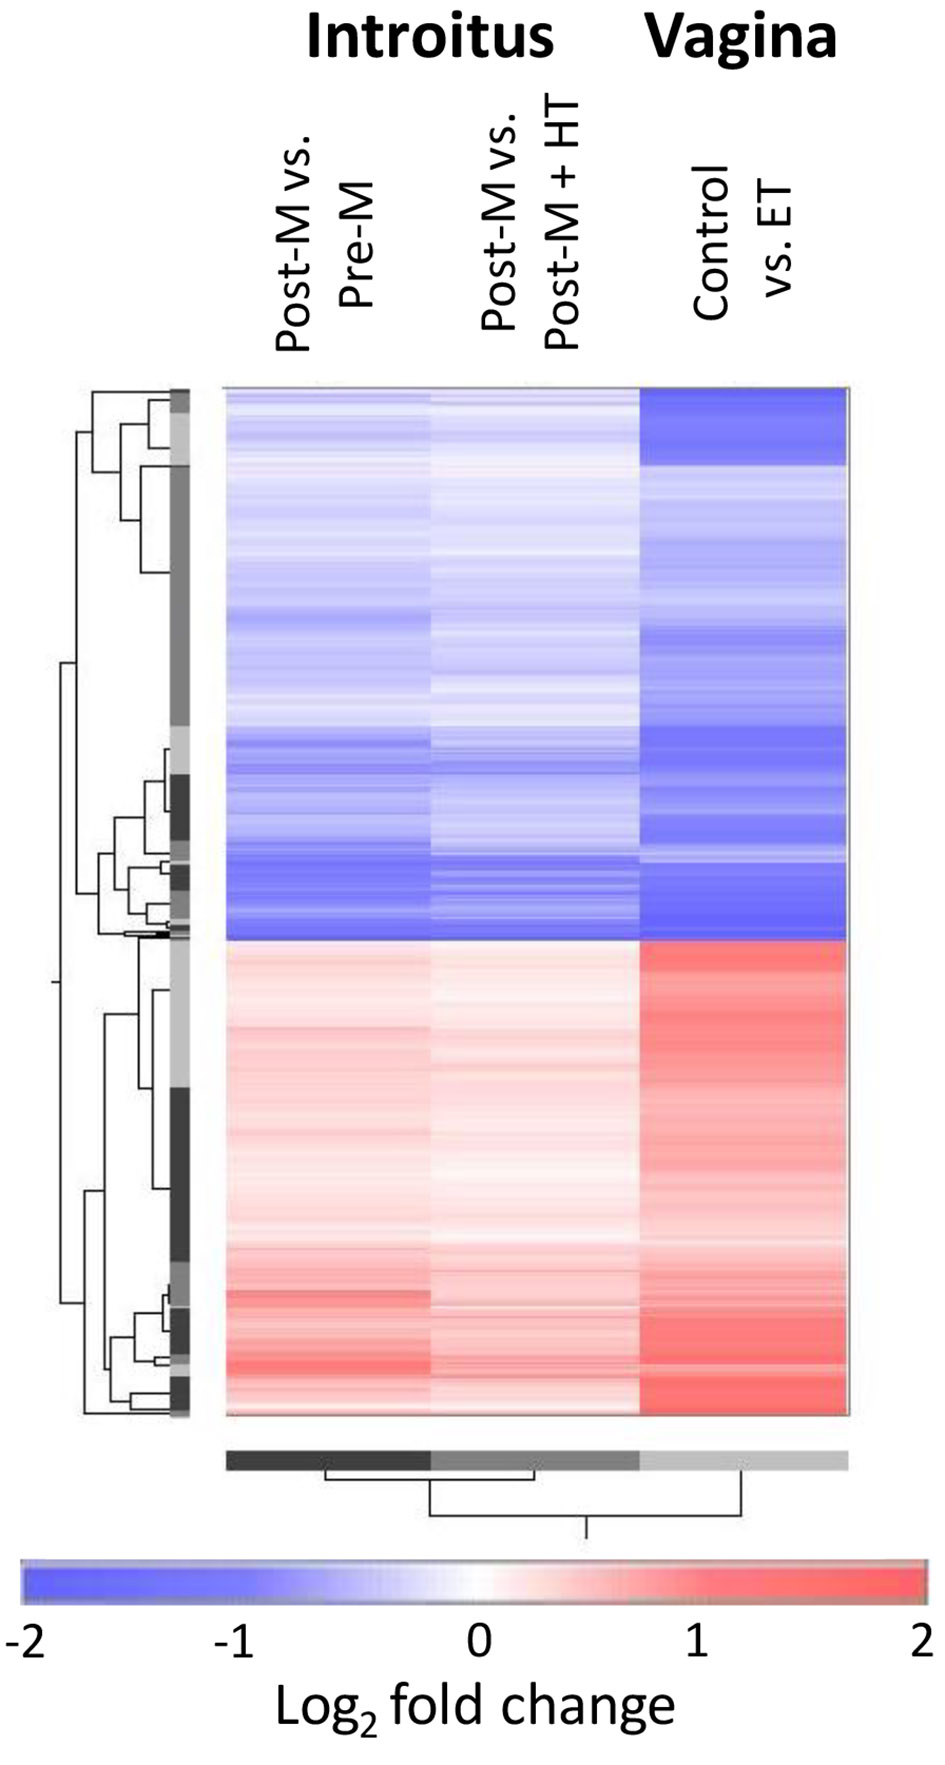
These gene expression data were filtered for transcripts with q < 0.05 for the introitus Post-M to Pre-M comparison and then the 10 most down- and up-regulated transcripts were selected. Other filtering is described in “Methods”. aDown-regulated genes. bUp-regulated genes. The results for the introitus Post-M vs. Post-M + HT and the vagina baseline vs. ET (from reprocessed published data [11, 12]) are also shown and colored if P values < 0.05. Pre-M: pre-menopause; Post-M: post-menopause; HT: hormone therapy. | ||||||
11737529_a_at | 1553454_at | RPTN | Repetina | -4.55 | -4.17 | -3.03 |
11738277_a_at | 1554914_at | PLA2G4D | Phospholipase A2 group IVDa | -4 | -3.13 | -4.35 |
11715242_s_at | 224328_s_at | LCE3D | Late cornified envelope 3Da | -4 | -2.86 | -4.35 |
11755246_x_at | 205862_at | GREB1 | Growth regulating estrogen receptor binding 1a | -3.85 | -3.23 | -3.03 |
11741457_a_at | 207206_s_at | ALOX12 | Arachidonate 12-lipoxygenase, 12S typea | -3.57 | -2.44 | -4.55 |
11742174_x_at | None | LCE3E | Late cornified envelope 3Ea | -3.45 | -2.7 | |
11725309_at | 207802_at | CRISP3 | Cysteine-rich secretory protein 3a | -3.33 | -2.56 | -2.86 |
11744555_at | 210272_at | CYP2B7P | Cytochrome P450 family 2 subfamily B member 7, pseudogenea | -2.94 | -2.04 | -3.13 |
11726168_at | 228554_at | PGR | Progesterone receptora | -2.86 | -2.56 | -2.17 |
11748025_s_at | 223278_at | GJB2 | Gap junction protein beta 2a | -2.7 | -2.56 | -1.79 |
11717123_a_at | 201957_at | PPP1R12B | Protein phosphatase 1 regulatory subunit 12Bb | 2.56 | 2.12 | 2.26 |
11755106_a_at | 209621_s_at | PDLIM3 | PDZ and LIM domain 3b | 2.58 | 2.27 | 1.74 |
11757425_s_at | 203868_s_at | VCAM1 | Vascular cell adhesion molecule 1b | 2.59 | 1.87 | 1.65 |
11716203_a_at | 202291_s_at | MGP | Matrix Gla proteinb | 2.65 | 1.8 | 1.77 |
11725584_at | 223541_at | HAS3 | Hyaluronan synthase 3b | 2.82 | 1.77 | 2.05 |
11722995_at | 209613_s_at | ADH1B | Alcohol dehydrogenase 1B (class I), beta polypeptideb | 2.9 | 2.36 | 1.83 |
11719671_a_at | 203498_at | RCAN2 | Regulator of calcineurin 2b | 2.94 | 1.97 | 1.07 |
11756003_x_at | 202409_at | IGF2 | Insulin like growth factor 2b | 2.97 | 1.51 | 1.76 |
11718904_s_at | 204135_at | FILIP1L | Filamin A interacting protein 1 likeb | 2.97 | 2.14 | 1.4 |
11715280_s_at | 205157_s_at | KRT17 | Keratin 17b | 4.29 | 1.46 | 1.22 |