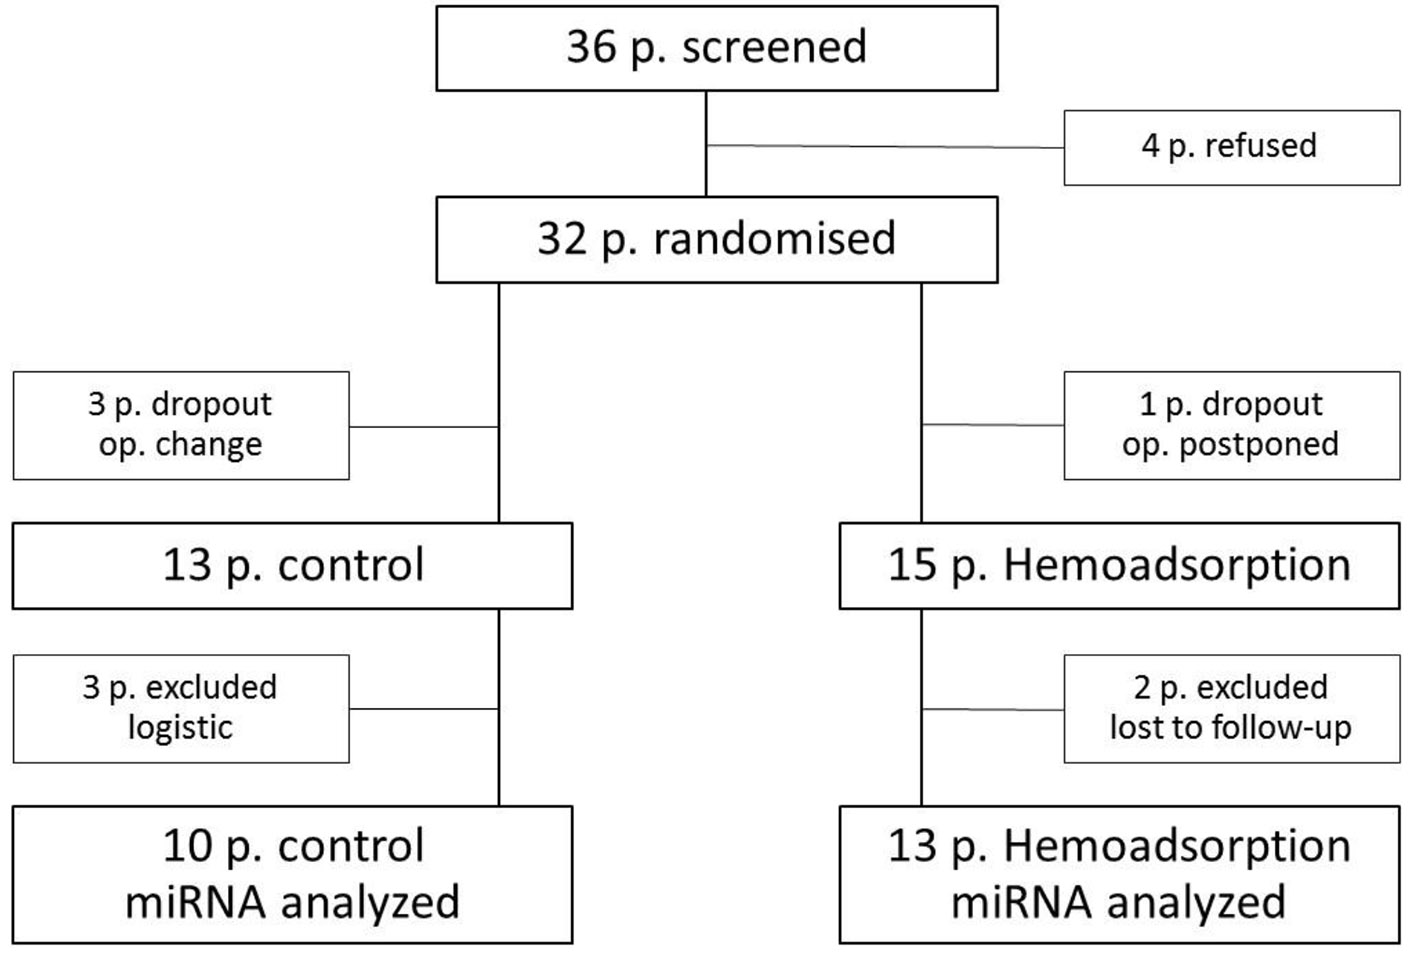
Figure 1. Flow diagram.
| Journal of Clinical Medicine Research, ISSN 1918-3003 print, 1918-3011 online, Open Access |
| Article copyright, the authors; Journal compilation copyright, J Clin Med Res and Elmer Press Inc |
| Journal website http://www.jocmr.org |
Original Article
Volume 11, Number 12, December 2019, pages 789-797
Plasma Levels of Myocardial MicroRNA-133a Increase by Intraoperative Cytokine Hemoadsorption in the Complex Cardiovascular Operation
Figures
Tables
| HA (n = 15) | Control (n = 13) | P-value | |
|---|---|---|---|
| Values are presented as the number (n), percentage (%) or median (min.; max.). P values indicating statistical significance were calculated using a t-test for continuous variables and a Mann-Whitney U-test for categorical variables. HA: hemoadsorption; BMI: body mass index; NYHA: New York Heart Association classification of heart failure; Euroscore: classification of early (1 month) mortality; LVEF: left ventricle ejection fraction; ACE: angiotensin-converting-enzyme. Bypass time: duration of the extracorporeal circulation; Aortic clamp time: duration of cardioplegic ischemic arrest. | |||
| Preoperative characteristics | |||
| Age (years) | 50 ± 10 | 54 ± 15 | 0.526 |
| Female | 2 | 0 | 0.206 |
| Male | 13 | 13 | 0.26 |
| BMI | 30.5 ± 3.6 | 27.7 ± 3.8 | 0.065 |
| NYHA classification | 1 (1; 2) | 2 (1; 2) | 0.956 |
| Euroscore II. | 4.2 ± 2.1 | 4.1 ± 1.9 | 0.907 |
| Previous myocardial infarction | 0 | 2 | 0.484 |
| Peripheral venous disease | 1 | 0 | 0.464 |
| Hypertension | 3 | 2 | 0.491 |
| Diabetes | 1 | 4 | 0.333 |
| Hypercholesterolemia | 4 | 3 | 0.498 |
| LVEF total (%) | 52.9 ± 13.9 | 58.6 ± 7.2 | 0.218 |
| 30-40% | 1 | 1 | 1 |
| 40-50% | 2 | 0 | 0.206 |
| More than 50% | 10 | 14 | 0.153 |
| Drug history | |||
| ACE inhibitors | 4 | 7 | 0.46 |
| Beta-blockers | 3 | 2 | 0.491 |
| Statins | 5 | 6 | 1 |
| Insulin | 0 | 1 | 1 |
| Sulphonylurea | 1 | 2 | 1 |
| Intraoperative characteristics | |||
| Ross operation (abs/%) | 14 (93) | 13 (93) | 1 |
| David operation (abs/%) | 1 (7) | 1 (7) | 1 |
| Bypass time (min) | 198 ± 15 | 182 ± 44 | 0.69 |
| Aortic clamp time (min) | 132 ± 18 | 134 ± 25 | 0.846 |
| Group | T | miRNA-23b right atrium | P1 | P2 | miRNA-1 right atrium | P1 | P2 | miRNA-1 blood | P1 | P2 | miRNA-133a blood | P1 | P2 | miRNA-223 blood | P1 | P2 | miRNA-126 blood | P1 | P2 |
|---|---|---|---|---|---|---|---|---|---|---|---|---|---|---|---|---|---|---|---|
| The data are presented as median (min.; max). P1: Comparisons of continuous parameters between groups were computed using a Mann-Whitney U-test. P2: A Wilcoxon paired test was used to assess the significance of time related changes within groups. Plasma and tissue miRNA levels were presented as the fold-change relative to T1 (preoperative value), defined as 1,0. Statistically significant differences are indicated by an asterisk (*) between groups and a hash tag (#) within groups. HA: hemoadsorption group. T1: after induction of anesthesia; T2: 3 h; T3: 6 h; T4: 18 h; T5: 42 h after myocardial reperfusion. | |||||||||||||||||||
| HA | 1 | 1 | 1 | 1 | 1 | 1 | 1 | 1 | 1 | ||||||||||
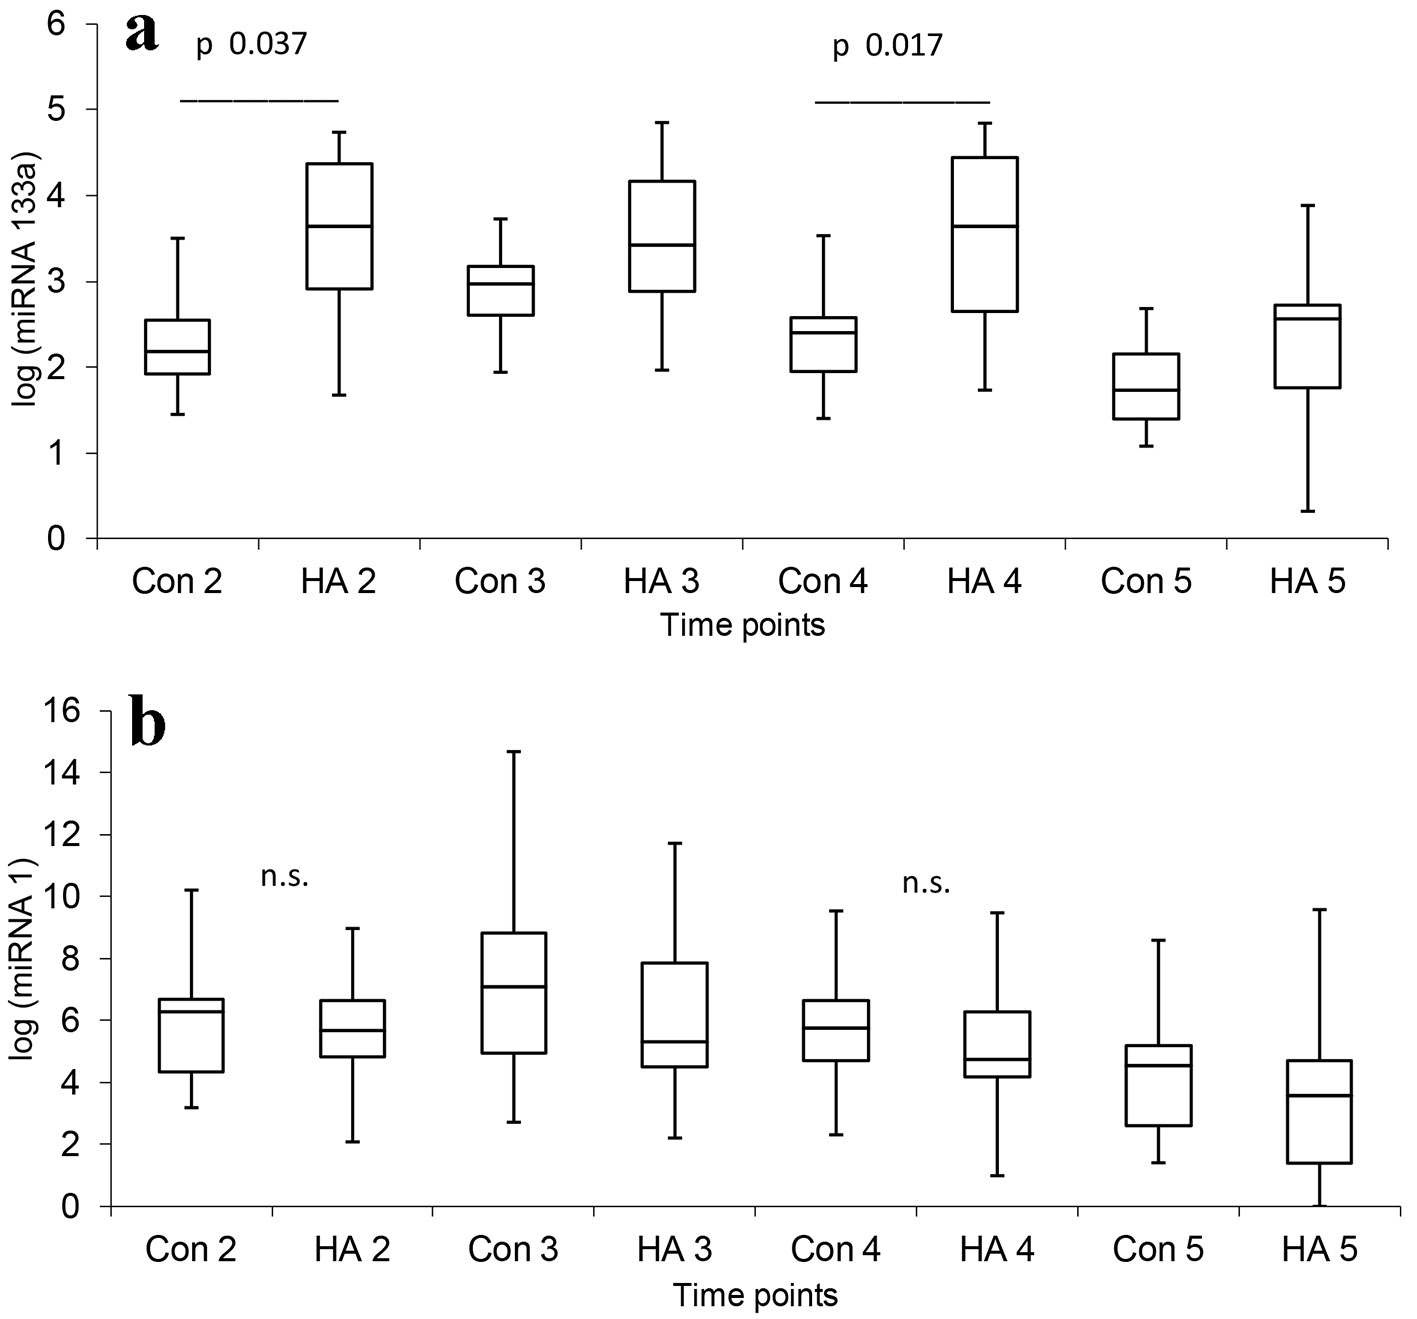
| 2 | 1.081 (0.437; 14.432) | 0.243 | 0.422 | 1.126 (0.824; 1.821) | 0.821 | 0.075 | 24.022 (0.374; 625) | 0.50 | 0.013# | 63.135 (0.684; 790.322) | 0.037* | 0.004# | 0.684 (0.298; 10.491) | 0.271 | 0.552 | 0.925 (0.446; 23.136) | 0.077 | 0.65 | |
| 3 | 16.105 (0.723; 9,753) | 0.451 | 0.004# | 38.315 (1.338; 1,024) | 0.135 | 0.003# | 1.25 (0.375; 47.266) | 0.105 | 0.239 | 0.951 (0.468; 35.055) | 0.316 | 0.308 | |||||||
| 4 | 9.413 (0.116; 6,323) | 0.369 | 0.013# | 62.938 (0.783; 1,008) | 0.017* | 0.004# | 2.143 (0.561; 10.337) | 0.57 | 0.005# | 0.727 (0.269; 4.018) | 0.443 | 0.875 | |||||||
| 5 | 4.265 (0.08; 1,148) | 0.414 | 0.116 | 5.215 (0.014; 110.887) | 0.214 | 0.028# | 1.987 (0.555; 9.282) | 0.67 | 0.01# | 0.631 (0.006; 3.298) | 0.877 | 0.182 | |||||||
| Control | 1 | 1 | 1 | 1 | 1 | 1 | 1 | 1 | 1 | ||||||||||
| 2 | 0.778 (0.144; 2.889) | 0.888 | 1.180 (0.737; 2.683) | 116 | 45.87 (1.926; 39,471) | 0.012# | 2.24 (0.408; 71.073) | 0.036# | 0.645 (0.194; 1.265) | 0.036# | 0.435 (0.263; 2.911) | 0.214 | |||||||
| 3 | 101.264 (1.203; 905,424) | 0.018# | 13.681 (1.234; 77.345) | 0.018# | 0.561 (0.140; 1.725) | 0.398 | 0.62 (0.186; 2.287) | 0.208 | |||||||||||
| 4 | 24.759 (0.802; 1,041,863) | 0.017# | 3.786 (0.366; 62.938) | 0.036# | 2.082 (0.728; 4.415) | 0.036# | 0.551 (0.169; 2.949) | 0.327 | |||||||||||
| 5 | 7.412 (0.08; 1,148) | 0.049# | 0.811 (0.174; 6.980) | 0.779 | 3.16 (0.430; 16.599) | 0.025# | 0.619 (0.270; 6.137) | 0.208 | |||||||||||
| Postoperative characteristics | HA (n = 15) | Control (n = 13) | P-value |
|---|---|---|---|
| Values are presented as number (abs), percentage (%), median (min.; max). 3-1 dif: the difference between T3 and T1. Laboratory data are compared between the groups as the difference between the peek value (T3) and the preoperative value (T1). The listed P values of statistical tests were calculated by using Mann-Whitney U-test. HA: hemoadsorption; Neutrophil-SFL (septic marker): the fluorescent light intensity of the neutrophil area on the white blood cell differential scattergram; CRP: C-reactive protein; ICU: intensive care unit; MoCA: Montreal cognitive assessement; PCT: procalcitonin. | |||
| Platelets, g/L (3-1 diff) | -31 (-21 - 60) | -29 (-74 - 87) | 0.983 |
| Leukocytes, g/L (3-1 diff) | 6.7 (2 - 14.9) | 3.6 (1.5 - 13.9) | 0.34 |
| Neutrophils, g/L (3-1 diff) | 4.6 (2.5 - 13.8) | 4 (1.9 - 14.3) | 0.389 |
| Immature granulocyt, g/L (3-1 diff) | 0.04 (0 - 0.10) | 0.03 (0.01 - 0.13) | 0.576 |
| Neutrophil-SFL, ch (3-1 dif) | 4.6 (2.3 - 7.2) | 5.5 (-25 - 7) | 0.389 |
| Free Hb, g/L (2-1 dif) | 383 (181 - 463) | 369 (172 - 477) | 0.599 |
| C-reactive protein, mg/L (3-1 dif) | 163 (41 - 326) | 169 (92 - 251) | 0.747 |
| PCT, µg/L (3-1 dif) | 0.3 (0.1 - 1) | 0.63 (0.1 - 1.1) | 0.062 |
| Fibrinogen, g/L (3-1 dif) | 0.9 (0.4 - 1.9) | 1 (0.2 - 1.8) | 0.631 |
| Blood loss (mL) | 420 (260; 1,200) | 440 (280; 1,330) | 0.504 |
| Extubation (h) | 4 (2; 10) | 5 (3; 8) | 0.176 |
| Length of stay in ICU (days) | 2 (1; 3) | 3 (1; 4) | 0.085 |
| Hospitalization time (days) | 9 (7; 14) | 8 (7; 15) | 0.419 |
| MoCA (preoperation - discharge dif.) | 1 (-2; 5) | 1 (-3; 5) | 0.817 |
| Postoperation delirium (abs./%) | 0 | 2 (14) | 0.224 |
| Atrial fibrilation (abs/%) | 4 (27) | 3 (20) | 0.682 |
| Vasopresors (abs/%) | 4 (27) | 3 (20) | 0.682 |
| Inotropics (abs/%) | 4 (27) | 4 (29) | 0.977 |
| Wound infection (abs/%) | 1 (7) | 2 (14) | 0.598 |
| Mortality (3 months) | 0 | 0 | |