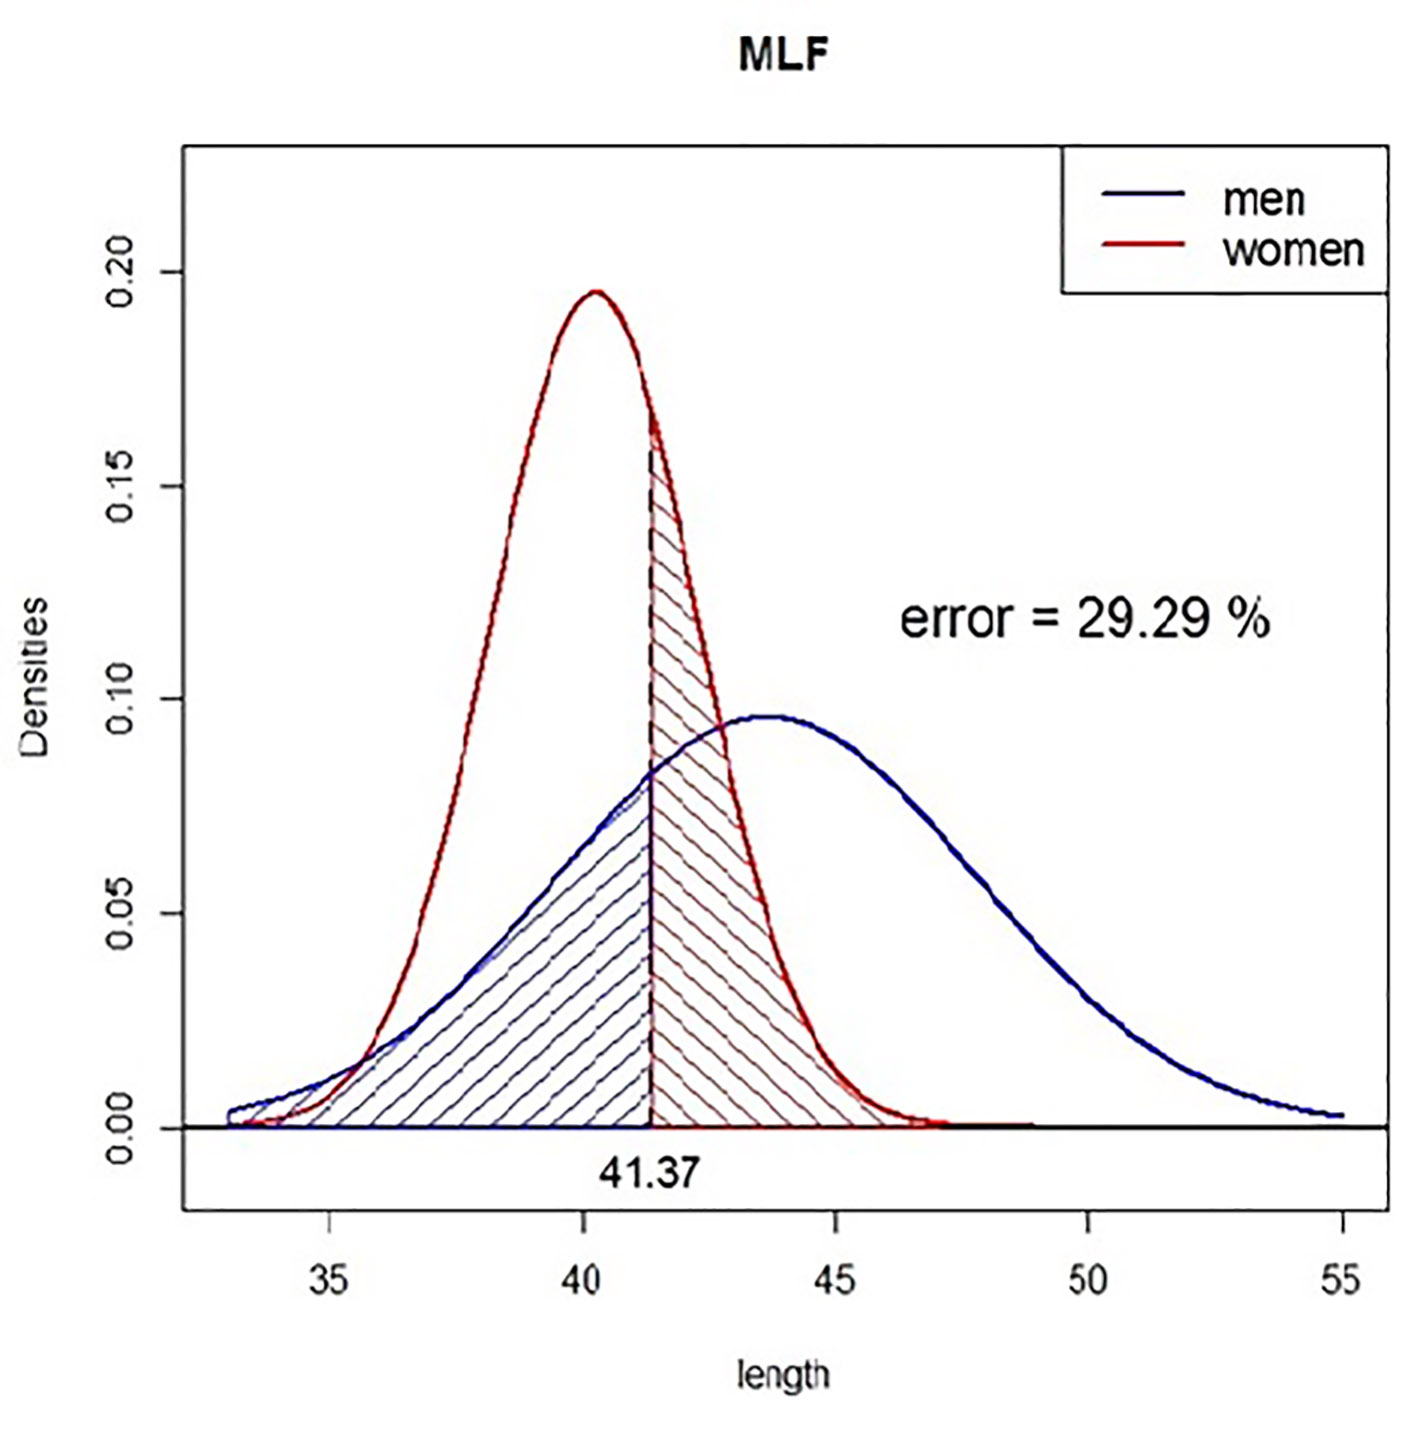
Figure 1. The normal distribution curves for the maximal length of the femur (MLF). The blue represents the male and the red represents the female. Decision point is 41.37 and the error is 29.29% for sex estimation.
| Journal of Clinical Medicine Research, ISSN 1918-3003 print, 1918-3011 online, Open Access |
| Article copyright, the authors; Journal compilation copyright, J Clin Med Res and Elmer Press Inc |
| Journal website http://www.jocmr.org |
Original Article
Volume 11, Number 11, November 2019, pages 740-744
Α Rare Morphological Study Concerning the Longest Bone of the Human Anatomy in the Population of the Northern Greece
Figures
Tables
| Femur | Males | Females | ||||||||
|---|---|---|---|---|---|---|---|---|---|---|
| N | µ (cm) | SD (cm) | Max. (cm) | Min. (cm) | N | µ (cm) | SD (cm) | Max. (cm) | Min. (cm) | |
| N represents the number of the specimens that were examined, µ represents the mean value. The unit values are in centimeters. SD: standard deviation; MLF: maximal length of the femur; NLF: natural length of the femur; GTH: distance between the greater trochanter and head; GLT: distance between the greater and lesser trochanters; VDH: vertical diameter of the head; PMF: perimeter in the middle of the femur body; DLM: distance of lateral and medial between the outermost extremities of the two condyles of the femur. | ||||||||||
| MLF | 238 | 43.638 | 4.168 | 50.5 | 38.4 | 205 | 40.253 | 2.045 | 45.2 | 35.0 |
| NLF | 224 | 41.978 | 3.798 | 48.3 | 30.08 | 193 | 38.844 | 2.050 | 45.6 | 34.1 |
| GTH | 227 | 9.783 | 0.812 | 11.3 | 8.4 | 190 | 8.775 | 0.516 | 10.3 | 7.9 |
| GLT | 225 | 6.722 | 0.747 | 9.8 | 5.2 | 187 | 5.988 | 0.530 | 7.6 | 4.8 |
| VDH | 219 | 4.758 | 0.282 | 5.5 | 4.0 | 181 | 4.201 | 0.242 | 4.9 | 3.4 |
| PMF | 194 | 9.001 | 0.998 | 11.6 | 8.0 | 172 | 8.252 | 0.685 | 10.5 | 6.9 |
| DLM | 233 | 8.200 | 0.853 | 10.3 | 6.0 | 200 | 7.406 | 0.469 | 8.8 | 5.1 |
| Index | Males | Females | ||||||||
|---|---|---|---|---|---|---|---|---|---|---|
| N | µ (cm) | SD (cm) | Max. (cm) | Min. (cm) | N | µ (cm) | SD (cm) | Max. (cm) | Min. (cm) | |
| N represents the number of the specimens that were examined. µ represents the mean value. SD: standard deviation; IRF 1: index of robustness of the femur 1; IRF 2: index of robustness of the femur 2. | ||||||||||
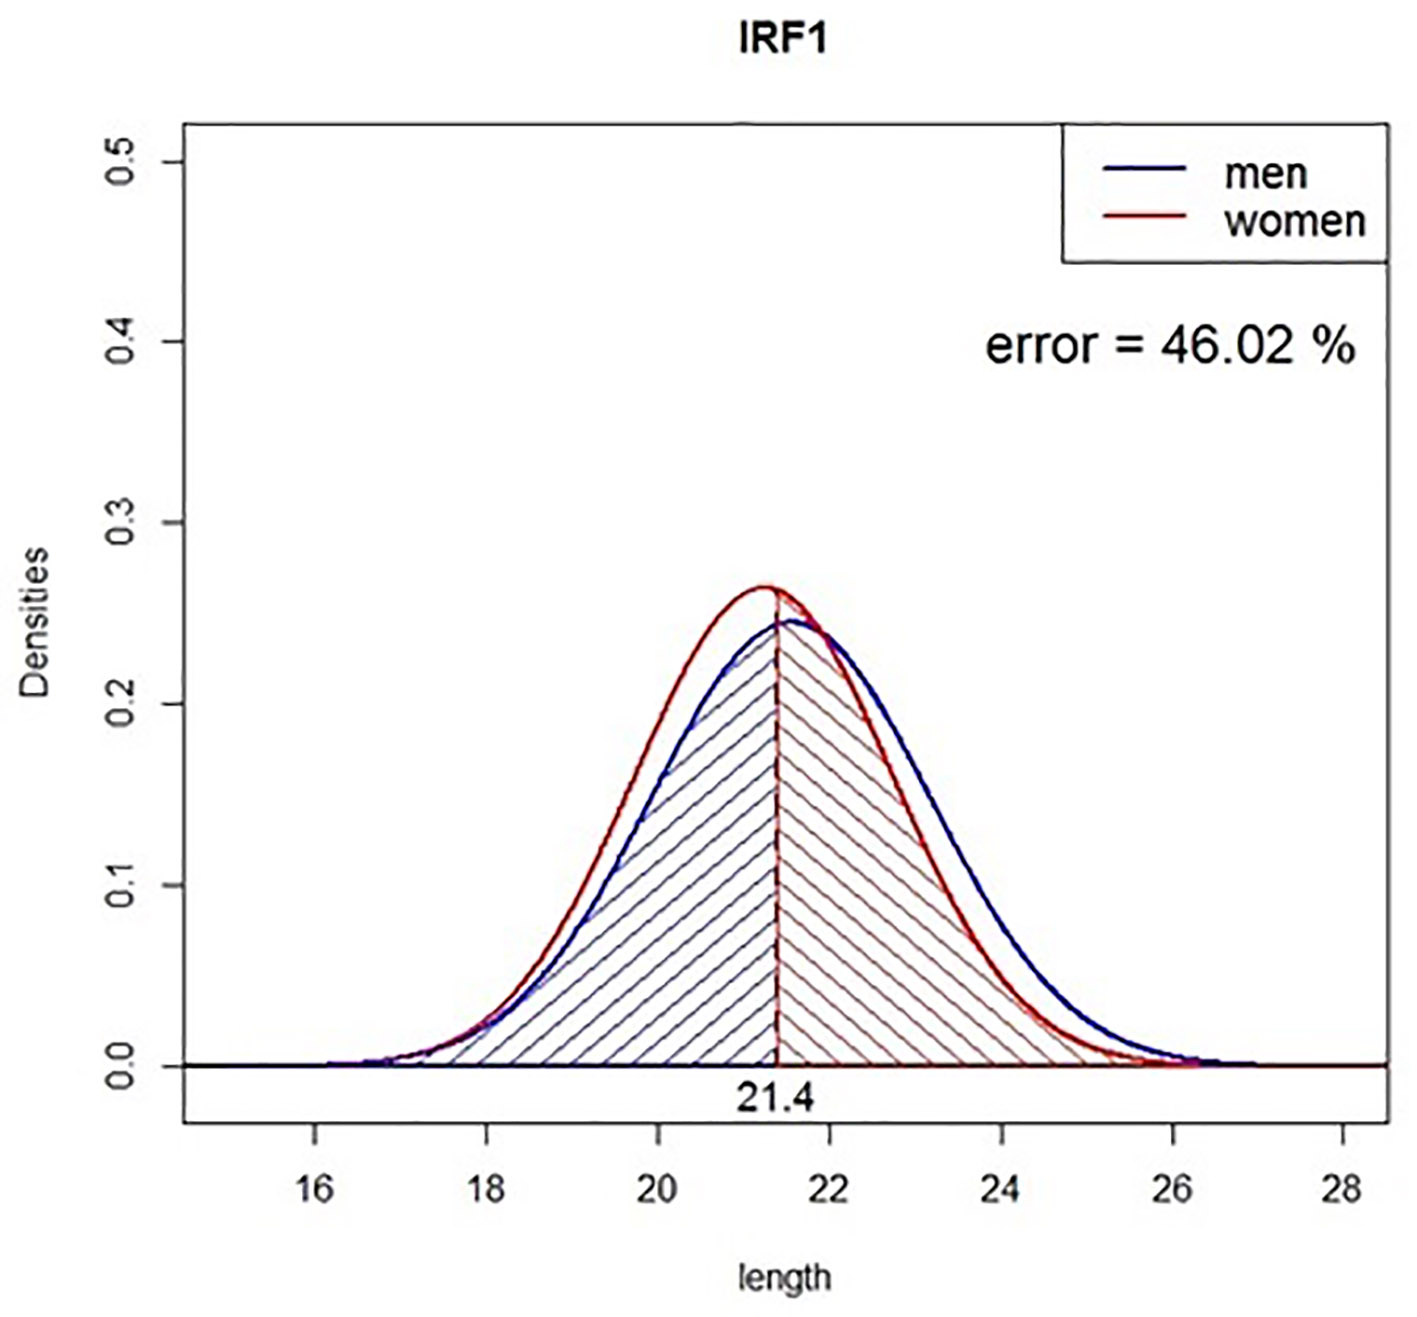
| IRF 1 | 181 | 21.559 | 1.627 | 31.8 | 14.1 | 160 | 21.246 | 1.509 | 24.8 | 18.5 |
| IRF 2 | 188 | 20.658 | 1.452 | 26.1 | 13.3 | 167 | 20.522 | 1.537 | 24.1 | 16.5 |
| Point of decision (cm) | Error | |
|---|---|---|
| MLF: maximal length of the femur; NLF: natural length of the femur; GTH: distance between the greater trochanter and head; GLT: distance between the greater and lesser trochanters; VDH: vertical diameter of the head; PMF: perimeter in the middle of the femur body; DLM: distance of lateral and medial between the outermost extremities of the two condyles of the femur. | ||
| MLF | 41.37 | 29.29% |
| NLF | 39.94 | 29.60% |
| GTH | 9.17 | 22.39% |
| GLT | 6.29 | 28.27% |
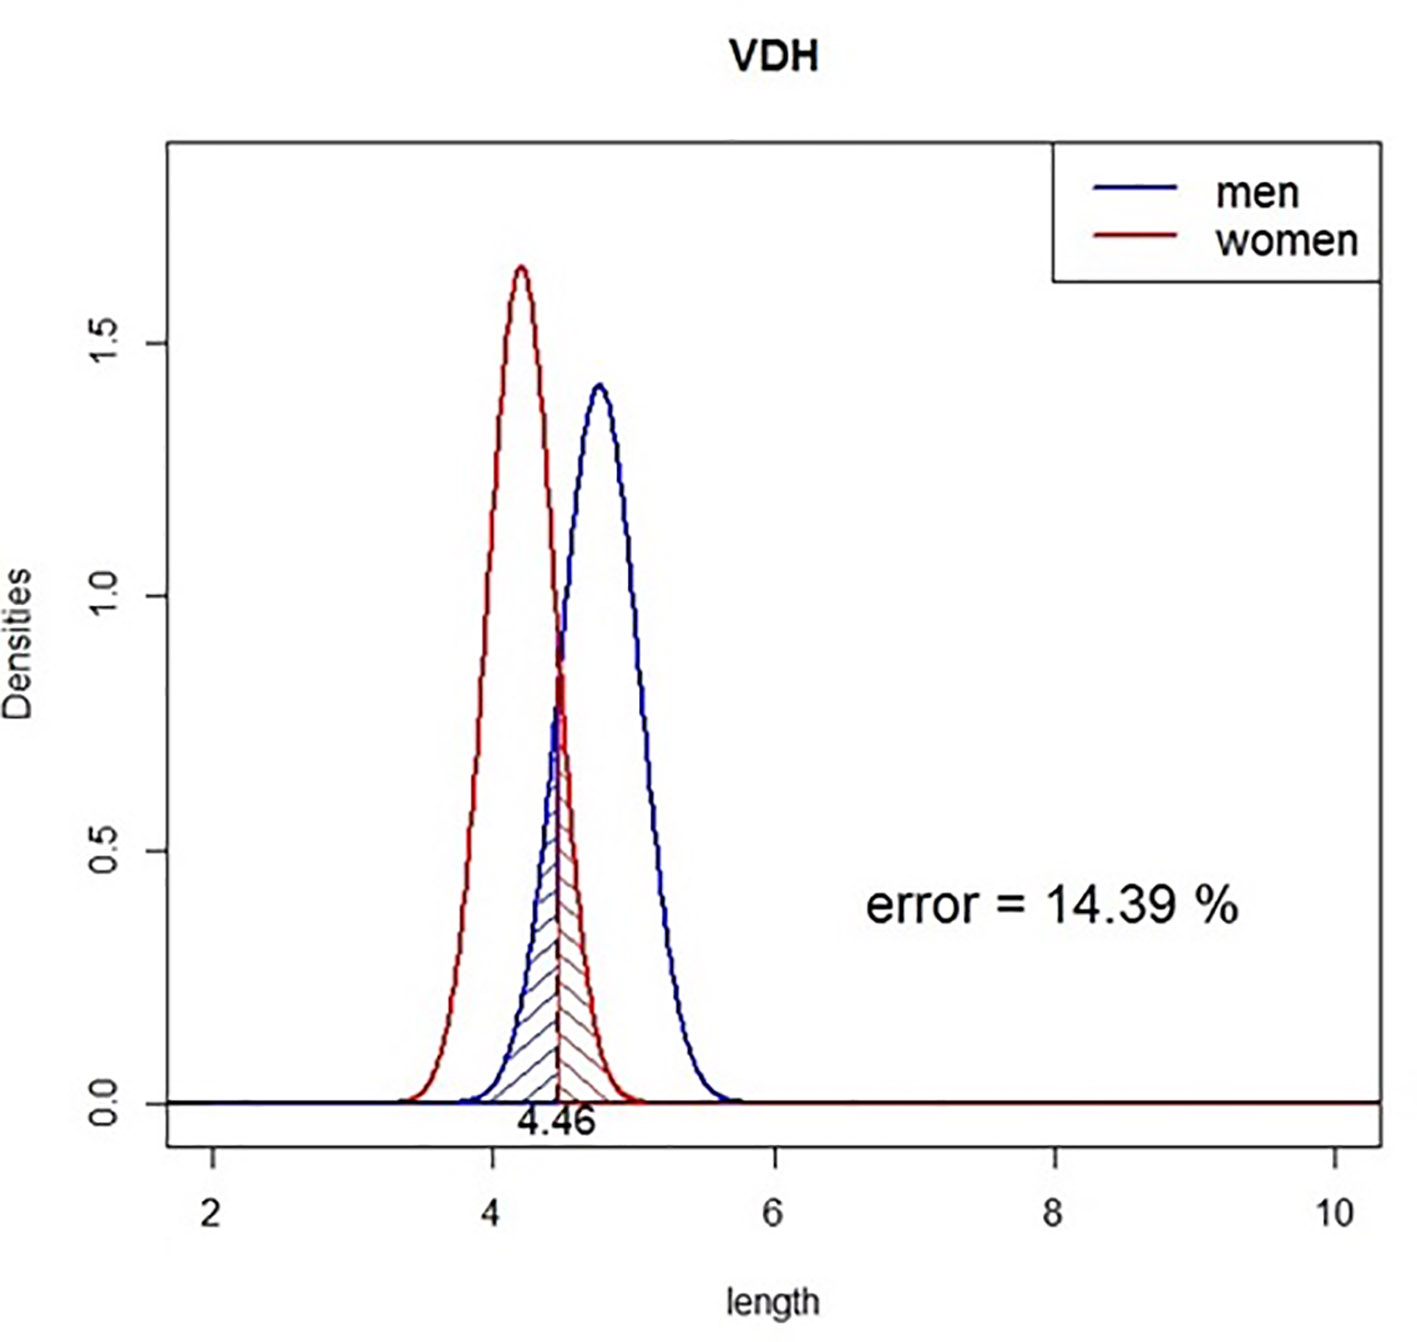
| VDH | 4.46 | 14.39% |
| PMF | 8.56 | 32.81% |
| DLM | 7.69 | 27.41% |