Figures
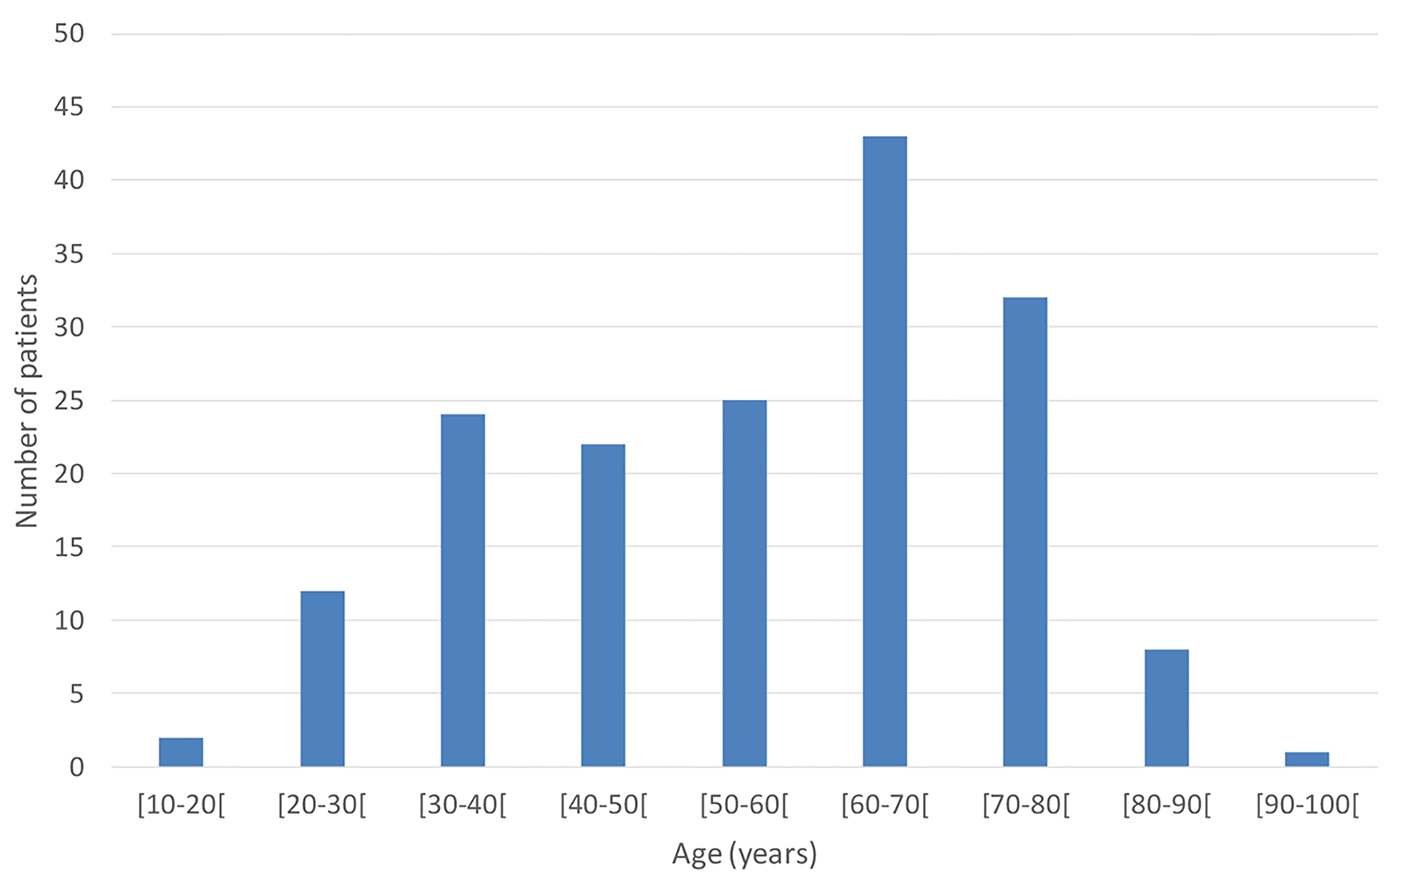
Figure 1. Age distribution of patients with esophageal achalasia.
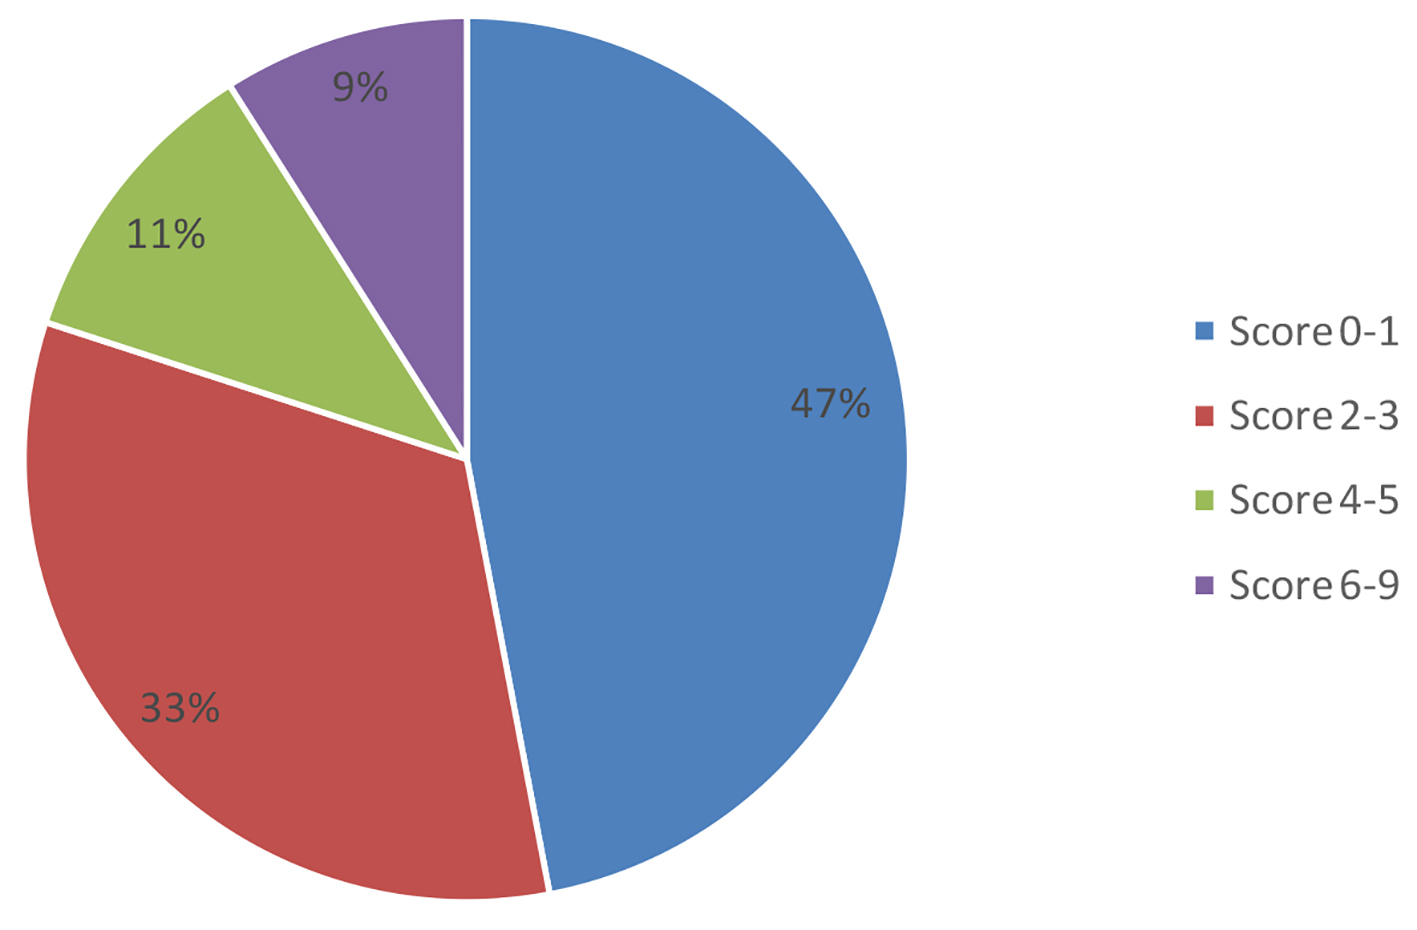
Figure 2. Eckardt score distribution after treatment of esophageal achalasia.
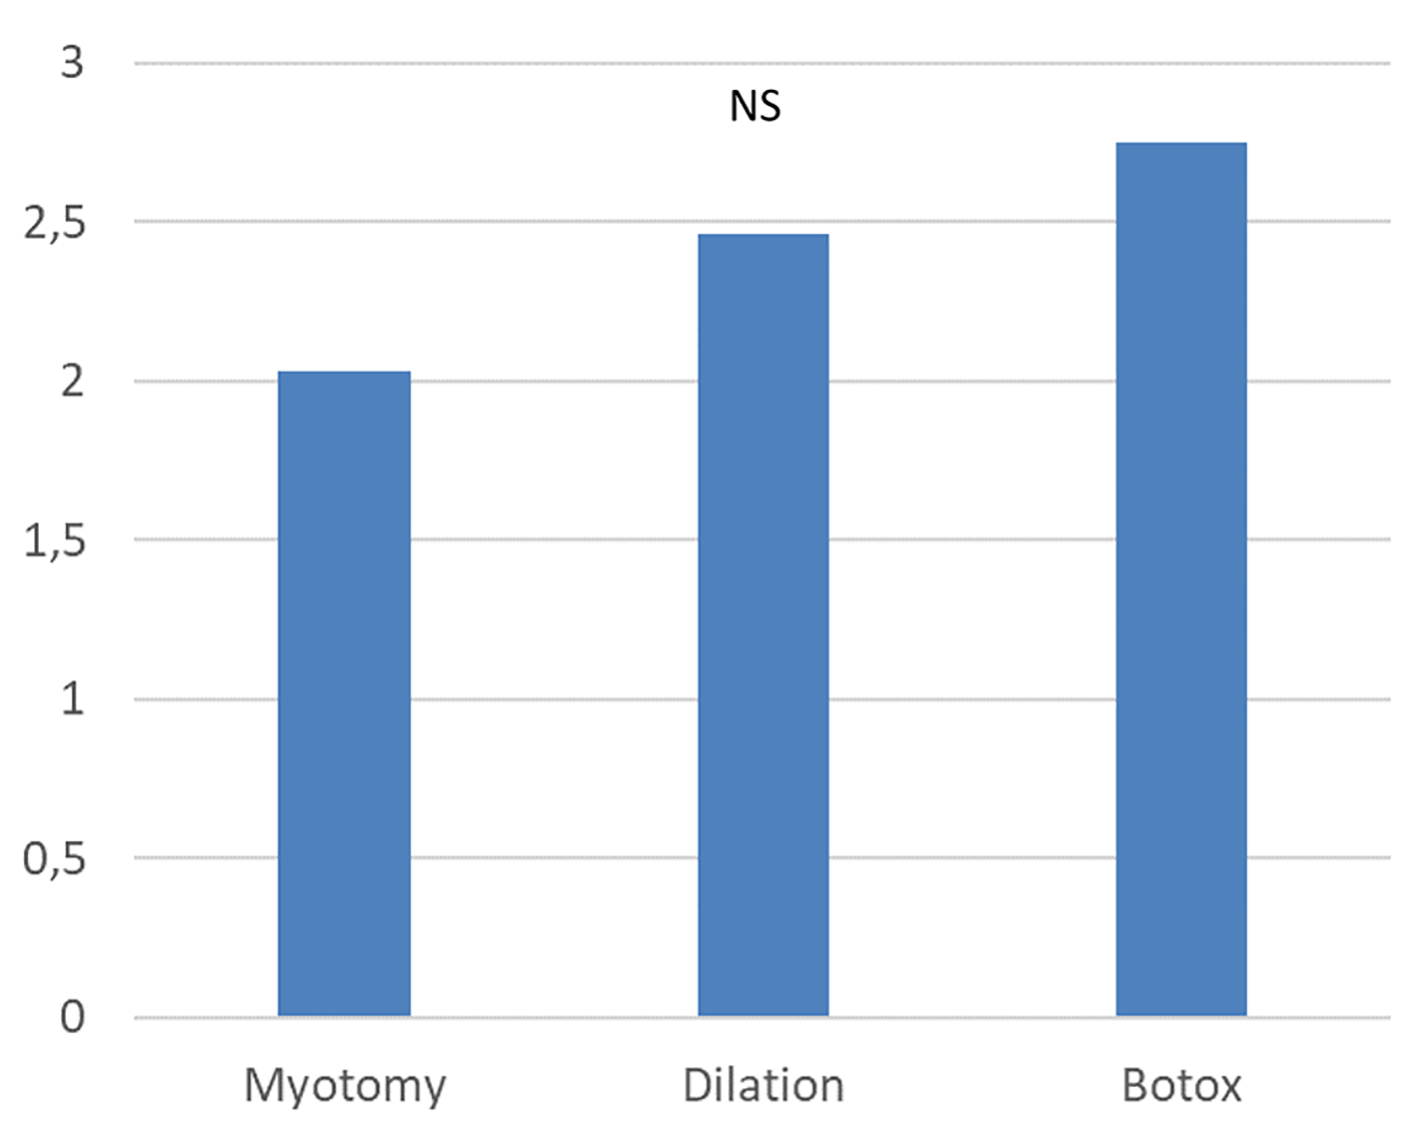
Figure 3. Comparison of post-treatment Eckardt score depending on the type of treatment for esophageal achalasia.
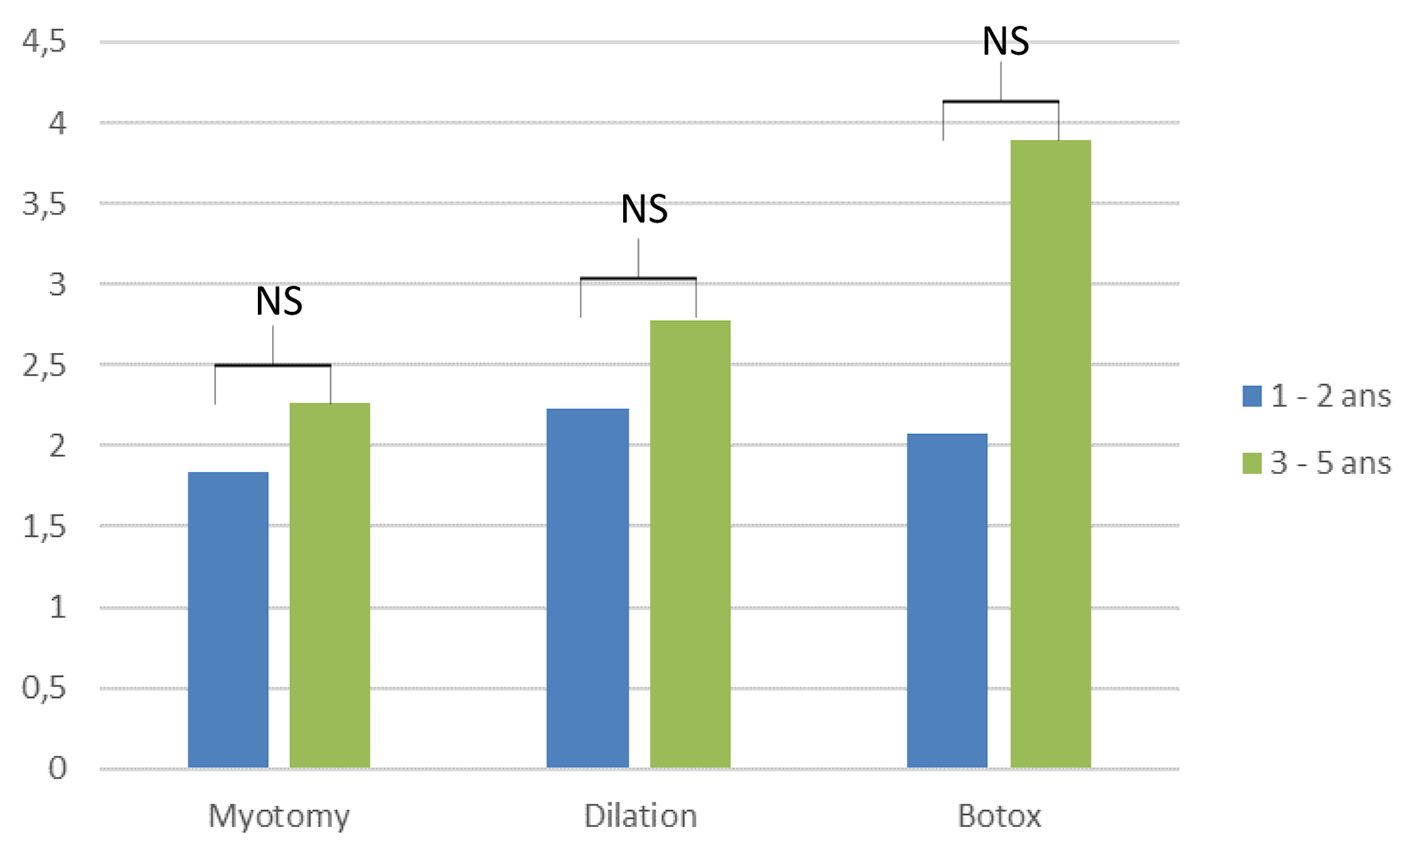
Figure 4. Comparison of post-treatment Eckardt score depending on the delay after the treatment for esophageal achalasia.
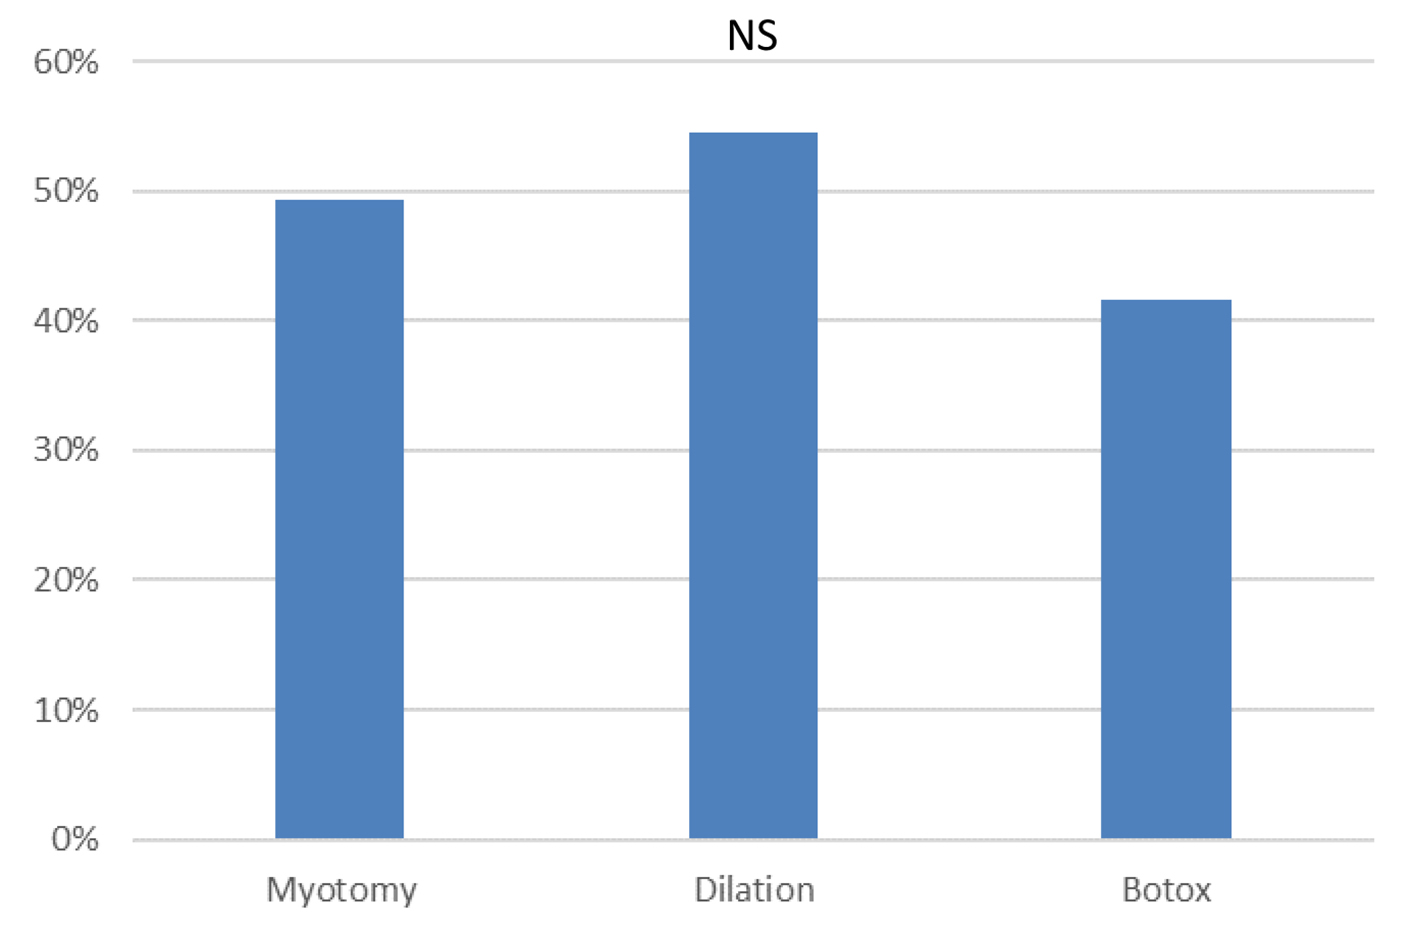
Figure 5. Percentage of patients taking proton pump inhibitor depending on the type of treatment for esophageal achalasia.
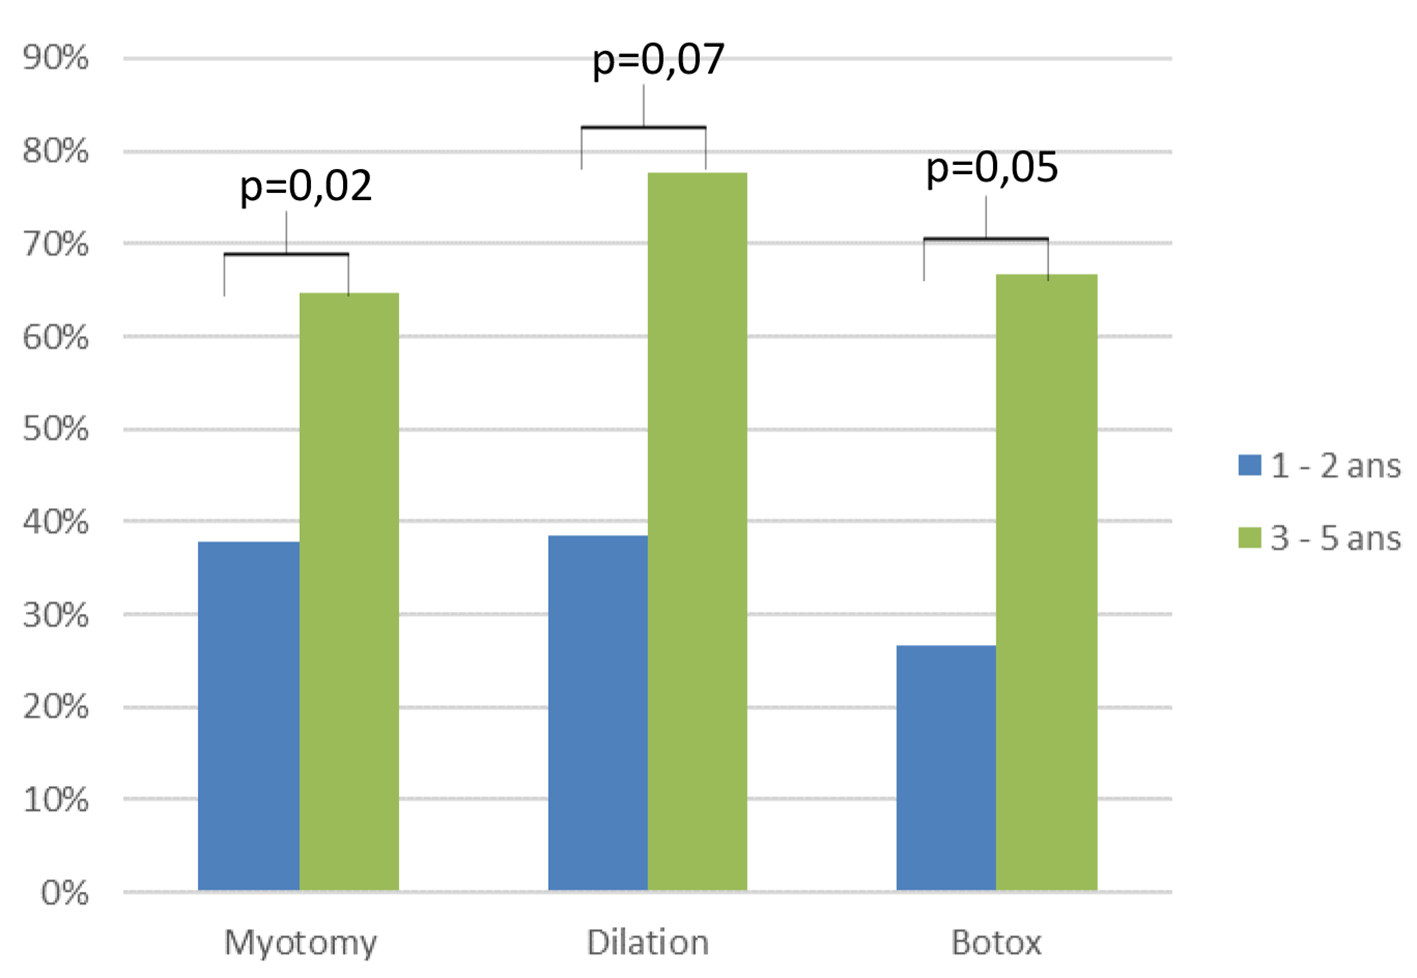
Figure 6. Percentage of patients taking proton pump inhibitor depending on the delay after the treatment for esophageal achalasia.
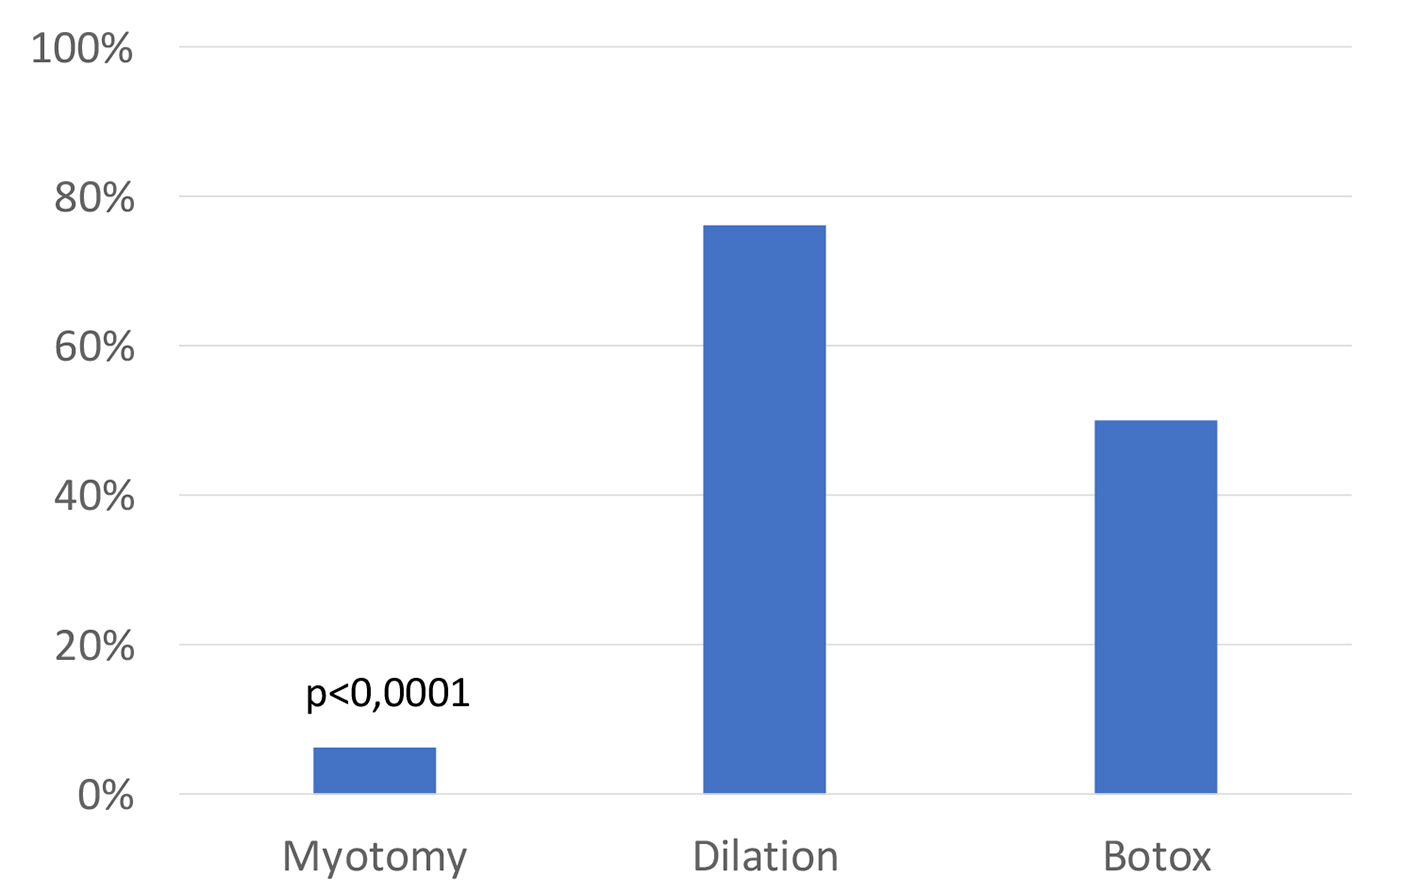
Figure 7. Percentage of patients needing a second treatment depending on the type of treatment for esophageal achalasia.
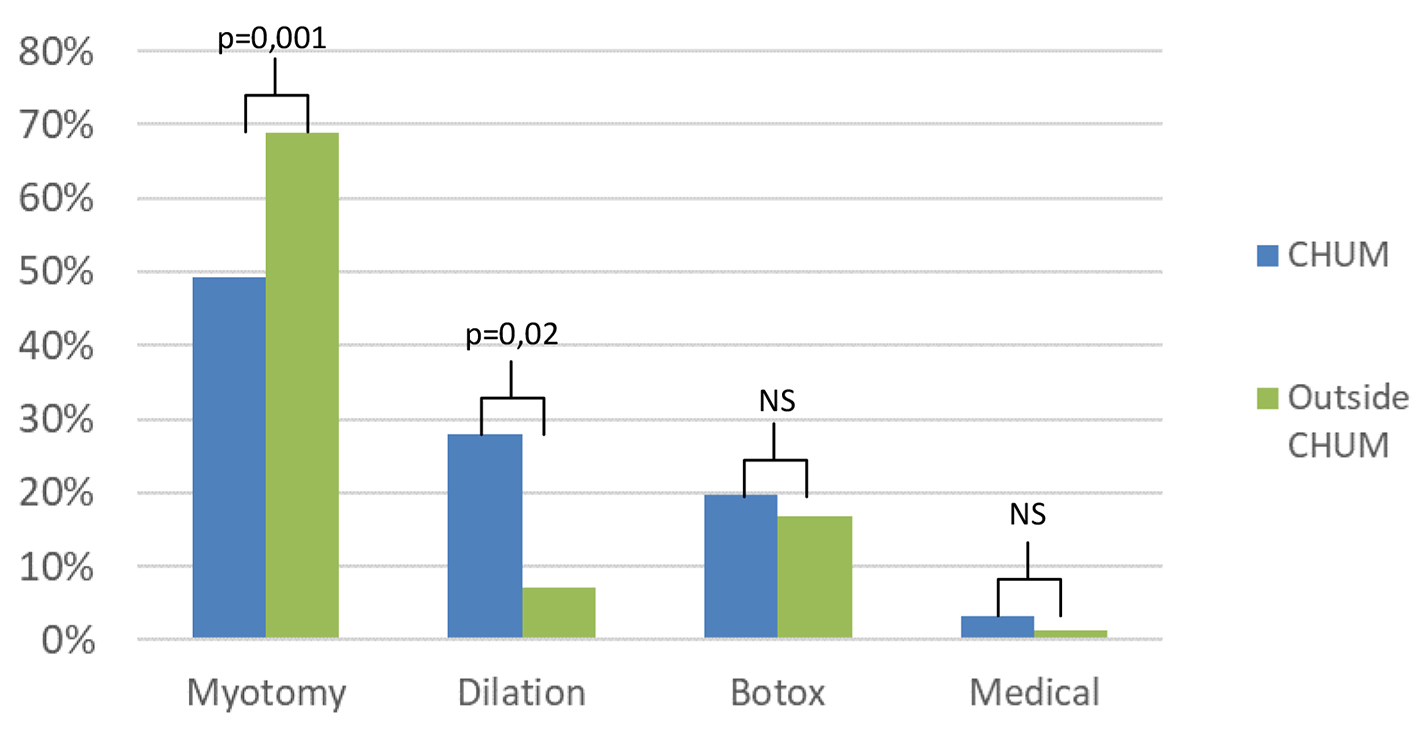
Figure 8. Comparison of the management of patients treated at the CHUM vs. outside CHUM for esophageal achalasia.
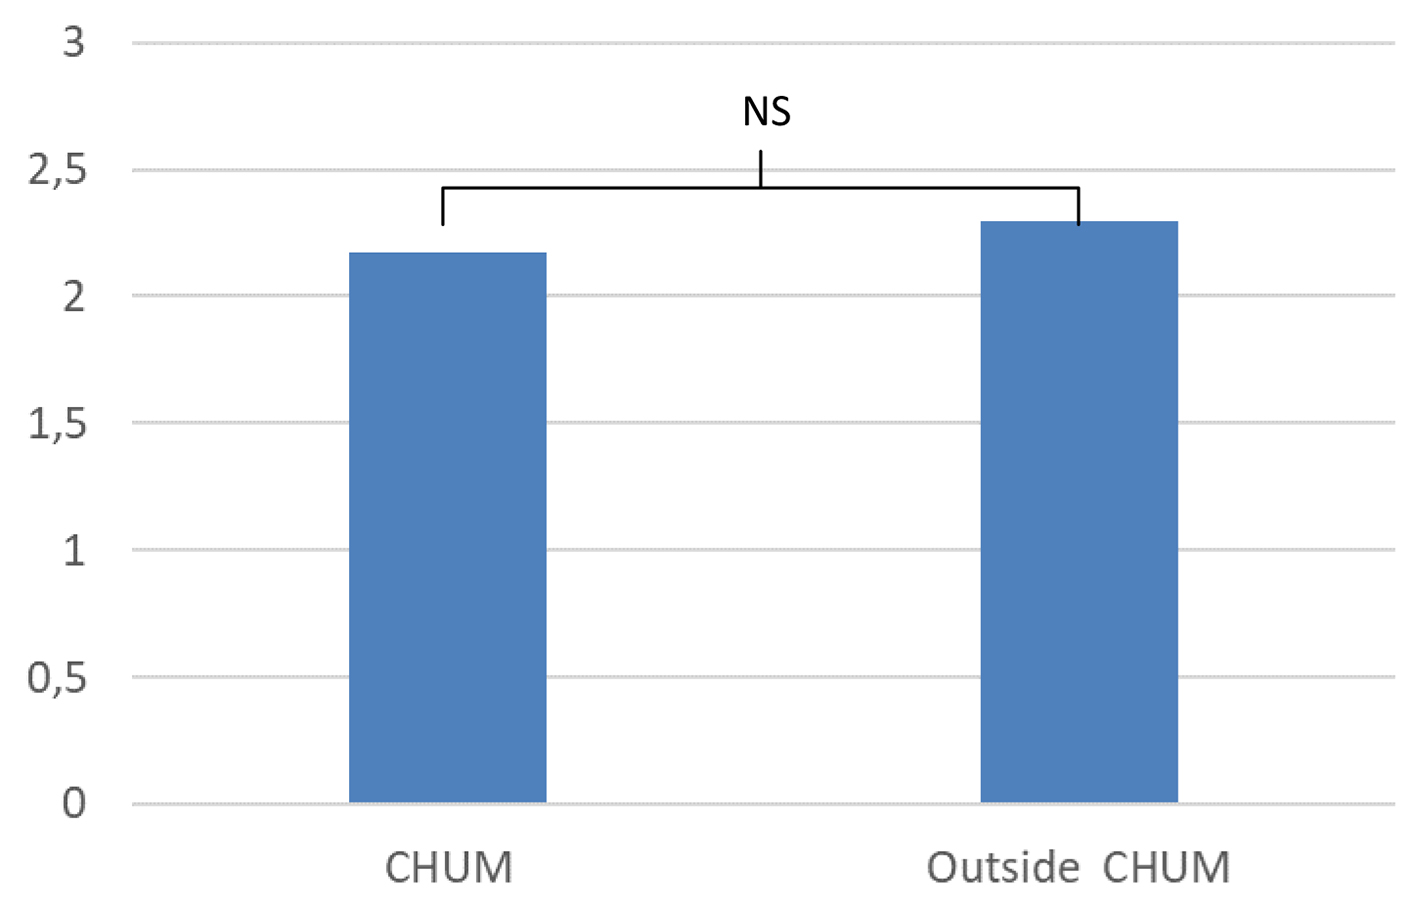
Figure 9. Comparison of post-treatment Eckardt score depending on the site of treatment for esophageal achalasia.
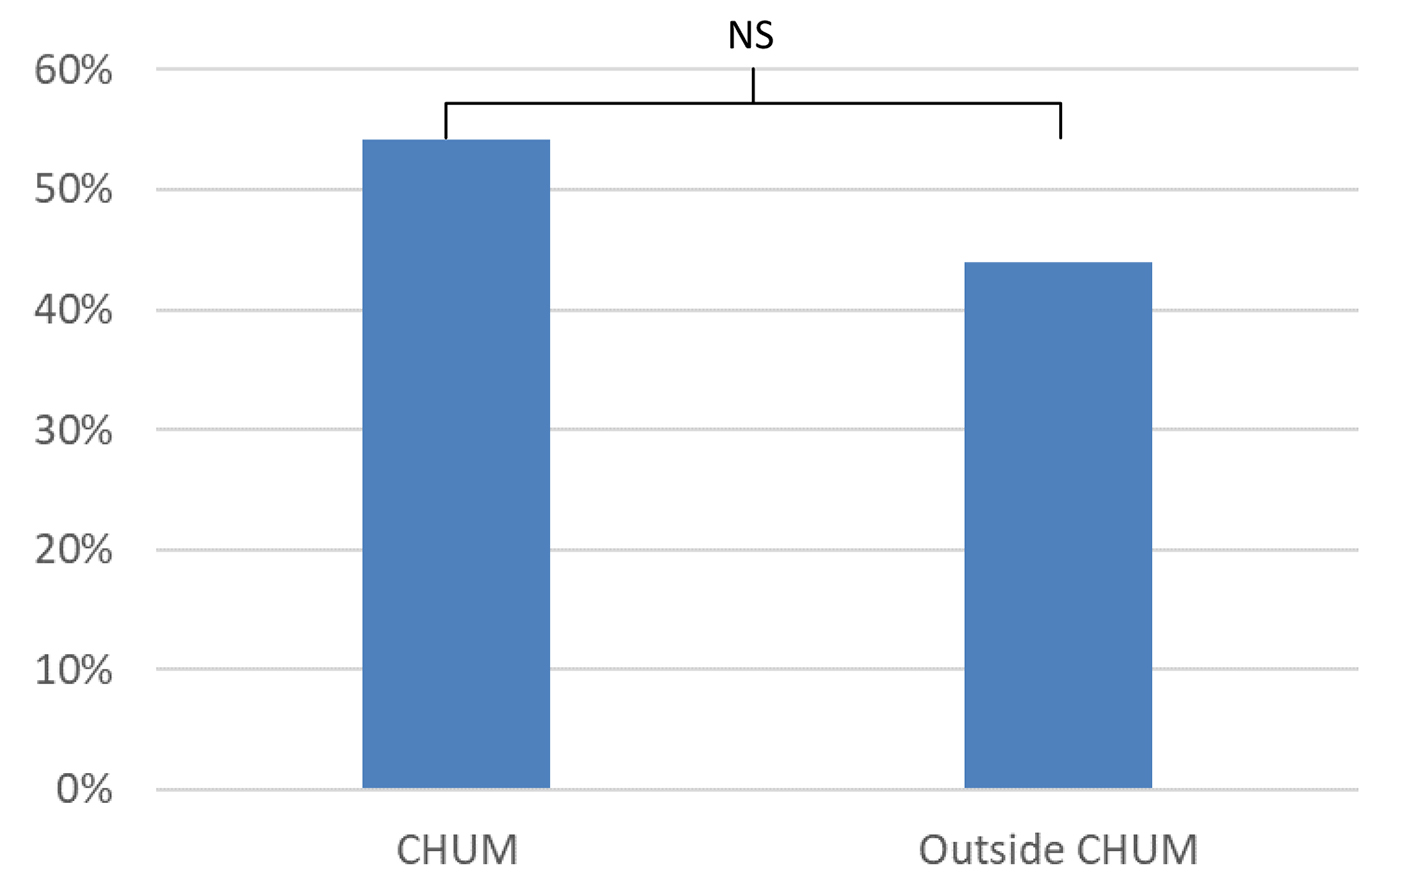
Figure 10. Percentage of patients taking proton pump inhibitor depending on the site of treatment for esophageal achalasia.
Table
Table 1. Characteristics of Patients Depending on the Type of Treatment Received
| Heller myotomy | Botox injection | Dilation | POEM | Medical treatment |
|---|
| POEM: peroral endoscopic myotomy. |
| Patients, n (%) | 79 (60) | 24 (18) | 22 (16) | 4 (3) | 3 (2) |
| Mean age, years | 51 | 68 | 54 | 56 | 62 |
| Male sex, n (%) | 37 (47) | 11 (46) | 16 (73) | 3 (75) | 1 (33) |
| Female sex, n (%) | 42 (53) | 13 (54) | 6 (27) | 1 (25) | 2 (67) |


