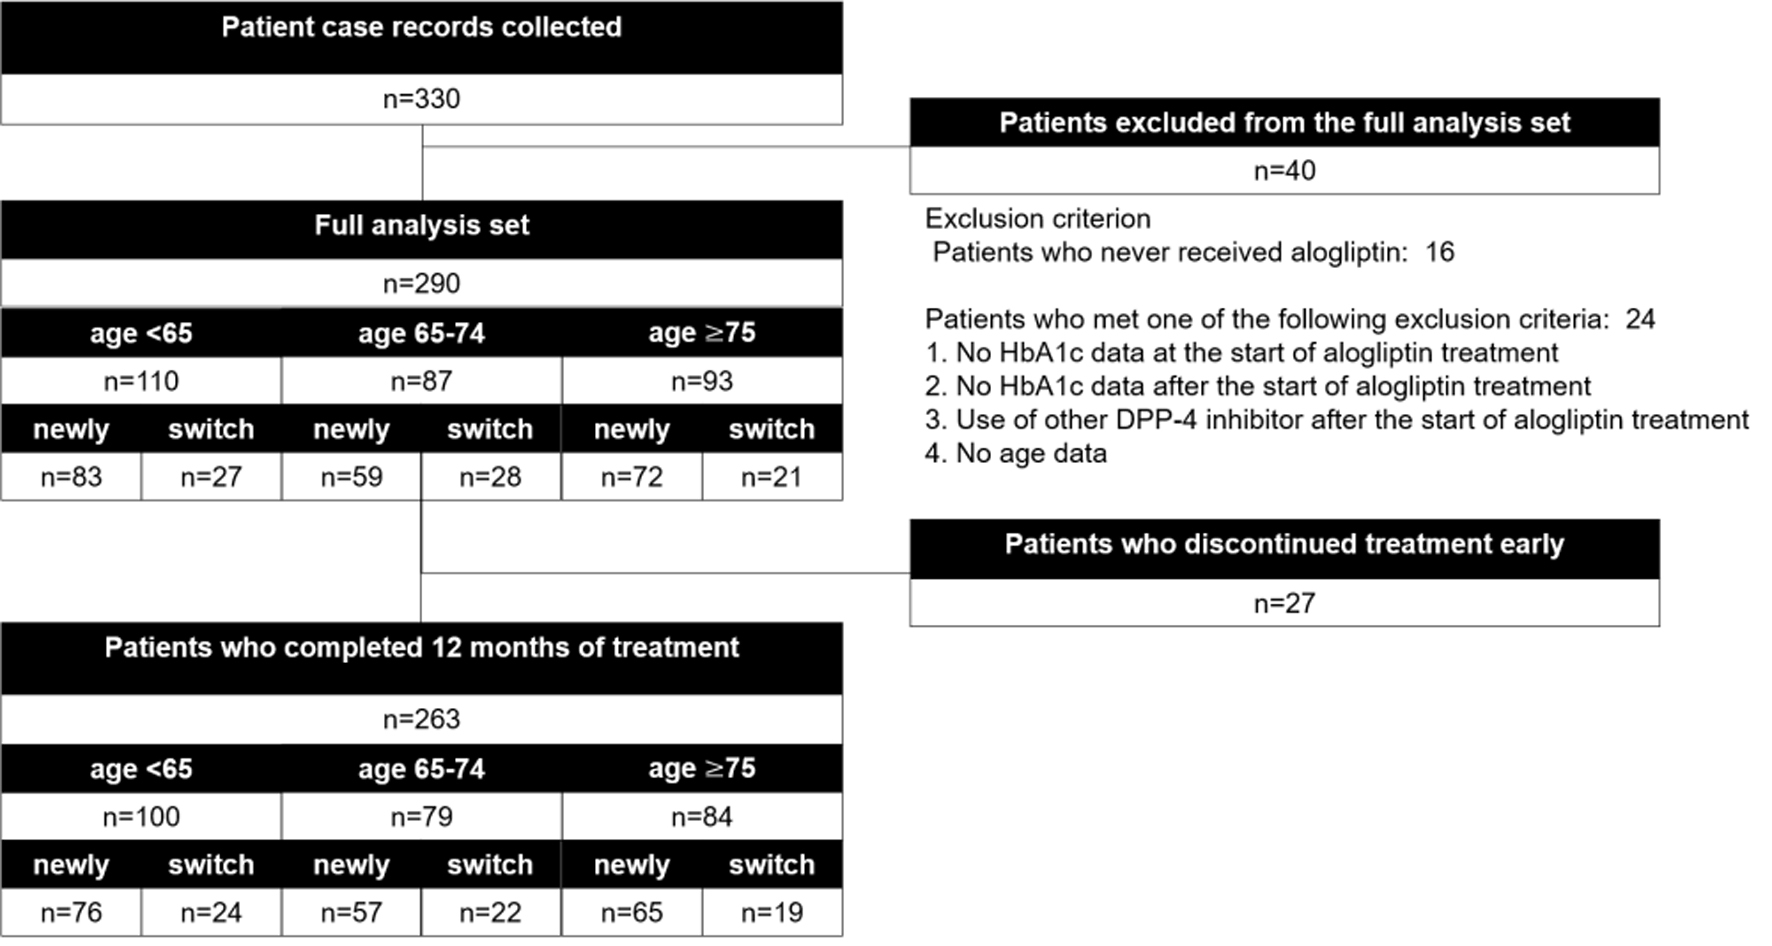
Figure 1. Participant flow.
| Journal of Clinical Medicine Research, ISSN 1918-3003 print, 1918-3011 online, Open Access |
| Article copyright, the authors; Journal compilation copyright, J Clin Med Res and Elmer Press Inc |
| Journal website http://www.jocmr.org |
Original Article
Volume 11, Number 9, September 2019, pages 651-663
Efficacy and Safety of Alogliptin in Elderly Patients With Type 2 Diabetes Mellitus
Figures
Tables
| Age < 65 | Age 65 - 74 | Age ≥ 75 | P | Unknown | |||
|---|---|---|---|---|---|---|---|
| Age < 65 | Age 65 - 74 | Age ≥ 75 | |||||
| *P < 0.05, Chi-square test (excluding “Unknown” cases); **P < 0.05, ANOVA. ANOVA: analysis of variance. | |||||||
| Male/female | 75 (68.2%)/33 (30%) | 46 (52.9%)/41 (47.1%) | 42 (45.2%)/49 (52.7%) | 0.009* | 2 (1.8%) | 0 (0%) | 2 (2.2%) |
| Age | 54.8 ± 7.9 | 69.7 ± 2.9 | 79.8 ± 3.8 | < 0.001** | 0 (0%) | 0 (0%) | 0 (0%) |
| Disease duration | 7.5 ± 5.5 | 11.5 ± 7.9 | 13 ± 8.4 | < 0.001** | 44 (40%) | 32 (36.8%) | 40 (43%) |
| Diabetic retinopathy | 6 (5.5%) | 11 (12.6%) | 6 (6.5%) | 0.249 | 18 (16.4%) | 14 (16.1%) | 21 (22.6%) |
| Diabetic neuropathy | 4 (3.6%) | 9 (10.3%) | 13 (14%) | 0.089 | 18 (16.4%) | 18 (20.7%) | 17 (18.3%) |
| Diabetic nephropathy | 12 (10.9%) | 10 (11.5%) | 12 (12.9%) | 0.837 | 15 (13.6%) | 16 (18.4%) | 17 (18.3%) |
| Cerebrovascular disorders | 5 (4.5%) | 8 (9.2%) | 8 (8.6%) | 0.502 | 19 (17.3%) | 15 (17.2%) | 21 (22.6%) |
| Myocardial infarction | 2 (1.8%) | 7 (8%) | 6 (6.5%) | 0.223 | 19 (17.3%) | 15 (17.2%) | 21 (22.6%) |
| Angina pectoris | 4 (3.6%) | 13 (14.9%) | 13 (14%) | 0.029* | 19 (17.3%) | 14 (16.1%) | 21 (22.6%) |
| Arteriosclerosis obliterans | 2 (1.8%) | 4 (4.6%) | 4 (4.3%) | 0.477 | 22 (20%) | 20 (23%) | 26 (28%) |
| Hypertension | 54 (49.1%) | 54 (62.1%) | 60 (64.5%) | 0.082 | 14 (12.7%) | 12 (13.8%) | 13 (14%) |
| Dyslipidemia | 64 (58.2%) | 54 (62.1%) | 44 (47.3%) | 0.327 | 14 (12.7%) | 12 (13.8%) | 16 (17.2%) |
| Hepatic steatosis | 26 (23.6%) | 16 (18.4%) | 6 (6.5%) | 0.016* | 22 (20%) | 23 (26.4%) | 29 (31.2%) |
| Others | 20 (18.2%) | 27 (31%) | 28 (30.1%) | 0.192 | 30 (27.3%) | 18 (20.7%) | 24 (25.8%) |
| Smoking history | 24 (21.8%) | 22 (25.3%) | 12 (12.9%) | 0.283 | 42 (38.2%) | 32 (36.8%) | 43 (46.2%) |
| Drinking history | 43 (39.1%) | 29 (33.3%) | 14 (15.1%) | 0.005* | 35 (31.8%) | 30 (34.5%) | 43 (46.2%) |
| Family history | 29 (26.4%) | 11 (12.6%) | 9 (9.7%) | < 0.001* | 51 (46.4%) | 37 (42.5%) | 61 (65.6%) |
| Compliance with exercise; good or fair | 47 (42.7%) | 48 (55.2%) | 36 (38.7%) | 0.232 | 51 (46.4%) | 30 (34.5%) | 46 (49.5%) |
| Compliance with diet therapy; good or fair | 49 (44.5%) | 47 (54%) | 40 (43%) | 0.325 | 49 (44.5%) | 30 (34.5%) | 46 (49.5%) |
| Time | Age < 65 | Age 65 - 74 | Age ≥ 75 | P* | |
|---|---|---|---|---|---|
| DPP-4: dipeptidyl peptidase-4; M: month; N/A: not applicable. *P < 0.05 Chi-square test. | |||||
| Number of applicable patients | 0 M | 110 | 87 | 93 | |
| 12 M | 100 | 79 | 84 | ||
| DPP-4 inhibitors | Before | 27 (24.5%) | 28 (32.2%) | 21 (22.6%) | 0.302 |
| 0 M | 110 (100%) | 87 (100%) | 93 (100%) | N/A | |
| 12 M | 100 (100%) | 79 (100%) | 84 (100%) | N/A | |
| Sulfonylurea | Before | 38 (34.5%) | 38 (43.7%) | 41 (44.1%) | 0.289 |
| 0 M | 36 (32.7%) | 38 (43.7%) | 35 (37.6%) | 0.289 | |
| 12 M | 40 (40%) | 34 (43%) | 32 (38.1%) | 0.811 | |
| Biguanide | Before | 36 (32.7%) | 20 (23%) | 14 (15.1%) | 0.013* |
| 0 M | 39 (35.5%) | 24 (27.6%) | 14 (15.1%) | 0.004* | |
| 12 M | 50 (50%) | 24 (30.4%) | 17 (20.2%) | < 0.001* | |
| Thiazolidine | Before | 28 (25.5%) | 12 (13.8%) | 18 (19.4%) | 0.125 |
| 0 M | 22 (20%) | 14 (16.1%) | 16 (17.2%) | 0.758 | |
| 12M | 22 (22%) | 9 (11.4%) | 15 (17.9%) | 0.178 | |
| α-glucosidase inhibitors | Before | 25 (22.7%) | 20 (23%) | 26 (28%) | 0.639 |
| 0 M | 19 (17.3%) | 11 (12.6%) | 15 (16.1%) | 0.659 | |
| 12 M | 13 (13%) | 10 (12.7%) | 12 (14.3%) | 0.948 | |
| Glinide | Before | 5 (4.5%) | 4 (4.6%) | 7 (7.5%) | 0.588 |
| 0 M | 0 (0%) | 0 (0%) | 0 (0%) | N/A | |
| 12 M | 0 (0%) | 0 (0%) | 0 (0%) | N/A | |
| Insulin | Before | 0 (0%) | 1 (1.1%) | 0 (0%) | 0.310 |
| 0 M | 0 (0%) | 0 (0%) | 0 (0%) | N/A | |
| 12 M | 0 (0%) | 0 (0%) | 1 (1.2%) | 0.343 | |
| Age < 65 | Age 65 - 74 | Age ≥ 75 | P (ANOVA) | |||||||||||
|---|---|---|---|---|---|---|---|---|---|---|---|---|---|---|
| n | Mean | SD | P* | n | Mean | SD | P* | n | Mean | SD | P* | |||
| SD: standard deviation; ANOVA: analysis of variance; HbA1c: hemoglobin A1c; M: month; TC: total cholesterol; HDL-C: high-density lipoprotein cholesterol; LDL-C: low-density lipoprotein cholesterol; TG: triglyceride; GOT: glutamate oxaloacetate transaminase; GPT: glutamate pyruvate transaminase; γ-GTP: γ-glutamyl transpeptidase; SBP: systolic blood pressure; DBP: diastolic blood pressure; BMI: body mass index. *P < 0.05 versus 0 month, paired t-test; **P < 0.05, ANOVA. | ||||||||||||||
| HbA1c (%) | 0 M | 110 | 7.65 | 1.32 | 87 | 7.39 | 1.15 | 93 | 7.06 | 1.02 | 0.002** | |||
| 3 M | 105 | 6.94 | 0.86 | 84 | 6.90 | 0.71 | 82 | 6.84 | 0.86 | 0.722 | ||||
| 6 M | 93 | 6.84 | 0.81 | 81 | 6.82 | 0.61 | 82 | 6.64 | 0.71 | 0.132 | ||||
| 9 M | 92 | 6.92 | 0.98 | 71 | 6.80 | 0.67 | 79 | 6.68 | 0.77 | 0.186 | ||||
| 12 M | 96 | 6.90 | 1.07 | 76 | 6.82 | 0.68 | 76 | 6.74 | 0.81 | 0.513 | ||||
| Δ3 M | 105 | -0.73 | 1.02 | < 0.001* | 84 | -0.50 | 0.95 | < 0.001* | 82 | -0.30 | 0.90 | 0.004* | 0.010** | |
| Δ6 M | 93 | -0.82 | 1.18 | < 0.001* | 81 | -0.50 | 0.97 | < 0.001* | 82 | -0.49 | 1.05 | < 0.001* | 0.066 | |
| Δ9 M | 92 | -0.73 | 1.28 | < 0.001* | 71 | -0.49 | 0.86 | < 0.001* | 79 | -0.41 | 1.10 | 0.001* | 0.155 | |
| Δ12 M | 96 | -0.74 | 1.45 | < 0.001* | 76 | -0.47 | 1.02 | < 0.001* | 76 | -0.42 | 1.11 | 0.002* | 0.180 | |
| Blood glucose (fasting) (mg/dL) | 0 M | 37 | 162.0 | 57.7 | 27 | 140.1 | 35.9 | 29 | 142.7 | 35.8 | 0.111 | |||
| 3 M | 32 | 134.7 | 30.8 | 23 | 151.0 | 48.9 | 20 | 125.6 | 27.3 | 0.073 | ||||
| 6 M | 26 | 126.8 | 30.3 | 23 | 130.1 | 26.8 | 21 | 132.7 | 22.7 | 0.756 | ||||
| 9 M | 29 | 139.3 | 39.7 | 21 | 138.1 | 39.7 | 21 | 124.1 | 23.0 | 0.287 | ||||
| 12 M | 30 | 132.1 | 48.4 | 19 | 129.8 | 34.0 | 17 | 134.1 | 35.5 | 0.955 | ||||
| Δ3 M | 27 | -32.9 | 46.6 | 0.001* | 18 | 9.4 | 40.9 | 0.341 | 18 | -15.9 | 30.1 | 0.039* | 0.005** | |
| Δ6 M | 22 | -23.4 | 37.4 | 0.008* | 19 | -16.4 | 30.2 | 0.029* | 20 | -18.1 | 22.6 | 0.002* | 0.749 | |
| Δ9 M | 24 | -25.3 | 56.3 | 0.038* | 18 | -10.0 | 29.3 | 0.166 | 18 | -26.9 | 36.8 | 0.006* | 0.437 | |
| Δ12 M | 25 | -39.6 | 66.8 | 0.007* | 17 | -17.7 | 23.9 | 0.008* | 17 | -13.7 | 38.0 | 0.157 | 0.197 | |
| Blood glucose (postprandial) (mg/dL) | 0 M | 42 | 189.4 | 63.8 | 38 | 180.3 | 63.6 | 37 | 188.9 | 78.2 | 0.810 | |||
| 3 M | 39 | 162.3 | 55.0 | 33 | 147.4 | 31.9 | 34 | 165.2 | 45.2 | 0.233 | ||||
| 6 M | 42 | 162.5 | 71.3 | 32 | 161.2 | 47.6 | 33 | 162.0 | 55.9 | 0.996 | ||||
| 9 M | 36 | 161.9 | 58.7 | 29 | 154. | 38.5 | 28 | 176.7 | 61.9 | 0.282 | ||||
| 12 M | 40 | 182.8 | 75.5 | 37 | 160.9 | 44.4 | 36 | 168.9 | 56.5 | 0.278 | ||||
| Δ3 M | 35 | -20.7 | 50.4 | 0.021* | 30 | -29.2 | 63.2 | 0.017* | 33 | -7.5 | 51.9 | 0.415 | 0.291 | |
| Δ6 M | 33 | -24.4 | 44.0 | 0.003* | 30 | -1.7 | 58.6 | 0.872 | 31 | -15.6 | 61.2 | 0.165 | 0.264 | |
| Δ9 M | 31 | -23.3 | 58.6 | 0.035* | 26 | -5.9 | 46.9 | 0.525 | 25 | 9.6 | 74.7 | 0.525 | 0.136 | |
| Δ12 M | 36 | -6.6 | 66.3 | 0.552 | 33 | -18.1 | 69.6 | 0.145 | 33 | -2.2 | 66.7 | 0.852 | 0.614 | |
| TC (mg/dL) | 0 M | 74 | 197.3 | 35.8 | 48 | 193.6 | 34.2 | 41 | 185.1 | 27.4 | 0.178 | |||
| 3 M | 64 | 192.5 | 35.5 | 44 | 187.7 | 25.0 | 35 | 182.5 | 31.7 | 0.314 | ||||
| 6 M | 54 | 187.0 | 31.1 | 40 | 185.8 | 30.5 | 33 | 187.8 | 33.0 | 0.959 | ||||
| 9 M | 50 | 186.1 | 29.9 | 31 | 182.8 | 31.6 | 27 | 176.8 | 30.7 | 0.449 | ||||
| 12 M | 57 | 188.5 | 32.6 | 34 | 189.3 | 32.6 | 28 | 181.4 | 30.1 | 0.560 | ||||
| Δ3 M | 63 | -3.0 | 30.4 | 0.432 | 43 | -5.8 | 23.2 | 0.111 | 32 | 0.3 | 28.7 | 0.961 | 0.654 | |
| Δ6 M | 54 | -11.4 | 38.4 | 0.033* | 39 | -9.4 | 26.1 | 0.031* | 32 | 1.7 | 31.2 | 0.766 | 0.194 | |
| Δ9 M | 49 | -15.3 | 33.3 | 0.002* | 31 | -12.1 | 25.5 | 0.013* | 26 | -3.7 | 23.5 | 0.426 | 0.258 | |
| Δ12 M | 55 | -12.7 | 32.2 | 0.005* | 34 | -8.2 | 21.5 | 0.032* | 27 | -1.0 | 24.7 | 0.841 | 0.199 | |
| LDL-C (mg/dL) | 0 M | 76 | 119.1 | 30.3 | 68 | 109.9 | 30.5 | 66 | 108.5 | 24.2 | 0.055 | |||
| 3 M | 65 | 113.8 | 27.0 | 63 | 107.2 | 28.2 | 46 | 105.1 | 24.3 | 0.187 | ||||
| 6 M | 60 | 109.3 | 28.9 | 54 | 108.1 | 29.3 | 50 | 104.8 | 25.7 | 0.697 | ||||
| 9 M | 50 | 106.3 | 22.8 | 44 | 103.6 | 24.7 | 41 | 104.3 | 28.1 | 0.865 | ||||
| 12 M | 59 | 110.2 | 26.8 | 52 | 106.4 | 24.3 | 47 | 103.3 | 23.3 | 0.361 | ||||
| Δ3 M | 62 | -6.5 | 31.5 | 0.109 | 62 | -3.2 | 21.6 | 0.251 | 44 | 1.4 | 15.8 | 0.570 | 0.270 | |
| Δ6 M | 57 | -11.6 | 33.4 | 0.012* | 53 | -3.1 | 20.3 | 0.269 | 49 | -3.7 | 20.8 | 0.222 | 0.164 | |
| Δ9 M | 47 | -15.9 | 31.4 | 0.001* | 42 | -7.9 | 27.0 | 0.064 | 40 | -3.3 | 21.9 | 0.343 | 0.097 | |
| Δ12 M | 56 | -12.7 | 27.3 | < 0.001* | 52 | -6.8 | 29.5 | 0.105 | 44 | -4.1 | 21.5 | 0.208 | 0.252 | |
| HDL-C (mg/dL) | 0 M | 90 | 52.0 | 12.4 | 69 | 56.7 | 13.3 | 74 | 56.0 | 13.6 | 0.046** | |||
| 3 M | 80 | 52.4 | 12.2 | 66 | 56.2 | 14.4 | 53 | 55.0 | 14.2 | 0.207 | ||||
| 6 M | 73 | 51.7 | 11.8 | 54 | 56.0 | 12.6 | 55 | 57.8 | 15.0 | 0.025** | ||||
| 9 M | 67 | 52.0 | 13.4 | 46 | 55.9 | 15.7 | 46 | 56.2 | 13.8 | 0.209 | ||||
| 12 M | 75 | 53.0 | 12.1 | 51 | 55.0 | 11.9 | 55 | 57.5 | 15.4 | 0.167 | ||||
| Δ3 M | 78 | 0.9 | 7.3 | 0.278 | 64 | -0.4 | 5.7 | 0.615 | 51 | 0.2 | 7.9 | 0.860 | 0.561 | |
| Δ6 M | 70 | 1.8 | 7.6 | 0.057 | 54 | -2.1 | 7.4 | 0.043* | 55 | 1.7 | 8.0 | 0.127 | 0.011** | |
| Δ9 M | 63 | 0.3 | 7.8 | 0.772 | 45 | -1.6 | 8.6 | 0.208 | 46 | 0.8 | 7.3 | 0.472 | 0.298 | |
| Δ12 M | 71 | 1.6 | 8.3 | 0.110 | 51 | -2.4 | 6.7 | 0.015* | 53 | 0.9 | 7.9 | 0.427 | 0.017** | |
| TG (mg/dL) | 0 M | 92 | 195.2 | 193.5 | 77 | 165.5 | 119.8 | 74 | 128.2 | 70.2 | 0.012** | |||
| 3 M | 82 | 177.4 | 247.6 | 74 | 153.1 | 101.4 | 55 | 133.3 | 89.8 | 0.328 | ||||
| 6 M | 74 | 177.9 | 136.1 | 63 | 148.0 | 93.1 | 57 | 123.3 | 77.4 | 0.017** | ||||
| 9 M | 68 | 164.4 | 100.2 | 55 | 147.2 | 85.4 | 48 | 122.1 | 64.9 | 0.038** | ||||
| 12 M | 76 | 154.2 | 78.3 | 61 | 149.5 | 91.5 | 56 | 123.7 | 62.5 | 0.073 | ||||
| Δ3 M | 80 | -4.4 | 209.1 | 0.850 | 73 | -11.7 | 95.9 | 0.300 | 53 | 0.7 | 79.2 | 0.948 | 0.893 | |
| Δ6 M | 73 | -37.3 | 144.0 | 0.030* | 63 | -10.9 | 104.1 | 0.409 | 57 | -1.4 | 74.5 | 0.885 | 0.175 | |
| Δ9 M | 66 | -49.1 | 152.1 | 0.011* | 54 | -14.3 | 85.8 | 0.227 | 48 | 1.2 | 52.6 | 0.874 | 0.046** | |
| Δ12 M | 72 | -24.0 | 117.8 | 0.089 | 61 | -7.5 | 82.3 | 0.470 | 54 | 2.7 | 61.9 | 0.748 | 0.268 | |
| GOT (IU/L) | 0 M | 78 | 31.6 | 21.3 | 69 | 26.2 | 12.9 | 69 | 24.8 | 11.7 | 0.028** | |||
| 3 M | 67 | 29.2 | 18.0 | 61 | 26.3 | 13.2 | 48 | 25.7 | 11.0 | 0.377 | ||||
| 6 M | 62 | 28.0 | 16.3 | 56 | 26.1 | 12.4 | 52 | 23.7 | 8.5 | 0.221 | ||||
| 9 M | 53 | 28.9 | 17.6 | 41 | 26.4 | 11.4 | 38 | 25.6 | 20.7 | 0.623 | ||||
| 12 M | 64 | 28.9 | 18.0 | 50 | 28.5 | 18.0 | 48 | 24.6 | 11.6 | 0.335 | ||||
| Δ3 M | 65 | -3.1 | 18.0 | 0.164 | 58 | -0.4 | 9.7 | 0.766 | 46 | -0.2 | 5.5 | 0.852 | 0.371 | |
| Δ6 M | 57 | -2.3 | 17.2 | 0.324 | 55 | 0.4 | 11.4 | 0.804 | 51 | -1.9 | 8.2 | 0.097 | 0.507 | |
| Δ9 M | 51 | -3.0 | 15.2 | 0.159 | 40 | 0.3 | 12.4 | 0.889 | 38 | 1.5 | 9.4 | 0.321 | 0.219 | |
| Δ12 M | 58 | -3.8 | 19.4 | 0.145 | 50 | 2.5 | 15.6 | 0.258 | 47 | -1.0 | 11.9 | 0.583 | 0.135 | |
| GPT (IU/L) | 0 M | 90 | 38.9 | 31.6 | 76 | 27.3 | 17.9 | 72 | 21.1 | 15.2 | < 0.001** | |||
| 3 M | 81 | 34.5 | 24.0 | 70 | 25.5 | 18.2 | 54 | 20.8 | 14.6 | < 0.001** | ||||
| 6 M | 72 | 35.9 | 33.5 | 61 | 26.0 | 15.6 | 56 | 18.3 | 11.1 | < 0.001** | ||||
| 9 M | 65 | 32.4 | 20.6 | 49 | 26.1 | 15.5 | 43 | 21.2 | 14.0 | 0.005** | ||||
| 12 M | 78 | 35.2 | 29.3 | 55 | 28.3 | 20.9 | 50 | 18.5 | 9.2 | < 0.001** | ||||
| Δ3 M | 78 | -5.4 | 19.6 | 0.017* | 67 | -1.2 | 12.7 | 0.438 | 51 | -0.9 | 6.7 | 0.330 | 0.139 | |
| Δ6 M | 68 | -3.3 | 31.7 | 0.399 | 61 | -0.1 | 11.2 | 0.964 | 53 | -2.5 | 10.7 | 0.097 | 0.680 | |
| Δ9 M | 62 | -6.7 | 23.2 | 0.027* | 47 | 0.0 | 10.5 | 0.978 | 41 | 0.9 | 7.8 | 0.461 | 0.036** | |
| Δ12 M | 72 | -5.2 | 26.8 | 0.106 | 55 | 1.9 | 15.1 | 0.348 | 49 | -2.5 | 12.3 | 0.166 | 0.148 | |
| γ-GTP (IU/L) | 0 M | 81 | 56.7 | 51.9 | 65 | 45.0 | 57.2 | 71 | 40.6 | 69.3 | 0.226 | |||
| 3 M | 69 | 53.5 | 59.9 | 58 | 45.2 | 61.8 | 50 | 44.3 | 69.2 | 0.670 | ||||
| 6 M | 66 | 54.3 | 49.4 | 49 | 52.4 | 66.1 | 51 | 37.9 | 52.1 | 0.248 | ||||
| 9 M | 57 | 54.3 | 49.6 | 37 | 61.8 | 90.4 | 42 | 55.0 | 123.5 | 0.915 | ||||
| 12 M | 68 | 49.0 | 42.9 | 45 | 56.2 | 80.2 | 50 | 36.6 | 61.8 | 0.281 | ||||
| Δ3 M | 66 | -4.5 | 20.3 | 0.076 | 54 | -0.1 | 19.5 | 0.972 | 49 | -0.6 | 16.7 | 0.805 | 0.380 | |
| Δ6 M | 61 | -3.8 | 21.9 | 0.178 | 48 | 2.8 | 46.6 | 0.680 | 51 | -5.7 | 35.6 | 0.256 | 0.451 | |
| Δ9 M | 54 | -3.4 | 23.9 | 0.302 | 34 | 6.4 | 70.9 | 0.602 | 42 | 10.3 | 49.9 | 0.188 | 0.363 | |
| Δ12 M | 62 | -5.1 | 27.7 | 0.151 | 44 | 4.0 | 65.0 | 0.682 | 50 | 0.7 | 67.8 | 0.945 | 0.680 | |
| Serum amylase (IU/L) | 0 M | 30 | 59.9 | 25.3 | 17 | 67.0 | 19.3 | 11 | 83.6 | 24.7 | 0.022** | |||
| 3 M | 21 | 64.9 | 23.0 | 15 | 72.1 | 20.1 | 11 | 88.6 | 23.5 | 0.023** | ||||
| 6 M | 12 | 67.3 | 25.3 | 13 | 71.4 | 20.3 | 10 | 86.8 | 24.7 | 0.144 | ||||
| 9 M | 5 | 63.6 | 14.9 | 2 | 80.5 | 3.5 | 4 | 80.0 | 17.4 | 0.250 | ||||
| 12 M | 10 | 55.9 | 16.5 | 9 | 76.0 | 21.2 | 3 | 113.0 | 29.5 | 0.001** | ||||
| Δ3 M | 19 | 4.5 | 12.1 | 0.121 | 14 | 6.8 | 20.6 | 0.241 | 9 | 1.6 | 14.7 | 0.759 | 0.746 | |
| Δ6 M | 12 | 8.0 | 9.7 | 0.016* | 11 | 13.4 | 17.2 | 0.028* | 7 | 1.4 | 14.8 | 0.807 | 0.229 | |
| Δ9 M | 4 | 2.3 | 8.3 | 0.624 | 2 | 1.0 | 4.2 | 0.795 | 4 | -4.8 | 27.0 | 0.749 | 0.860 | |
| Δ12 M | 9 | 1.1 | 11.4 | 0.777 | 8 | 9.9 | 21.7 | 0.238 | 2 | -8.5 | 31.8 | 0.770 | 0.392 | |
| Serum creatinine (mg/dL) | 0 M | 89 | 0.70 | 0.16 | 65 | 0.73 | 0.27 | 72 | 0.73 | 0.20 | 0.458 | |||
| 3 M | 77 | 0.72 | 0.17 | 60 | 0.75 | 0.27 | 56 | 0.80 | 0.40 | 0.283 | ||||
| 6 M | 73 | 0.73 | 0.17 | 52 | 0.75 | 0.27 | 58 | 0.76 | 0.19 | 0.556 | ||||
| 9 M | 66 | 0.74 | 0.16 | 46 | 0.75 | 0.32 | 49 | 0.73 | 0.20 | 0.856 | ||||
| 12 M | 77 | 0.76 | 0.17 | 51 | 0.76 | 0.28 | 56 | 0.75 | 0.18 | 0.961 | ||||
| Δ3 M | 74 | 0.04 | 0.08 | < 0.001* | 57 | 0.00 | 0.08 | 0.692 | 54 | 0.03 | 0.13 | 0.093 | 0.160 | |
| Δ6 M | 69 | 0.03 | 0.08 | 0.002* | 52 | 0.02 | 0.10 | 0.122 | 56 | 0.01 | 0.10 | 0.355 | 0.578 | |
| Δ9 M | 62 | 0.04 | 0.07 | < 0.001* | 42 | 0.03 | 0.08 | 0.012* | 48 | 0.01 | 0.10 | 0.378 | 0.157 | |
| Δ12 M | 70 | 0.06 | 0.08 | < 0.001* | 50 | 0.02 | 0.08 | 0.045* | 54 | 0.01 | 0.10 | 0.319 | 0.016** | |
| SBP (mm Hg) | 0 M | 108 | 133.0 | 17.2 | 86 | 132.3 | 13.3 | 91 | 137.5 | 21.5 | 0.097 | |||
| 3 M | 103 | 130.1 | 13.7 | 84 | 131.1 | 14.7 | 87 | 135.2 | 16.4 | 0.050 | ||||
| 6 M | 91 | 131.4 | 13.8 | 81 | 130.8 | 14.1 | 83 | 136.4 | 17.3 | 0.035** | ||||
| 9 M | 85 | 131.3 | 13.4 | 73 | 131.2 | 12.8 | 80 | 134.0 | 15.4 | 0.359 | ||||
| 12 M | 94 | 132.0 | 17.0 | 75 | 130.6 | 11.3 | 81 | 134.8 | 17.9 | 0.244 | ||||
| Δ3 M | 101 | -2.6 | 15.2 | 0.094 | 83 | -1.0 | 14.5 | 0.551 | 87 | -2.7 | 18.1 | 0.171 | 0.731 | |
| Δ6 M | 91 | -1.4 | 14.7 | 0.352 | 80 | -1.4 | 13.7 | 0.359 | 81 | -1.4 | 18.6 | 0.498 | 1.000 | |
| Δ9 M | 85 | -2.0 | 15.6 | 0.244 | 72 | -1.1 | 14.3 | 0.501 | 79 | -3.8 | 21.1 | 0.117 | 0.634 | |
| Δ12 M | 94 | -1.0 | 16.5 | 0.567 | 74 | -1.7 | 15.2 | 0.331 | 80 | -4.2 | 20.8 | 0.074 | 0.465 | |
| DBP (mm Hg) | 0 M | 108 | 80.0 | 11.4 | 86 | 73.2 | 10.0 | 91 | 74.0 | 10.4 | < 0.001** | |||
| 3 M | 103 | 78.4 | 11.7 | 84 | 74.3 | 9.6 | 87 | 72.6 | 9.6 | < 0.001** | ||||
| 6 M | 91 | 78.5 | 11.1 | 81 | 73.4 | 9.8 | 82 | 72.4 | 8.7 | < 0.001** | ||||
| 9 M | 84 | 79.5 | 11.3 | 73 | 72.4 | 9.0 | 80 | 71.9 | 9.6 | < 0.001** | ||||
| 12 M | 94 | 79.6 | 10.8 | 75 | 73.6 | 8.4 | 81 | 72.6 | 9.8 | < 0.001** | ||||
| Δ3 M | 101 | -1.4 | 9.4 | 0.132 | 83 | 1.4 | 9.3 | 0.164 | 87 | -1.7 | 12.4 | 0.196 | 0.093 | |
| Δ6 M | 91 | -1.5 | 8.0 | 0.075 | 80 | 0.3 | 8.3 | 0.717 | 80 | -1.6 | 11.3 | 0.211 | 0.325 | |
| Δ9 M | 84 | -0.7 | 10.8 | 0.558 | 72 | -0.3 | 9.8 | 0.829 | 79 | -1.9 | 11.4 | 0.132 | 0.594 | |
| Δ12 M | 94 | -0.4 | 9.2 | 0.688 | 74 | 0.2 | 9.9 | 0.861 | 80 | -1.5 | 9.1 | 0.148 | 0.524 | |
| Body weight (kg) | 0 M | 104 | 73.05 | 14.71 | 77 | 62.58 | 10.49 | 85 | 57.56 | 10.47 | < 0.001** | |||
| 3 M | 87 | 71.73 | 13.60 | 69 | 61.64 | 10.28 | 65 | 57.11 | 11.50 | < 0.001** | ||||
| 6 M | 79 | 72.59 | 13.93 | 65 | 61.26 | 10.18 | 66 | 56.50 | 11.29 | < 0.001** | ||||
| 9 M | 71 | 73.11 | 13.75 | 55 | 60.90 | 10.54 | 61 | 57.51 | 11.04 | < 0.001** | ||||
| 12 M | 80 | 74.61 | 15.12 | 62 | 61.63 | 10.50 | 64 | 57.47 | 10.69 | < 0.001** | ||||
| Δ3 M | 86 | -0.05 | 2.02 | 0.822 | 68 | 0.00 | 2.12 | 1.000 | 64 | -0.39 | 1.50 | 0.042* | 0.442 | |
| Δ6 M | 79 | 0.05 | 2.59 | 0.864 | 64 | 0.25 | 4.19 | 0.638 | 64 | -0.33 | 1.62 | 0.112 | 0.538 | |
| Δ9 M | 71 | 0.01 | 2.40 | 0.985 | 54 | -0.29 | 1.90 | 0.274 | 60 | 0.07 | 2.47 | 0.819 | 0.676 | |
| Δ12 M | 80 | 0.59 | 3.15 | 0.101 | 61 | -0.25 | 2.07 | 0.347 | 63 | -0.36 | 2.63 | 0.284 | 0.072 | |
| BMI (kg/m2) | 0 M | 85 | 26.61 | 4.63 | 68 | 24.58 | 3.18 | 73 | 23.55 | 3.23 | < 0.001** | |||
| 3 M | 69 | 26.38 | 4.21 | 60 | 24.26 | 3.17 | 54 | 23.14 | 3.43 | < 0.001** | ||||
| 6 M | 62 | 26.72 | 4.14 | 57 | 24.21 | 3.28 | 54 | 23.16 | 3.30 | < 0.001** | ||||
| 9 M | 53 | 26.68 | 3.87 | 49 | 23.79 | 3.21 | 50 | 23.58 | 3.15 | < 0.001** | ||||
| 12 M | 62 | 27.21 | 4.75 | 55 | 24.07 | 3.27 | 54 | 23.45 | 3.03 | < 0.001** | ||||
| Δ3 M | 68 | 0.05 | 0.61 | 0.482 | 60 | 0.00 | 0.89 | 0.981 | 54 | -0.19 | 0.65 | 0.037* | 0.166 | |
| Δ6 M | 62 | 0.07 | 0.96 | 0.588 | 57 | 0.16 | 1.80 | 0.511 | 53 | -0.18 | 0.71 | 0.066 | 0.337 | |
| Δ9 M | 53 | 0.05 | 0.90 | 0.669 | 49 | -0.07 | 0.74 | 0.521 | 50 | 0.07 | 1.05 | 0.648 | 0.713 | |
| Δ12 M | 62 | 0.23 | 1.16 | 0.115 | 55 | -0.09 | 0.80 | 0.402 | 54 | -0.15 | 1.15 | 0.329 | 0.101 | |