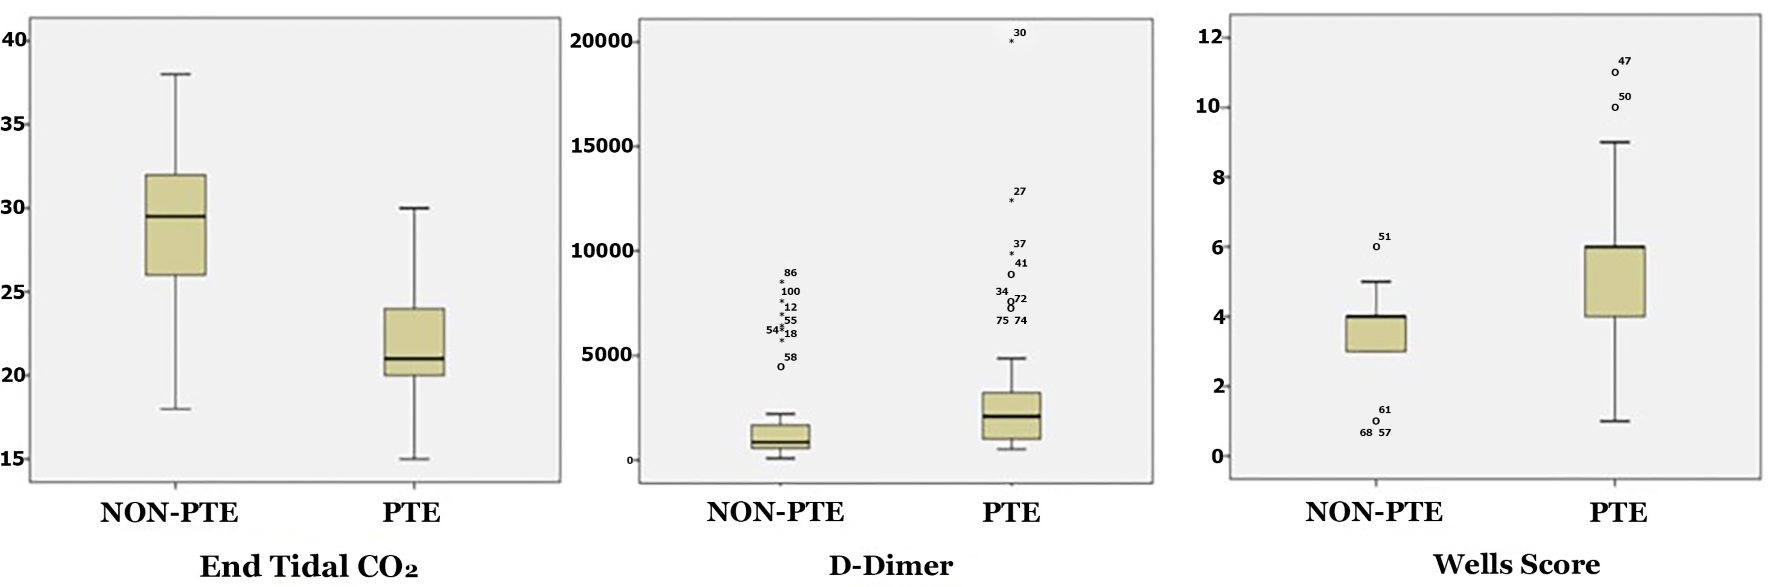
Figure 1. Comparison of ETCO2, D-dimer and Wells scores of the PE and non-PE groups. ETCO2: end-tidal carbon dioxide; PE: pulmonary embolism.
| Journal of Clinical Medicine Research, ISSN 1918-3003 print, 1918-3011 online, Open Access |
| Article copyright, the authors; Journal compilation copyright, J Clin Med Res and Elmer Press Inc |
| Journal website http://www.jocmr.org |
Original Article
Volume 11, Number 10, October 2019, pages 696-702
Is Bedside End-Tidal CO2 Measurement a Screening Tool to Exclude Pulmonary Embolism in Emergency Department?
Figures
Tables
| PE, mean ± SD/n (%) | Non-PE, mean ± SD/n (%) | P | |
|---|---|---|---|
| PE: pulmonary embolism; HT: hypertension; DM: diabetes mellitus; CAD: coronary artery disease; CHF: chronic heart failure; DVT: deep vein thrombosis; CVA: cerebrovascular accident. | |||
| Age | 66.3 ± 18.6 | 66 ± 14.9 | 0.920 |
| Female | 32 (64) | 22 (44) | 0.045 |
| Male | 18 (36) | 28 (56) | |
| Comorbidity | |||
| HT | 29 (58) | 23 (460) | 0.230 |
| DM | 16 (32) | 13 (26) | 0.509 |
| CAD | 10 (20) | 13 (26) | 0.476 |
| CHF | 10 (20) | 8 (16) | 0.603 |
| DVT | 11 (22) | 6 (12) | 0.183 |
| Malignancy | 7 (14) | 9 (18) | 0.585 |
| CVA | 6 (12) | 2 (4) | 0.269 |
| Admission symptom | |||
| Dyspnea | 25 (50) | 28 (56) | 0.224 |
| Chest pain | 22 (44) | 18 (36) | |
| Hemoptysis | 2 (4) | 0 | |
| Palpitation | 1 (2) | 4 (8) | |
| Intubation status | |||
| Yes | 0 | 2 (4) | 0.153 |
| No | 50 (100) | 48 (96) | |
| Blood pressure | |||
| Hypertensive | 8 (16) | 4 (8) | 0.062 |
| Normotensive | 38 (76) | 34 (68) | |
| Hypotensive | 4 (8) | 12 (24) | |
| Pulse rate | |||
| > 120 | 8 (16) | 14 (28) | 0.350 |
| 100 - 120 | 29 (58) | 25 (50) | |
| < 100 | 13 (26) | 11 (22) | |
| Respiratory rate | |||
| > 20 | 22 (44) | 29 (58) | 0.359 |
| 12 - 20 | 26 (52) | 19 (38) | |
| < 12 | 2 (4) | 2 (4) | |
| Body temperature | |||
| Hyperthermia | 10 (20) | 4 (8) | 0.084 |
| Normothermia | 40 (80) | 46 (92) | |
| Blood gas analysis | |||
| pH | 7.41 ± 0.08 | 7.42 ± 0.07 | 0.448 |
| pO2 | 62.15 ± 10.49 | 67.85 ± 10.20 | 0.007 |
| pCO2 | 33.46 ± 6.22 | 32.70 ± 6.85 | 0.559 |
| HCO3 | 20.65 ± 3.65 | 21.43 ± 3.88 | 0.308 |
| Outcome | |||
| Admitted | 20 (40) | 50 (100) | < 0.001 |
| Discharged | 30 (60) | 0 | |
| Wells risk score | CT angiography | P | |
|---|---|---|---|
| PE, n (%) | Non-PE, n (%) | ||
| PE: pulmonary embolism; CT: computed tomography. | |||
| < 2 (low risk) | 9 (18) | 23 (46) | > 0.001 |
| 2 - 6 (moderate risk) | 31 (62) | 27 (54) | > 0.001 |
| ≥ 7 (high risk) | 10 (20) | 0 | < 0.001 |
| PE, median (IQR) | Non-PE, median (IQR) | P | |
|---|---|---|---|
| ETCO2: end-tidal carbon dioxide; PE: pulmonary embolism; IQR: interquartile range. | |||
| ETCO2 | 21 (4) | 28.5 (6) | < 0.001 |
| D-dimer | 2,091 (2,332) | 850.5 (1,152) | < 0.001 |
| Area | Cut-off | Sensitivity | Specificity | PPV | NPV | |
|---|---|---|---|---|---|---|
| PE: pulmonary embolism; ETCO2: end-tidal carbon dioxide; PPV: positive predictive value; NPV: negative predictive value. | ||||||
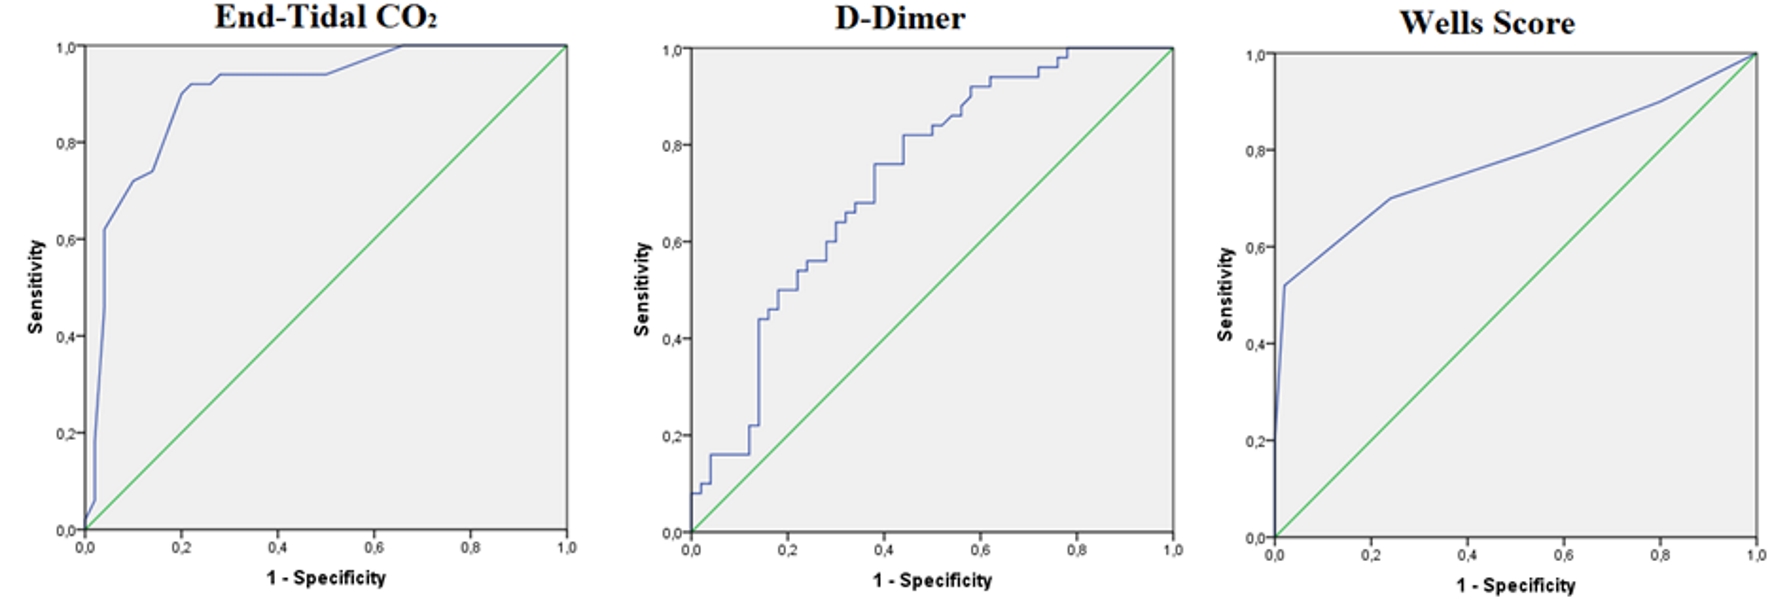
| ETCO2 | 0.901 | 34 mm Hg | 100% | 8% | 52.1% | 100% |
| D-dimer | 0.730 | 500 ng/mL | 100% | 18% | 54.9% | 100% |
| Wells score | 0.777 | 4 | 80% | 46% | 59.7% | 69.7% |
| B | SE | P | Odds ratio | 95% CI for odds ratio | ||
|---|---|---|---|---|---|---|
| Lower | Upper | |||||
| PE: pulmonary embolism; ETCO2: end-tidal carbon dioxide; SE: standard error; CI: confidence interval. | ||||||
| Age | -0.018 | 0.024 | 0.458 | 0.982 | 0.937 | 1.030 |
| Sex | 0.487 | 0.710 | 0.493 | 1.627 | 0.405 | 6.545 |
| pH | 4.323 | 7.249 | 0.551 | 75.433 | 0.000 | 111,697,648.876 |
| pO2 | -0.086 | 0.042 | 0.037 | 0.917 | 0.845 | 0.995 |
| pCO2 | 0.036 | 0.091 | 0.692 | 1.037 | 0.868 | 1.238 |
| HCO3 | -0.048 | 0.133 | 0.717 | 0.953 | 0.735 | 1.236 |
| D-dimer | 0.000 | 0.000 | 0.092 | 1.000 | 1.000 | 1.001 |
| Wells | 2.027 | 0.720 | 0.005 | 7.589 | 1.850 | 31.135 |
| ETCO2 | -0.519 | 0.113 | 0.000 | 0.595 | 0.477 | 0.743 |
| Constat | -17.017 | 54.448 | 0.755 | 0.000 | ||