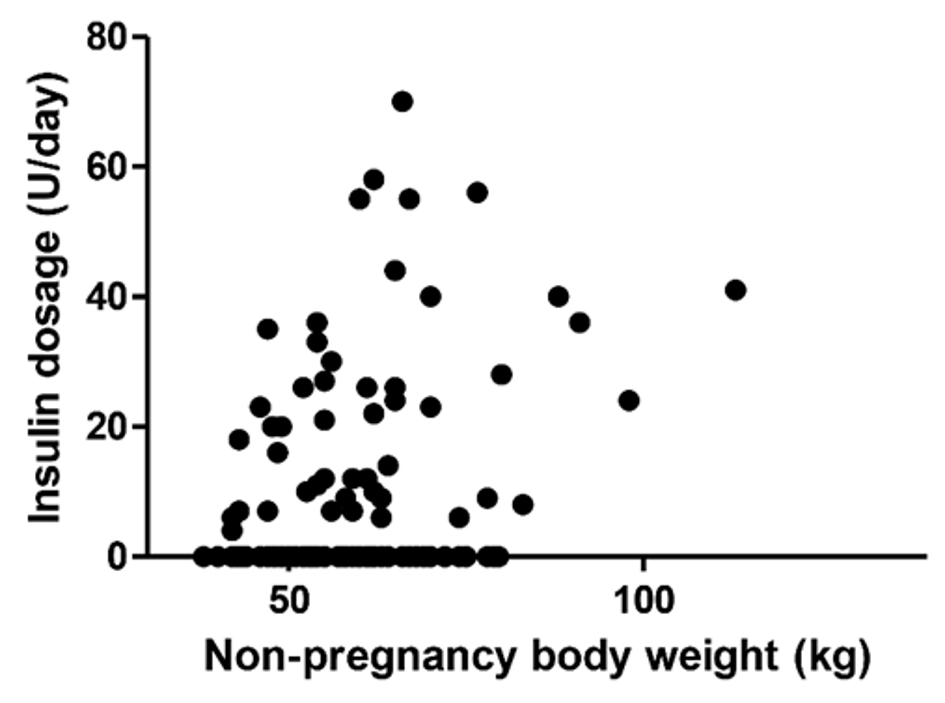
Figure 1. Correlation between non-pregnancy body weight (kg) and insulin dosage (units/day) (r = 0.360, P = 0.012).
| Journal of Clinical Medicine Research, ISSN 1918-3003 print, 1918-3011 online, Open Access |
| Article copyright, the authors; Journal compilation copyright, J Clin Med Res and Elmer Press Inc |
| Journal website http://www.jocmr.org |
Original Article
Volume 11, Number 6, June 2019, pages 447-451
Background Factors Determining the Introduction and Dosage of Insulin in Women With Gestational Diabetes Mellitus
Figure
Tables
| Item | Mean ± SD |
|---|---|
| 75-g OGTT: 75-g oral glucose tolerance test. | |
| Age (years) | 34.4 ± 4.5 |
| Insulin introduction (with/without) | 51 (45%)/63 (55%) |
| Bolus insulin used (units/day) | 10 ± 15.8 |
| Family history of diabetes mellitus (with/without) | 48 (42%)/66 (58%) |
| Non-pregnancy body weight (kg) | 60.1 ± 12.6 |
| Number of weeks of pregnancy at the time of diagnosis (weeks) | 22 ± 6 |
| Body weight at the time of delivery (kg) | 66.3 ± 12.0 |
| Apgar score at 1 min | 7.89 ± 0.71 |
| Apgar score at 5 min | 8.87 ± 0.56 |
| Newborn weight (g) | 2,761 ± 446 |
| Placental weight (g) | 585 ± 177 |
| Six-divided diet (with/without) | 66 (58%)/48 (42%) |
| Number of positive 75-g OGTT results (once vs. twice or thrice) | 80/34 |
| Insulin non-introduction group (63 patients) | Insulin introduction group (51 patients) | P value | |
|---|---|---|---|
| Age (years) | 34.2 ± 4.50 | 34.6 ± 4.60 | 0.619 |
| Family history of diabetes mellitus (with/without) | 22/41 | 26/25 | 0.091 |
| Non-pregnancy body weight (kg) | 59 (51.5 - 67.5) | 59 (52.3 - 65.5) | 0.78 |
| Body weight at the time of delivery (kg) | 64.9 (57.6 - 74.0) | 66.4 (58.1 - 73.3) | 0.843 |
| Obesity (with/without) | 28/35 | 16/35 | 0.179 |
| Apgar score at 1 min | 8 (8 - 8) | 8 (8 - 8) | 0.794 |
| Apgar score at 5 min | 9 (9 - 9) | 9 (9 - 9) | 0.708 |
| Newborn weight (g) | 2,800 (2,681 - 3,047) | 2,720 (2,452 - 3,082) | 0.582 |
| Placental weight (g) | 544 (493 - 596) | 572 (491 - 660) | 0.326 |
| Six-divided diet (with/without) | 26/37 | 40/11 | < 0.001 |
| Number of positive 75-g OGTT results (once vs. twice or thrice) | 46/17 | 28/23 | 0.051 |
| Univariate analysis | |||
|---|---|---|---|
| OR | 95% CI | P value | |
| With/without family history | 1.94 | 0.91 - 4.12 | 0.086 |
| With/without late-in-life pregnancy | 1.02 | 0.94 - 1.11 | 0.616 |
| With/without obesity | 1.04 | 0.96 - 1.12 | 0.325 |
| Number of positive 75-g OGTT results | 2.04 | 1.09 - 3.81 | 0.026 |
| Multivariate analysis | |||
| OR | 95% CI | P value | |
| Number of positive 75-g OGTT results | 2.04 | 1.09 - 3.81 | 0.025 |
| Univariate analysis | |||||||
|---|---|---|---|---|---|---|---|
| Estimate | Std. Er | P value | |||||
| Age (years) | 0.224 | 0.331 | 0.500 | ||||
| Body weight at the time of delivery | 0.33 | 0.120 | 0.007 | ||||
| Non-pregnancy body weight (kg) | 0.33 | 0.114 | 0.005 | ||||
| Placental weight (g) | 0.014 | 0.01 | 0.164 | ||||
| Multivariate analysis | |||||||
| Estimate | Std. Er | P value | |||||
| Std. Er: standard error. | |||||||
| Non-pregnancy body weight (kg) | 0.33 | 0.114 | 0.005 | ||||