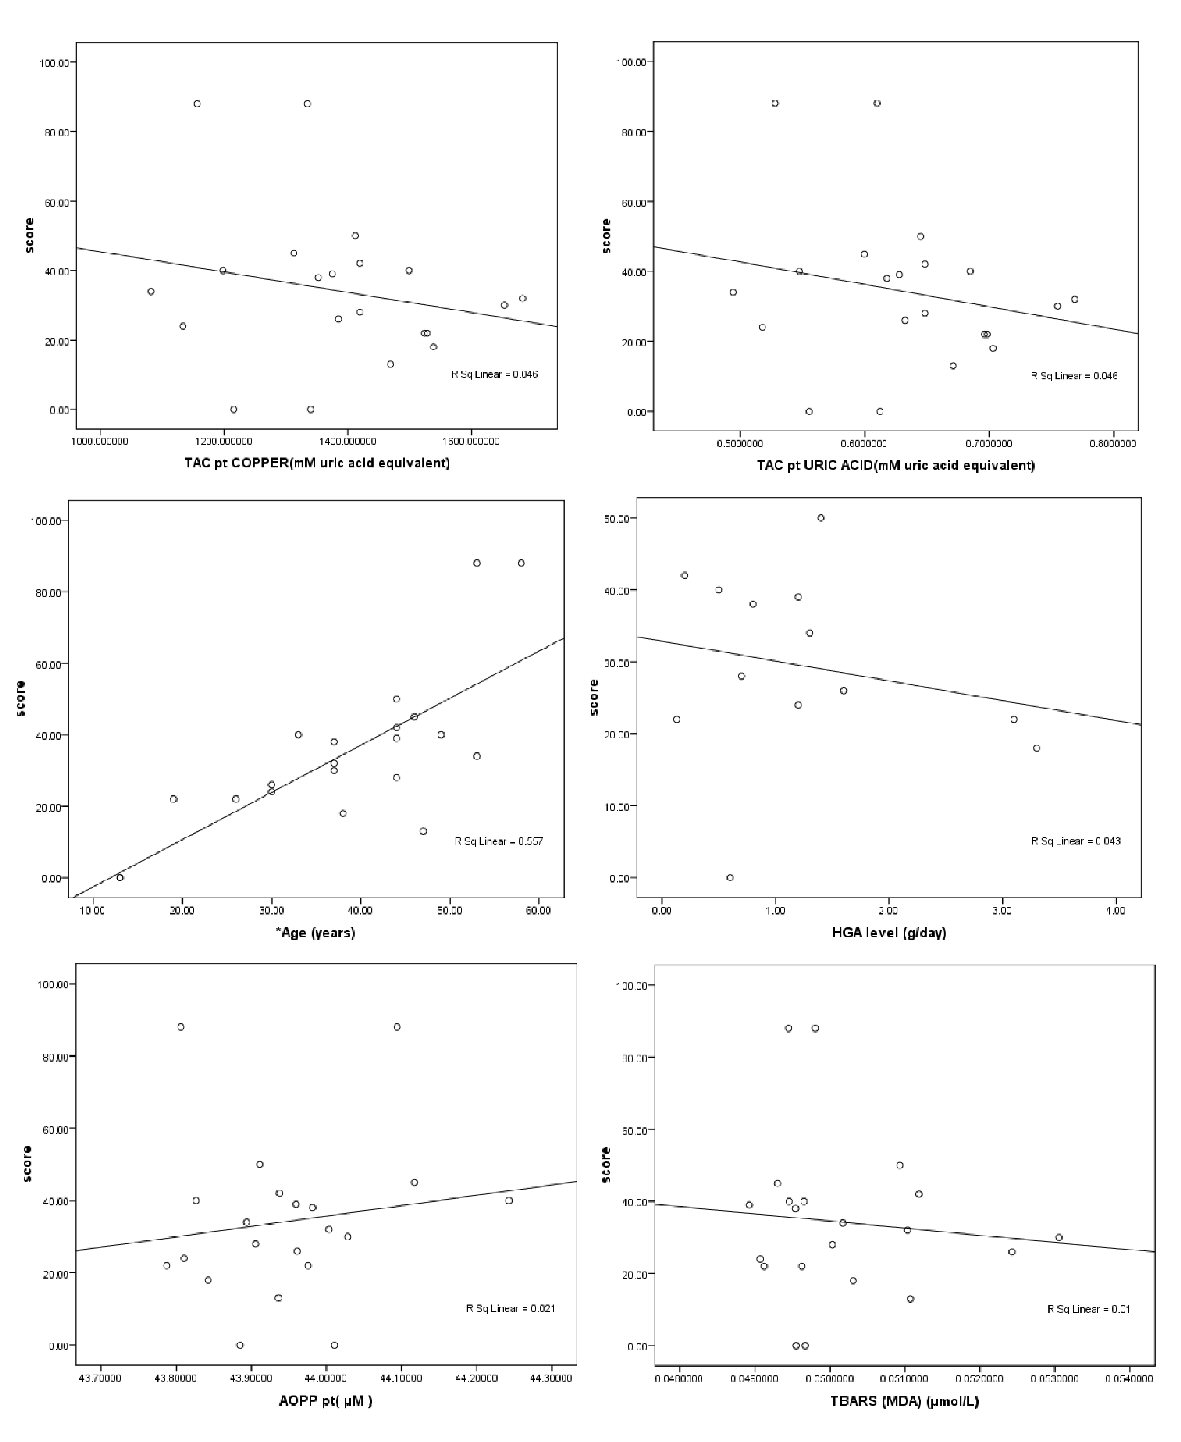
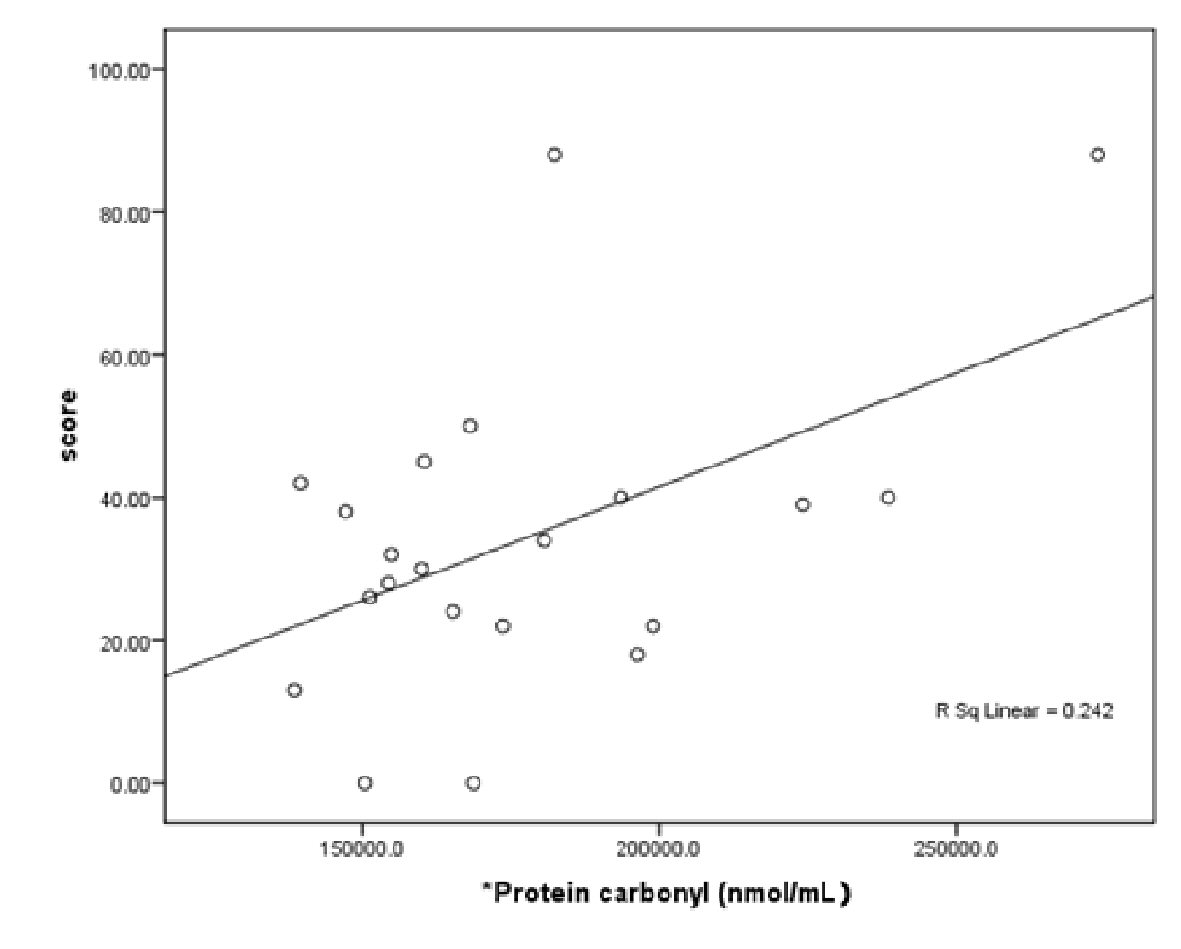
Figure 1. Scatter plot of the patient’s age, patients’ plasma TAC, TBARS, AOPP and HGA levels with disease severity score in the AKU patients.
| Journal of Clinical Medicine Research, ISSN 1918-3003 print, 1918-3011 online, Open Access |
| Article copyright, the authors; Journal compilation copyright, J Clin Med Res and Elmer Press Inc |
| Journal website http://www.jocmr.org |
Original Article
Volume 11, Number 5, May 2019, pages 337-344
Serum Oxidative-Antioxidative Status in Patients With Alkaptonuria
Figures
Tables
| Clinical features/symptoms | N (%) |
|---|---|
| Dark urine | 21 (100%) |
| Pigmentation of skin, outer ear and sclera of the eye | 16 (76%) |
| Teeth pigmentation | 19 (90%) |
| Morning stiffness and back pain due to degenerate arthropathy | 21 (100%) |
| Arthropathy of large joints (hips and shoulders) | 21 (100%) |
| Knees pain | 13 (62%) |
| Kidney stones | 13 (62%) |
| Prostate stones | 5 (24%) |
| Aortic stenosis | 1 (5%) |
| Ruptures of muscles, tendons and ligaments | 1 (5%) |
| Knee joint replacement | 1 (5%) |
| Foot pain and swelling of small joints (interphalangeal joints) | 1 (5%) |
| Variable | Patientsa | Controla | Mann-Whitney U | P value |
|---|---|---|---|---|
| Patient score and urine HGA were null in controls. aData are means ± standard deviation (SD). *P value < 0.05 versus healthy subjects. | ||||
| Age (years) | 37.86 ± 12.59 | 36.00 ± 10.62 | 174.5 | 0.496 |
| Sex (F/M) | 4/17 | 6/13 | ||
| TAC (nmol/µL copper reducing equivalent) | 13.82 ± 1.63 | 8.92 ± 1.63 | 6 | 0.00* |
| TAC (nmol/µL uric acid equivalent) | 0.63 ± 0.074 | 0.41 ± 0.074 | 6 | 0.00* |
| TBARS (MDA) (µmol/L) | 0.050 ± 0.001 | 0.049 ± 0.0005 | 84.5 | 0.002* |
| Protein carbonyl (nmol/mL) | 1.87 ± 0.34 | 1.77 ± 0.23 | 134 | 0.076 |
| AOPP (µmol/mL) | 4.39 ± 0.11 | 4.39 ± 0.14 | 161 | 0.297 |
| HGA level (g/day) | 1.23 ± 0.98 | - | - | - |
| Disease severity score | 34.24 ± 22.25 | - | - | - |
| Variable | Disease severity score | |
|---|---|---|
| Spearman’s correlation (r) | P value | |
| *P value < 0.05. | ||
| Disease severity score | 1 | |
| Age (years) | 0.557 | 0.000* |
| TAC (nmol/µL copper reducing equivalent) | -0.046 | 0.353 |
| TAC (nmol/µL uric acid equivalent) | -0.046 | 0.353 |
| TBARS (MDA) (µmol/L) | -0.098 | 0.673 |
| Protein carbonyl (nmol/mL | 0.242 | 0.024* |
| AOPP (µmol/mL) | 0.021 | 0.530 |
| HGA level (g/day) | -0.043 | 0.494 |
| Model | Unstandardized coefficients | Standardized coefficients | P value | 95% confidence interval for B | ||
|---|---|---|---|---|---|---|
| B | SE | Beta | Lower bound | Upper bound | ||
| SE: standard error. *P value < 0.05. | ||||||
| Constant | 22.239 | 23.343 | 0.353 | -71.1 | 26.620 | |
| Protein Carbonyl(PC) | 0 | 0 | 0.492 | 0.024* | 0.000 | 0.001 |