Journal of Clinical Medicine Research, ISSN 1918-3003 print, 1918-3011 online, Open Access |
Article copyright, the authors; Journal compilation copyright, J Clin Med Res and Elmer Press Inc |
Journal website http://www.jocmr.org |
Original Article
Volume 11, Number 4, April 2019, pages 267-274
Renoprotective Effects of Additional SGLT2 inhibitor Therapy in Patients With Type 2 Diabetes Mellitus and Chronic Kidney Disease Stages 3b-4: A Real World Report From A Japanese Specialized Diabetes Care Center
Figures
Tables
Patients (n = 42) | |
---|---|
SGLT2i: sodium glucose co-transporter 2 inhibitor; Dapa: dapagliflozin; Empa: empagliflozin; Cana: canagliflozin; Luse: Luseogliflozin; Tofo: tofogliflozin; ACEI: angiotensin converting enzyme inhibitor; ARB: angiotensin-II receptor blocker; eGFR: estimated glomerular filtration rate. | |
Age (years) | 64.8 ± 9.8 |
Sex: male (%) | 30 (71.4) |
Body mass index (kg/m2) | 28.2 ± 3.6 |
Hypertension (%) | 40 (95.2) |
Dyslipidemia (%) | 40 (95.2) |
Current smoking (%) | 9 (21.4) |
Retinopathy (%) | 26 (61.9) |
Cerebrovascular/cardiovascular diseases (%) | 10 (23.8) |
Duration of diabetes (years) | 18.0 ± 7.4 |
Hemoglobin A1c (%) | 7.6 (7.1 - 8.2) |
Fasting plasma glucose (mg/dL) (n = 21) | 158 (129 - 193) |
Anti-diabetic drugs | - |
Sulfonylureas (%) | 9 (21.4) |
Glinide (%) | 1 (2.4) |
Metformin (%) | 21 (50.0) |
Alpha-glucosidase inhibitor (%) | 8 (19.0) |
Thiazolidinedione (%) | 5 (11.9) |
Dipeptidyl peptidase-4 inhibitor (%) | 10 (23.8) |
Glucagon like peptide-1 receptor agonist (%) | 9 (21.4) |
Insulin (%) | 30 (71.4) |
Additional SGLT2i (Dapa/Empa/Cana/Luse/Tofo) (%) | 33.0/19.0/4.8/31.0/11.9 |
Treatment duration of SGLT2i (months) | 21.5 (15.0 - 31.0) |
Treatment with ACEI or ARB (%) | 30 (71.4) |
Treatment with diuretics including aldosterone antagonist (%) | 12 (28.6) |
eGFR (mL/min/1.73m2) | 40.4 (36.5 - 43.0) |
Chronic kidney disease: stage-4 (eGFR< 30 mL/min/1.73m2) (%) | 4 (9.5) |
Qualitative assessment of urinary protein levels (%) | - |
Negative (-) (< 15 mg/dL) | 15 (35.7) |
Borderline (±) (15 - 30 mg/dL) | 8 (19.0) |
Mild (+) (30 - 100 mg/dL) | 6 (14.3) |
Moderate (++) (100 - 300 mg/dL) | 8 (19.0) |
Severe (+++) (> 300 mg/dL) | 5 (11.9) |
SGLT2i therapy (n = 42) | P value | ||
---|---|---|---|
Baseline | 1 year | ||
SGLT2i: sodium glucose cotransporter 2 inhibitor; HbA1c: hemoglobin A1c; eGFR: estimated glomerular filtration rate; UPCR: urine protein-creatinine ratio; Cre: creatinine. Data pertaining to normally distributed variables are presented as the mean (standard deviation) and variables with a skewed distribution are presented as median (interquartile range). | |||
HbA1c (%) | 7.6 (7.1 - 8.2) | 7.5 (7.0 - 8.1) | 0.17 |
Absolute change (%) | -0.1 (-0.9 - 0.3) | ||
Fasting plasma glucose (mg/dL) (n = 11) | 158 (129 - 236) | 128 (118 - 149) | 0.02 |
Absolute change (mg/dL) | -29 (-94 - -7) | ||
Body mass index (kg/m2) | 28.2 ± 3.6 | 27.6 ± 3.6 | < 0.01 |
Absolute change (kg/m2) | -0.63 ± 1.07 | ||
Body weight (kg) | 75.0 ± 11.8 | 73.3 ± 11.3 | < 0.01 |
Absolute change (kg) | -1.7 ± 2.8 | ||
eGFR (mL/min/1.73m2) | 40.4 (36.5 - 43.0) | 41.0 (36.0 - 45.6) | 0.18 |
Absolute change (mL/min/1.73m2) | 0.3 (-0.9 - 2.7) | ||
Serum creatinine (mg/dL) | 1.38(1.25 - 1.50) | 1.35 (1.16 - 1.54) | 0.65 |
Absolute change (mg/dL) | 0.00 (-0.08 - 0.05) | ||
Serum blood urea nitrogen (mg/dL) | 19.1 (16.2 - 23.1) | 20.0 (16.2 - 25.1) | 0.38 |
Absolute change (mg/dL) | 0.5 (-2.8 - 4.3) | ||
Uric acid (mg/dL) | 5.8 ± 1.2 | 5.5 ± 1.3 | 0.20 |
Absolute change (mg/dL) | -0.45 (-1.03 - 0.40) | ||
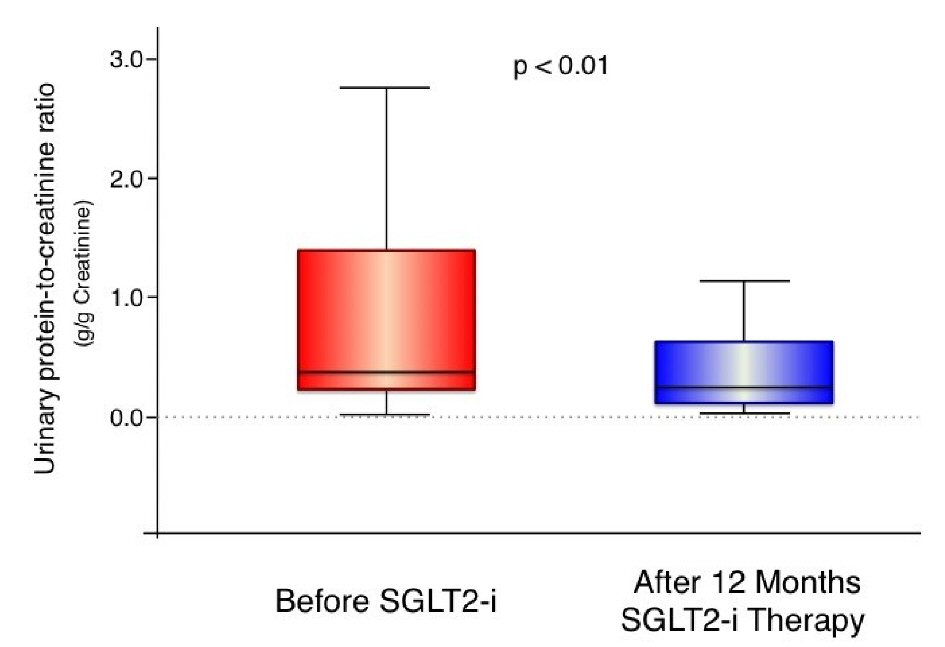
UPCR (g/g Cre) (n = 35) | 0.36 (0.20 - 1.62) | 0.23 (0.10 - 0.63) | < 0.01 |
Absolute change (g/g Cre) | -0.13 (-0.72 - -0.10) | ||
Systolic blood pressure (mm Hg) | 136.1 ± 13.2 | 128.3 ± 12.0 | < 0.01 |
Absolute change (mm Hg) | -7.8 ± 12.0 | ||
Diastolic blood pressure (mm Hg) | 75.3 ± 12.2 | 71.7 ± 9.7 | 0.01 |
Absolute change (mm Hg) | -3.5 ± 8.8 | ||
Pulse rate (beats/min) | 77.7 ± 12.5 | 77.4 ± 11.7 | 0.85 |
Absolute change (beats/min) | -0.3 ± 9.0 | ||
Hemoglobin (g/dL) | 13.6 ± 1.4 | 14.4 ± 1.4 | < 0.01 |
Absolute change (g/dL) | 0.8 ± 1.1 | ||
Hematocrit (%) | 40.5 ± 3.7 | 43.0 ± 3.6 | < 0.01 |
Absolute change (%) | 2.5 ± 3.4 |
Before SGLT2i (n = 42) | P value | After SGLT2i (n = 42) | |
---|---|---|---|
SGLT2i: sodium glucose cotransporter 2 inhibitor; eGFR: estimated glomerular filtration rate. | |||
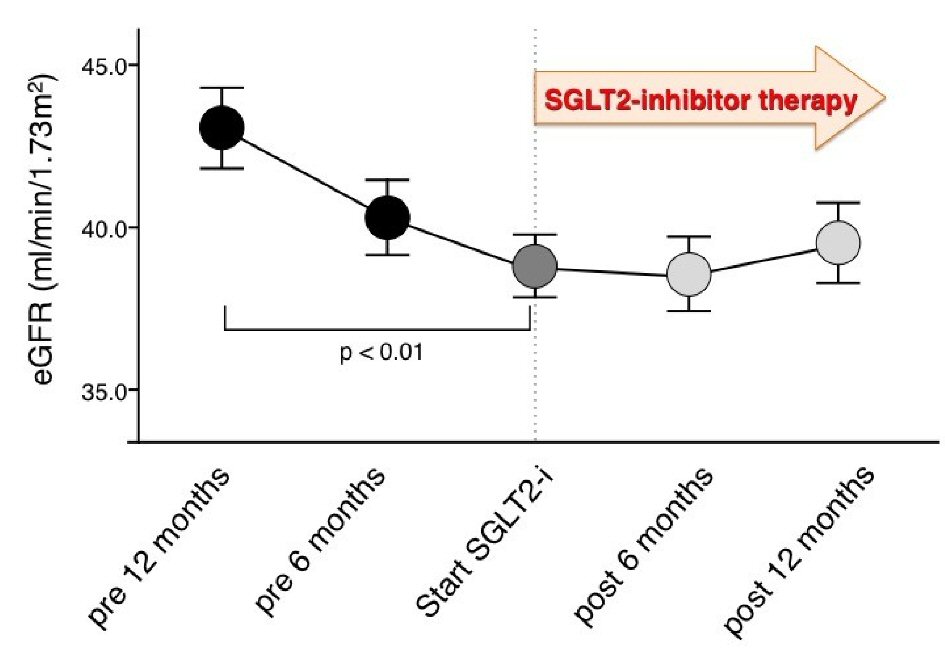
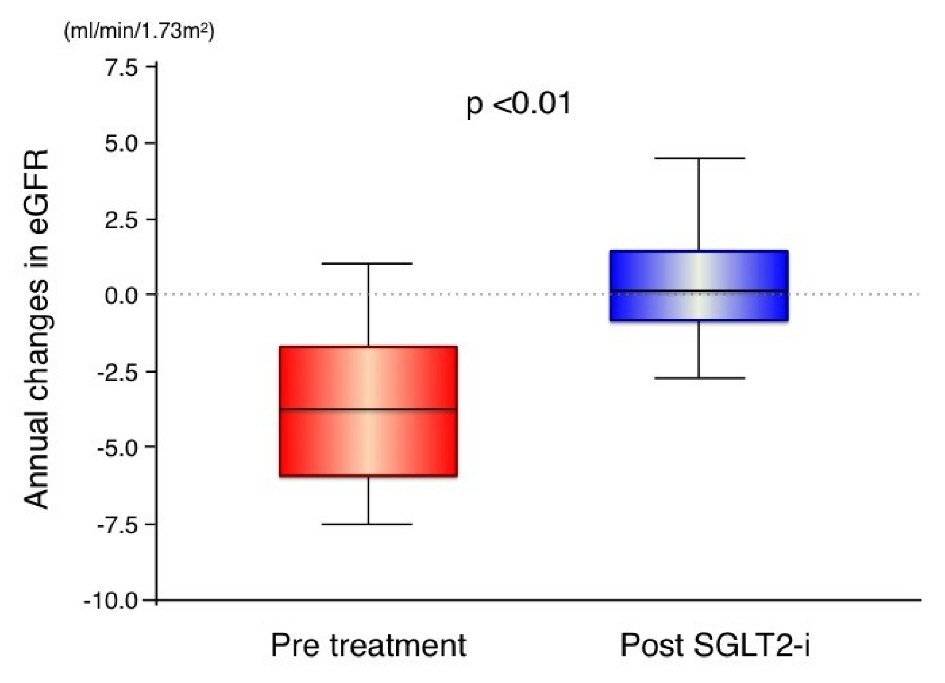
Annual changes in eGFR (mL/min/1.73m2 per year) | -3.8 (-6.0 - -1.7) | < 0.01 | 0.1 (-0.8 - 1.5) |