| Age, years, (median, IQR) | 46 (36 - 55) | 38 (27 - 51) | < 0.001 |
| Sex, male, (n, %) | 3,701 (62) | 26,540 (46) | < 0.001 |
| Race (n, %) | | | < 0.001 |
| Caucasian | 2,697 (46) | 20,690 (36) | |
| African American | 2,857 (48) | 19,283 (33) | |
| Othersa | 372 (6) | 18,091 (31) | |
| Ethnicity, Hispanic, (n, %) | 441 (7) | 16,988(30) | < 0.001 |
| Insurance, yes, (n, %)) | | | < 0.001 |
| Private/commercial | 103 (1.7) | 5,675 (10) | |
| Public/charity | 4,413 (74) | 25,994 (45) | |
| No insurance | 1,410 (24) | 26,395 (45) | |
| Mode of arrival (n, %) | | | < 0.001 |
| Private vehicle | 2,054 (35) | 42,264 (73) | |
| Healthcare assisted | 2,636 (44) | 12,964 (22) | |
| Public/other transportation | 1,236 (21) | 2,836 (5) | |
| Level of acuity (n, %) | | | < 0.001 |
| ESI-1 | 26 (0.4) | 484 (0.8) | |
| ESI-2 | 909 (15) | 8,714 (15) | |
| ESI-3 | 3,352 (57) | 36,425 (63) | |
| ESI-4 | 1,388 (23) | 11,031 (19) | |
| ESI-5 | 233 (3.9) | 1,266 (2.2) | |
| Unclassified | 18 (0.3) | 144 (0.3) | |
| History of alcohol abuse (n, %) | 3,381 (57) | 19,941 (34) | < 0.001 |
| History of substance abuse (n, %) | 2,891 (49) | 10,339 (18) | < 0.001 |
| History of psychiatric disorder(s) (n, %) | 1,894 (32) | 8,776 (15) | < 0.001 |
| ED metrics | | | |
| ED total length of stay, hours, (median, IQR) | 4 (2 - 5) | 4 (2 - 5) | < 0.001 |
| ED disposition, yes, (n, %)) | | | < 0.001 |
| Discharge | 5,376 (91) | 54,879 (95) | |
| AMA/eloped/LWBS | 550 (9) | 3,185 (5) | |
| Primary care physician referral provided, yes, (n, %) | 3,258 (55) | 21,497 (37) | < 0.001 |
| Medication prescribed at discharge, n, (median, IQR) | 1 (0 - 2) | 1 (0 - 2) | < 0.001 |
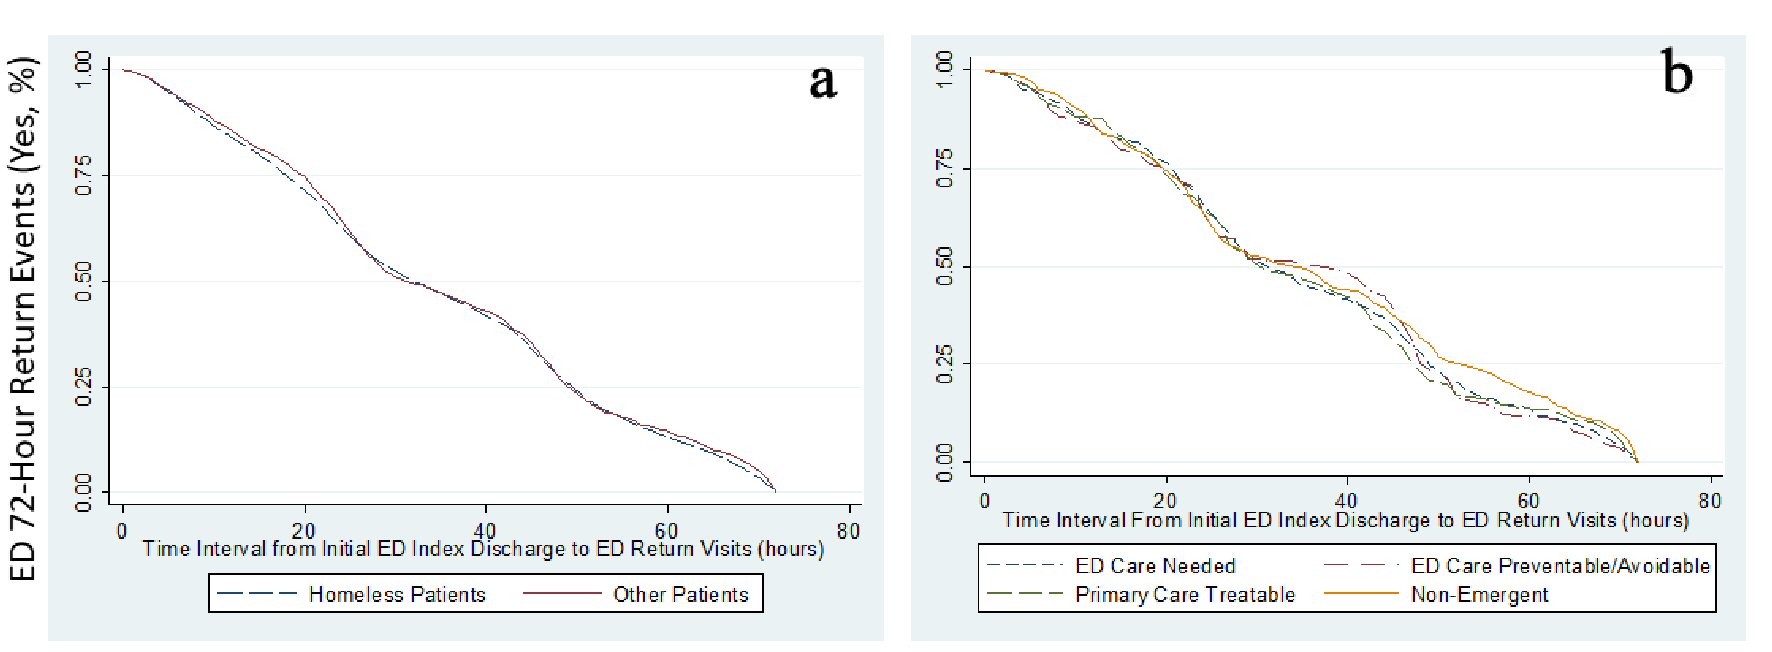
| Return to ED within 72-h, yes, (n, %) | 1,036 (17) | 3,094 (5) | < 0.001 |