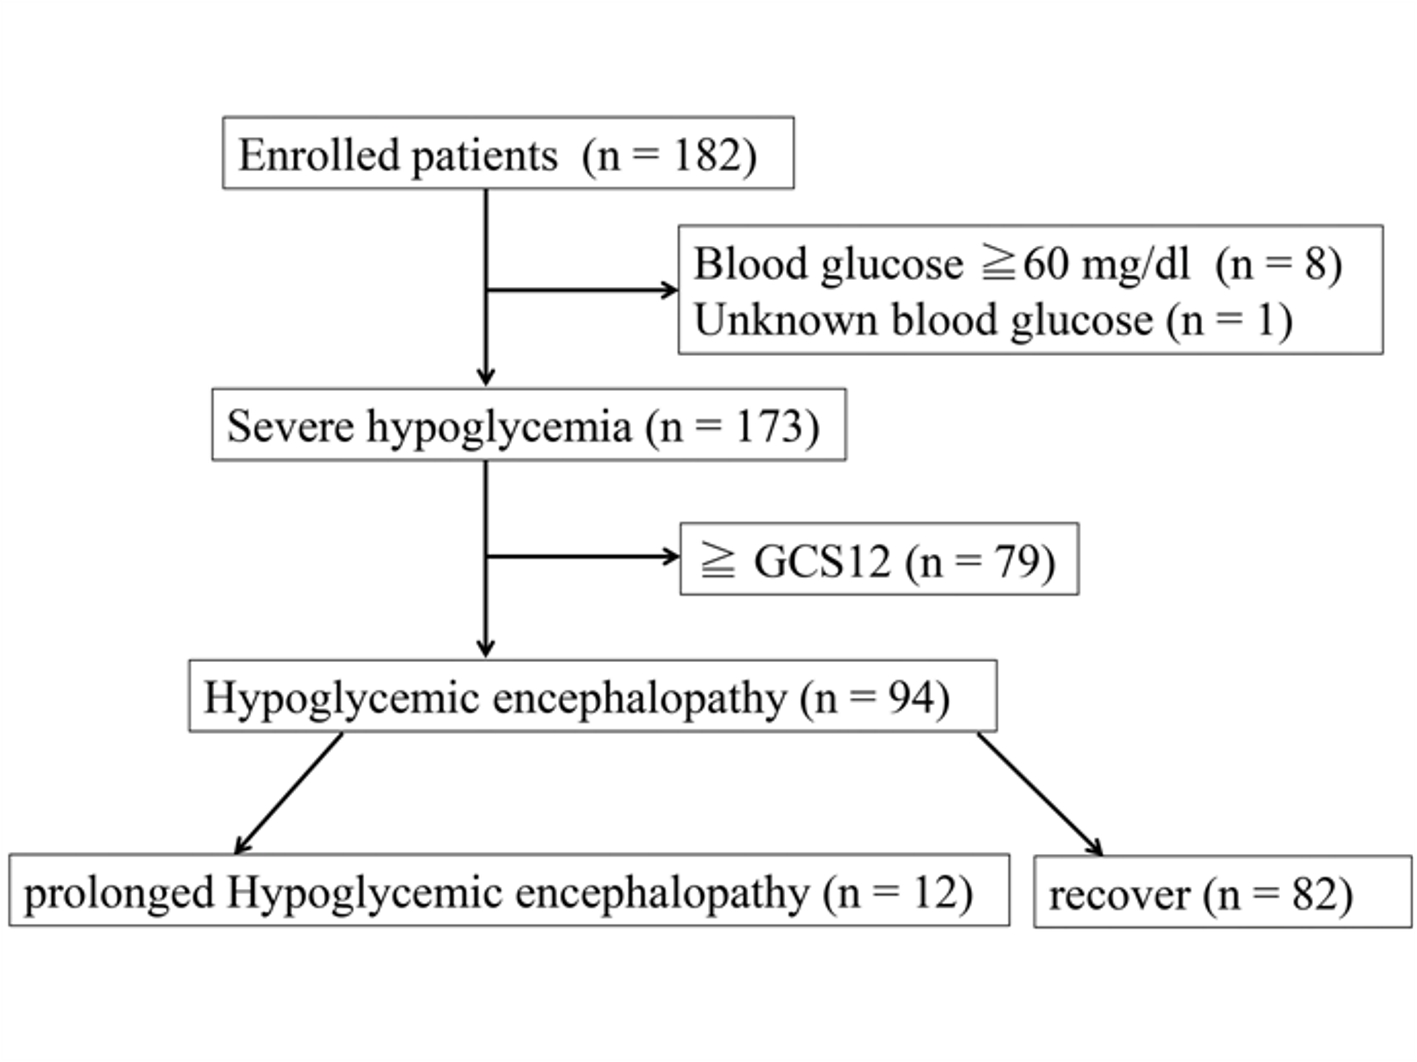
Figure 1. Flow chart of patient enrollment throughout the study.
| Journal of Clinical Medicine Research, ISSN 1918-3003 print, 1918-3011 online, Open Access |
| Article copyright, the authors; Journal compilation copyright, J Clin Med Res and Elmer Press Inc |
| Journal website http://www.jocmr.org |
Original Article
Volume 11, Number 3, March 2019, pages 213-218
Risk Factors of Hypoglycemic Encephalopathy and Prolonged Hypoglycemia in Patients With Severe Hypoglycemia
Figures
Tables
| Overall clinical parameters | |
|---|---|
| Data are expressed as mean ± standard deviation (SD), and skewed variables are described as median and interquartile range. BMI: body mass index; HbA1c: glycated hemoglobin; eGFR: estimated glomerular filtration rate. | |
| Type of diabetes | |
| Type 1 diabetes, n (%) | 33 (19.1) |
| Type 2 diabetes, n (%) | 119 (68.8) |
| Others, n (%) | 21 (12.1) |
| Age (years) | 73 (64 - 81) |
| Male, n (%) | 89 (51.4) |
| Duration of diabetes (years) | 20.1 ± 10.5 |
| BMI (kg/m2) | 22.8 ± 4.4 |
| eGFR (mL/min/1.73 m2) | 56.8 (26.6 - 78.5) |
| Blood glucose (mg/dL) | 32.1 ± 11.1 |
| HbA1c (%) | 7.2 (6.2 - 7.9) |
| Causes of hypoglycemia | |
| Medication, n (%) | 168 (97.1) |
| Alcohol abuse, n | 1 (0.6) |
| Others, n | 4 (2.3) |
| Severe complications | |
| No, n (%) | 162 (93.6) |
| Yes, n (%) | 11 (6.4) |
| Complications, n | |
| Cardiovascular disease | 2 |
| Death | 7 |
| Others (fracture, subdural hemorrhage) | 2 |
| Prior history of severe hypoglycemia | |
| No, n (%) | 130 (75.1) |
| Yes, n (%) | 43 (24.9) |
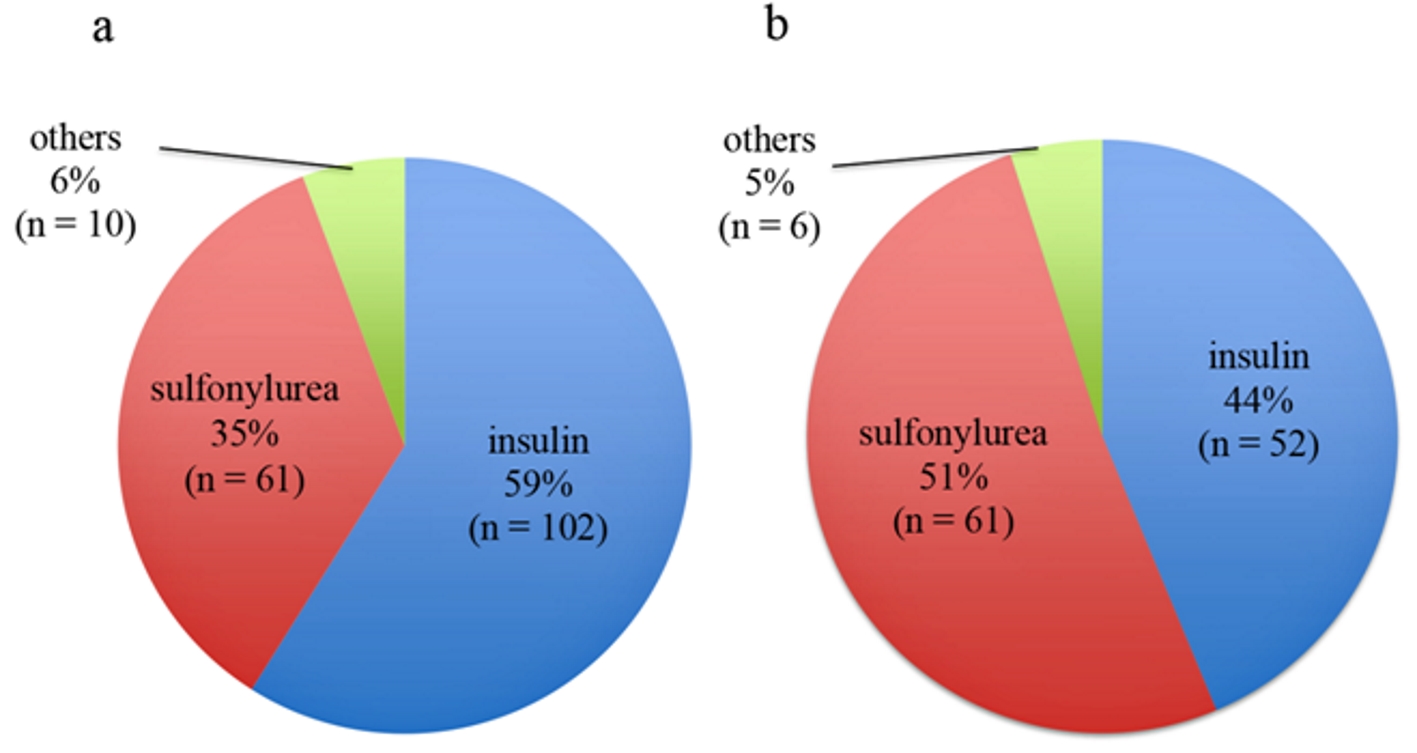
| Insulin (n = 102) | Sulfonylurea (n = 61) | Other (n = 10) | |
|---|---|---|---|
| eGFR: estimated glomerular filtration rate. *P < 0.001 vs. insulin users. | |||
| Age (years) | 69 (57.3 - 79) | 77 (72.0 - 84)* | 74 (68.5 - 80.8) |
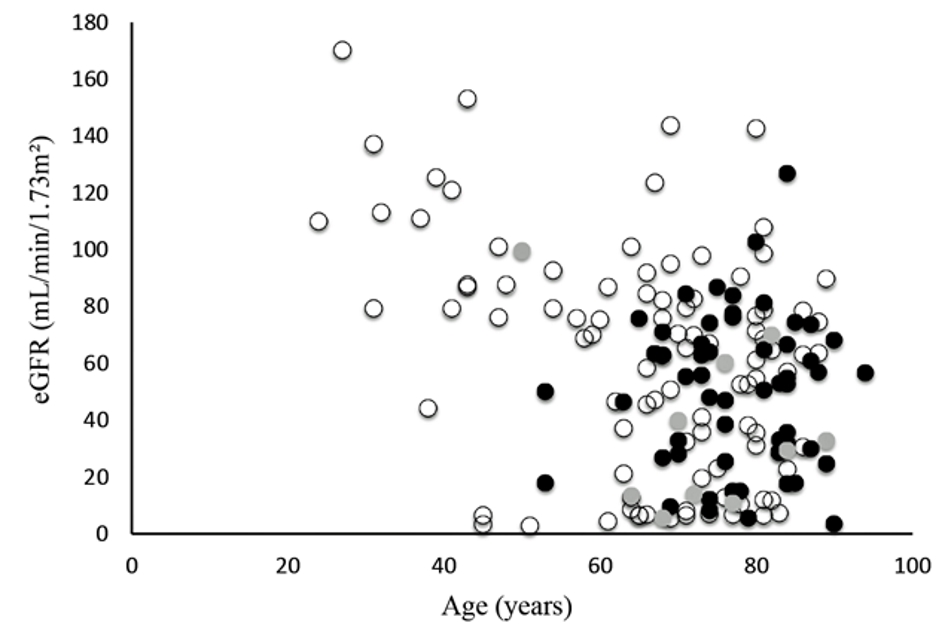
| eGFR (mL/min/1.73 m2) | 64.9 (27.4 - 86.7) | 52.9 (28.3 - 67.4) | 31.0 (13.6 - 55.1) |
| Clinical parameters | HE (n = 94) | GCS ≥ 12 (n = 79) | P value | Presence of data (%) |
|---|---|---|---|---|
| Data are expressed as mean ± standard deviation (SD), and skewed variables are described as median and interquartile range. eGFR: estimated glomerular filtration rate. | ||||
| Type 1 diabetes (%) | 15 (16.0) | 18 (22.8) | 0.319 | |
| Age (years) | 73 (66.3 - 81) | 72 (63.5 - 80.5) | 0.364 | |
| Sex (male, n/female, n) | 49/45 | 40/39 | 0.845 | |
| Causes of hypoglycemia | ||||
| Medication, n | 91 | 77 | ||
| Alcohol abuse, n | 1 | 0 | ||
| Others, n | 2 | 2 | ||
| Causative drugs | ||||
| Insulin-induced, n (%) | 53 (56.4) | 49 (62.0) | ||
| Sulfonylurea induced, n (%) | 35 (37.2) | 26 (32.9) | ||
| Others, n (%) | 6 (6.4) | 4 (5.1) | ||
| Time to hospital (min) | 41 (31 - 49.8) | 39 (31 - 52.0) | 0.577 | 86.2/82.3 |
| Blood glucose (mg/dL) | 28.8 ± 11.3 | 36.0 ± 9.7 | < 0.001 | 100/100 |
| eGFR (mL/min/1.73 m2) | 63.1 (28.75 - 79.2) | 49.9 (21.1 - 74.6) | 0.286 | 93.6/92.4 |
| Body temperature (°C) | 35.8 (35.4 - 36.5) | 36.0 (35.7 - 36.3) | 0.812 | 78.7/78.5 |
| Lactic acid (mmol/L) | 11.8 (9.6 - 16.35) | 9.5 (8.2 - 13.7) | 0.176 | 54.3/21.5 |
| Sodium (mEq/L) | 138.5 ± 4.7 | 139.2 ± 4.4 | 0.346 | 97.9/94.9 |
| Potassium (mEq/L) | 3.9 ± 0.8 | 4.1 ± 1.0 | 0.226 | 97.9/94.9 |
| Prior history of severe hypoglycemia, n (%) | 25 (26.6) | 18 (22.8) | 0.563 | |
| Clinical parameters | Prolonged (n = 12) | Recovered (n = 82) | P value | Presence of data (%) |
|---|---|---|---|---|
| Data are expressed as mean ± standard deviation (SD), and skewed variables are described as median and interquartile range. SU: sulfonylurea; eGFR: estimated glomerular filtration rate. | ||||
| Type 1 diabetes, n (%) | 1 (8.3) | 14 (17.1) | 1.000 | 75/90.2 |
| Age (years) | 73 (65.5 - 82.5) | 73 (67.0 - 80.8) | 0.883 | |
| Sex (male, n/female, n) | 6/6 | 43/39 | 1.000 | |
| Causes of hypoglycemia | ||||
| Medication, n | 10 | 81 | ||
| Alcohol abuse, n | 1 | 0 | ||
| Others, n | 1 | 1 | ||
| Causative drugs | ||||
| Insulin induced, n (%) | 5 (41.7) | 48 (58.5) | ||
| Sulfonylurea induced, n (%) | 4 (33.3) | 31 (37.8) | ||
| Others, n (%) | 3 (25.0) | 3 (3.7) | ||
| Time to hospital (min) | 54 (41.0 - 79.5) | 41 (30.5 - 48.0) | 0.051 | 91.7/86.6 |
| Blood glucose (mg/dL) | 22.2 ± 14.1 | 29.8 ±10.6 | 0.028 | 100/100 |
| eGFR (mL/min/1.73 m2) | 69.7 ± 27.5 | 56.7 ± 37.3 | 0.250 | 100/92.7 |
| Body temperature (°C) | 36.6 ± 1.15 | 35.8 ± 0.66 | 0.002 | 83.3/78.0 |
| < 35 (°C), n (%) | 0 (0) | 6 (8.8) | 0.587 | |
| Lactic acid (mmol/L) | 17.2 (12.25 - 22.6) | 11.3 (8.9 - 14.6) | 0.084 | 91.7/48.8 |
| Sodium (mEq/L) | 140 (132.8 - 141.5) | 140 (137.0 - 141.0) | 0.820 | 100/97.6 |
| Potassium (mEq/L) | 4.00 ± 0.81 | 3.8 ± 0.76 | 0.574 | 100/97.6 |
| Prior history of severe hypoglycemia, n (%) | 3 (25) | 22 (26.8) | 1.000 | |