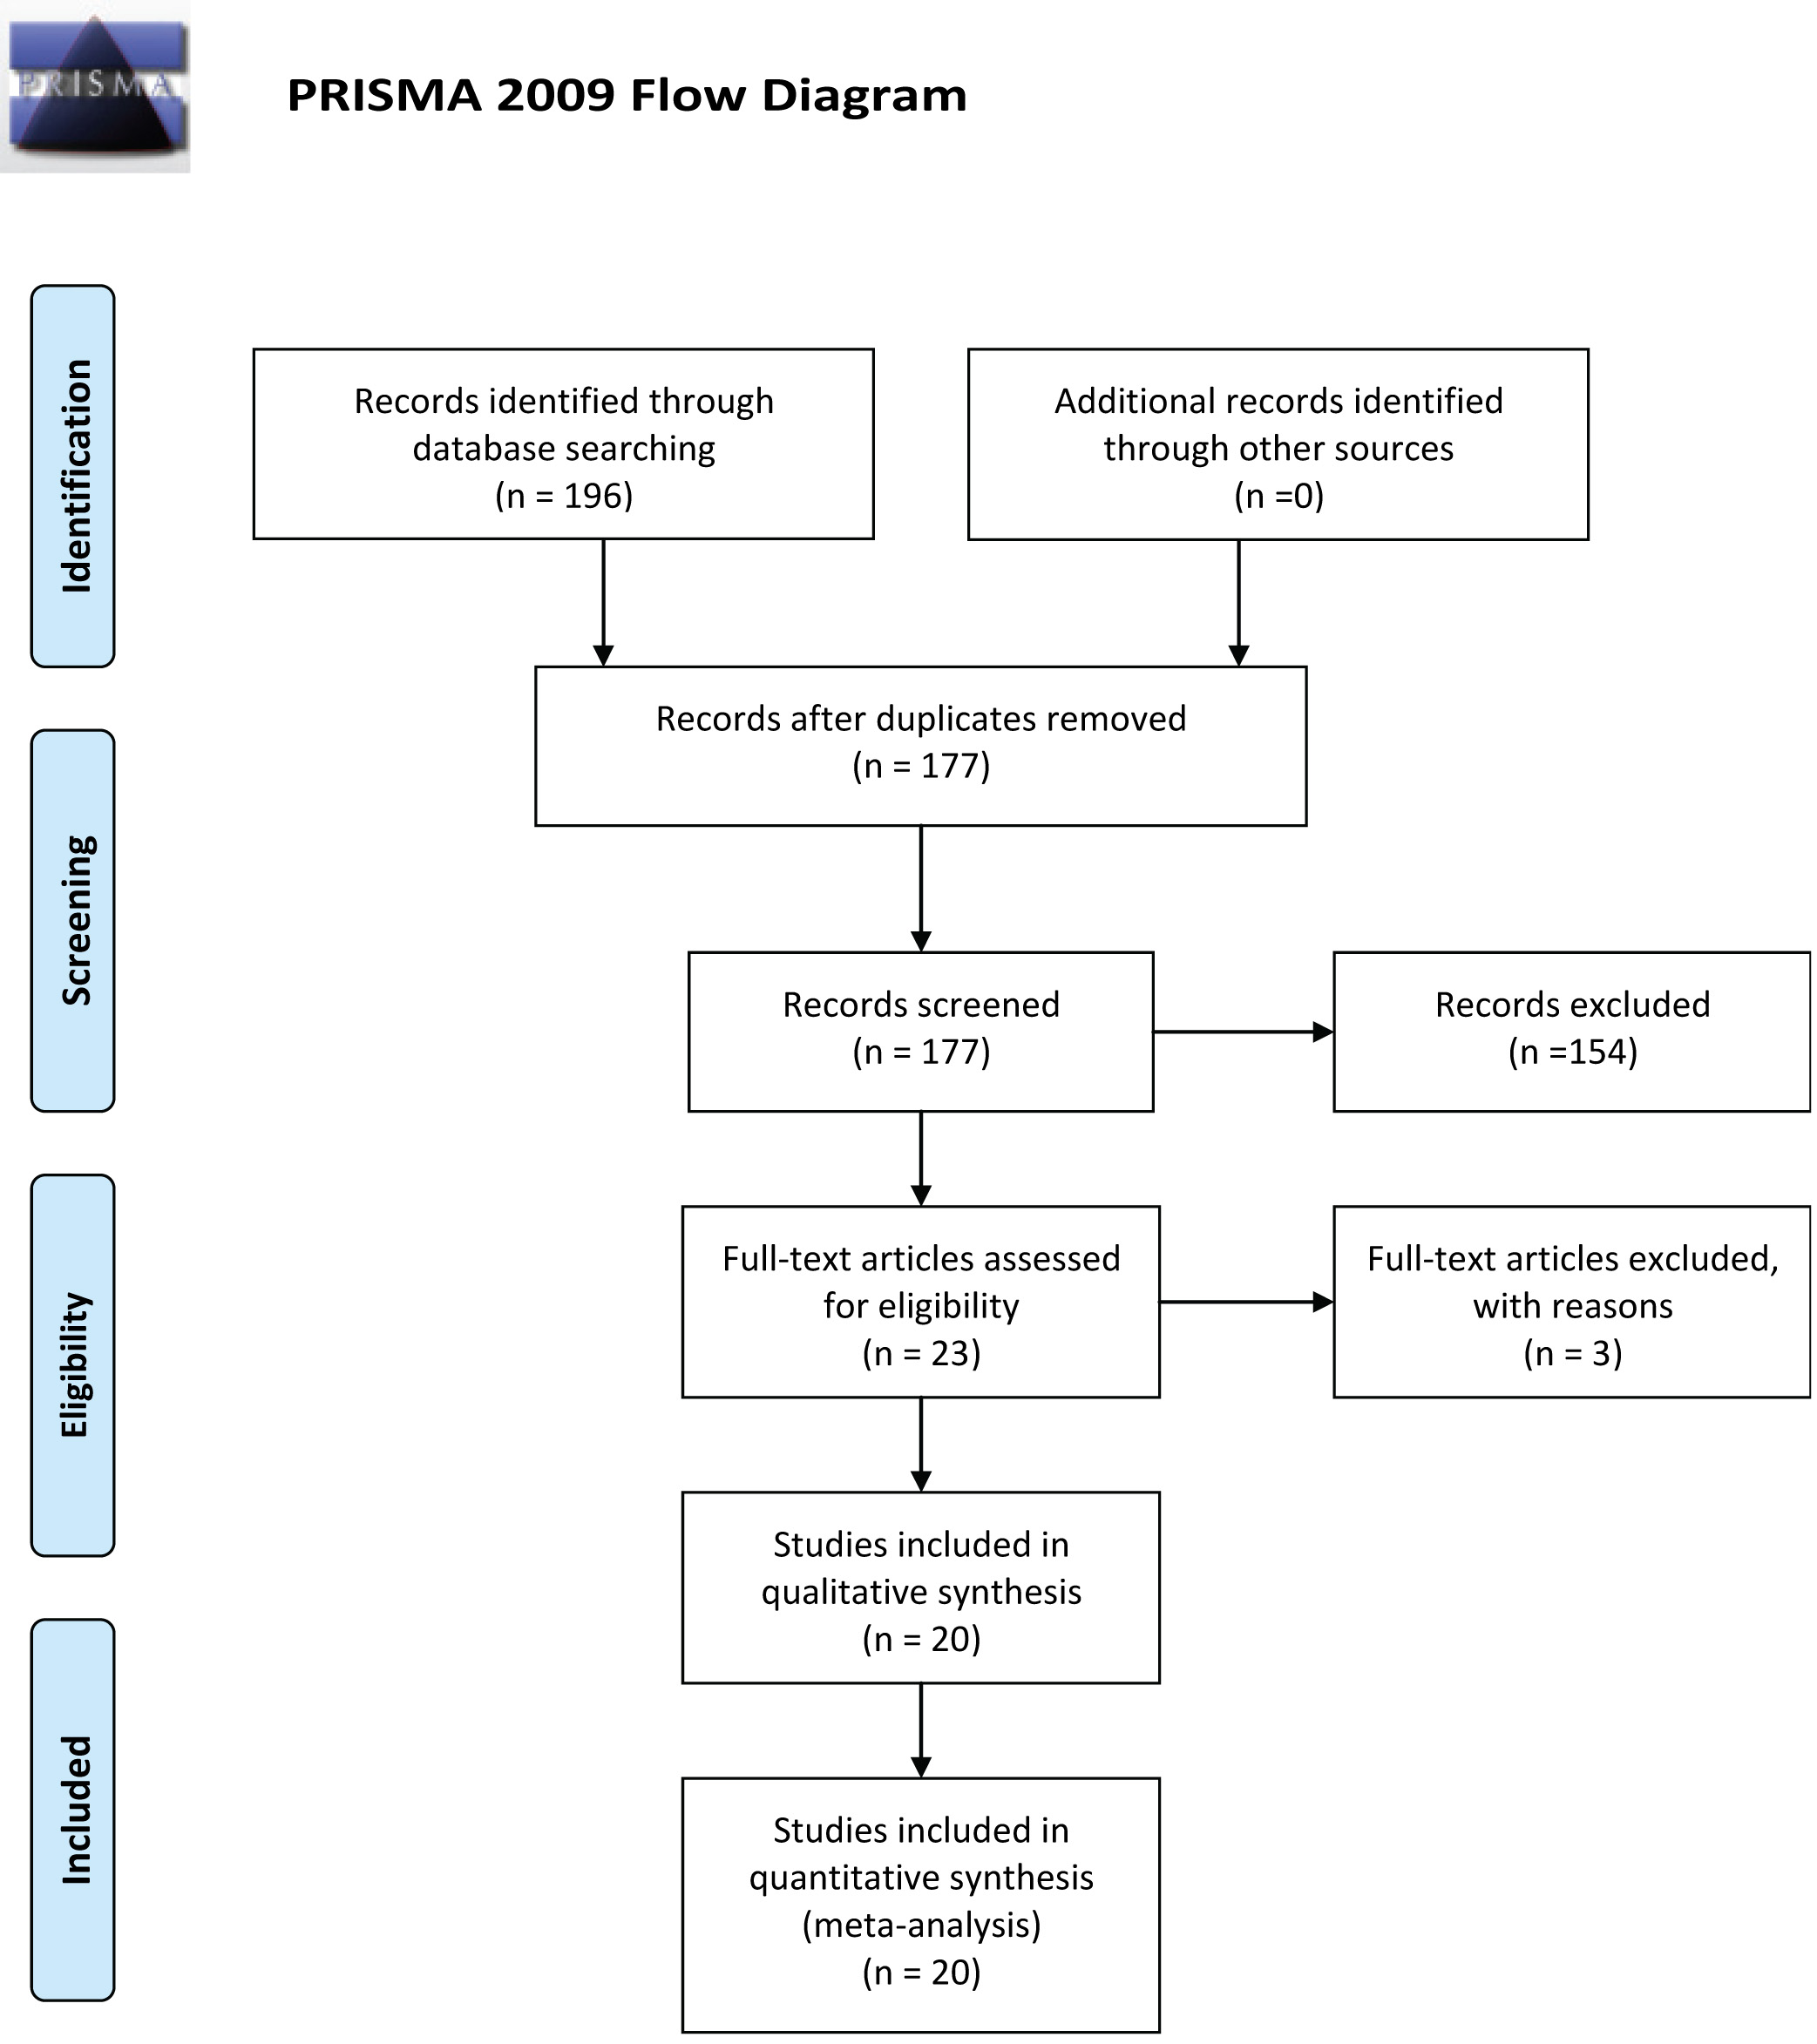
Figure 1. Flow diagram of the search strategy.
| Journal of Clinical Medicine Research, ISSN 1918-3003 print, 1918-3011 online, Open Access |
| Article copyright, the authors; Journal compilation copyright, J Clin Med Res and Elmer Press Inc |
| Journal website http://www.jocmr.org |
Original Article
Volume 11, Number 3, March 2019, pages 171-178
Hyperbilirubinemia as a Predictor of Appendiceal Perforation: A Systematic Review and Diagnostic Test Meta-Analysis
Figures
Table
| Author, study, country, and year | Age | Histologically confirmed appendicitis | Perforated appendicitis | Positive likelihood ratio (97.5% CI) | Negative likelihood ratio (97.5% CI) |
|---|---|---|---|---|---|
| CI: confidence interval; SE: standard error; RS: retrospective study; PNR: prospective non-randomized; NR: not reported. | |||||
| Estrada, RS, USA, 2007 | 33 (5 - 66) | 157 | 41 | 0.34 (0.23 - 0.51) | 2.30 (1.57 - 3.38) |
| Khan, PNR, Nepal, 2008 | 29 (8 - 73) | 118 | 18 | 5.73 (0.42 - 6.58) | 0.05 (0.02 - 0.12) |
| Sand, RS, Germany, 2009 | 36 (6 - 91) | 376 | 97 | 0.29 (0.22 - 0.38) | 1.94 (1.55 - 2.43) |
| Kaser, RS, Switzerland, 2010 | 22 (5 - 92) | 725 | 155 | 0.21 (0.16 - 0.27) | 2.05 (1.75 - 2.39) |
| Atahan, RS, Turkey, 2011 | 31 (18 - 83) | 302 | 45 | 0.15 (0.11 - 0.20) | 5.44 (3.03 - 9.75) |
| Emmanuel, RS, Ireland, 2011 | 27 (5 - 82) | 386 | 45 | 0.09 (0.06 - 0.13) | 6.56 (4.30 - 10.02) |
| Hong, RS, Korea, 2012 | 31 | 732 | 245 | 0.13 (0.10 - 0.17) | 1.96 (1.73 - 2.22) |
| McGowan, RS, UK, 2013 | NR | 1,271 | 154 | 0.13 (0.08 - 0.16) | 2.35 (1.95 - 2.82) |
| Chaudary, PNR, India, 2013 | 27 (15 - 64) | 45 | 5 | 0.41 (0.24 - 0.69) | 3.69 (2.31 - 5.90) |
| D’Souza, PNR, UK, 2013 | 28 (5 - 85) | 89 | 19 | 0.23 (0.13 - 0.39) | 2.96 (1.53 - 5.72) |
| Nomura, RS, Japan, 2014 | NR | 279 | 131 | 0.44 (0.34 - 0.56) | 1.72 (1.41 - 2.09) |
| Socea, RS, Romania, 2013 | NR | 274 | 51 | 0.26 (0.20 - 0.34) | 15.10 (3.15 - 71.53) |
| Chambers, RS, UK, 2015 | 33 ± 17 | 797 | 122 | 0.50 (0.43 - 0.59) | 1.83 (1.59 - 2.11) |
| Muller, RS, Germany, 2015 | 29 (16 - 91) | 312 | 56 | 0.10 (0.07 - 0.14) | 4.71 (3.40 - 6.52) |
| Saxena, PNR, India, 2015 | NR | 181 | 32 | 0.24 (0.14 - 0.42) | 2.67 (0.95 - 7.48) |
| Shahabuddin, PNR, India, 2016 | 25 (10 - 65) | 35 | 15 | 0.44 (0.27 - 0.71) | 3.81 (1.20 - 12.13) |
| Eren, RS, Turkey, 2016 | 36 (18 - 90) | 100 | 41 | 0.57 (0.31 - 1.03) | 1.26 (0.93 - 1.70) |
| Abouzeid, PNR, Egypt, 2017 | NR | 74 | 7 | 0.17 (0.39 - 0.70) | 3.91 (1.62 - 9.45) |
| Cheekuri, PNR India, 2017 | 27 (13 - 60) | 65 | 35 | 0.52 (0.39 - 0.70) | 3.91 (1.62 - 9.45) |
| Vineed, PNR, India, 2017 | Below 13 excluded | 71 | 29 | 0.50 (0.27 - 0.91) | 1.45 (0.94 - 2.24) |
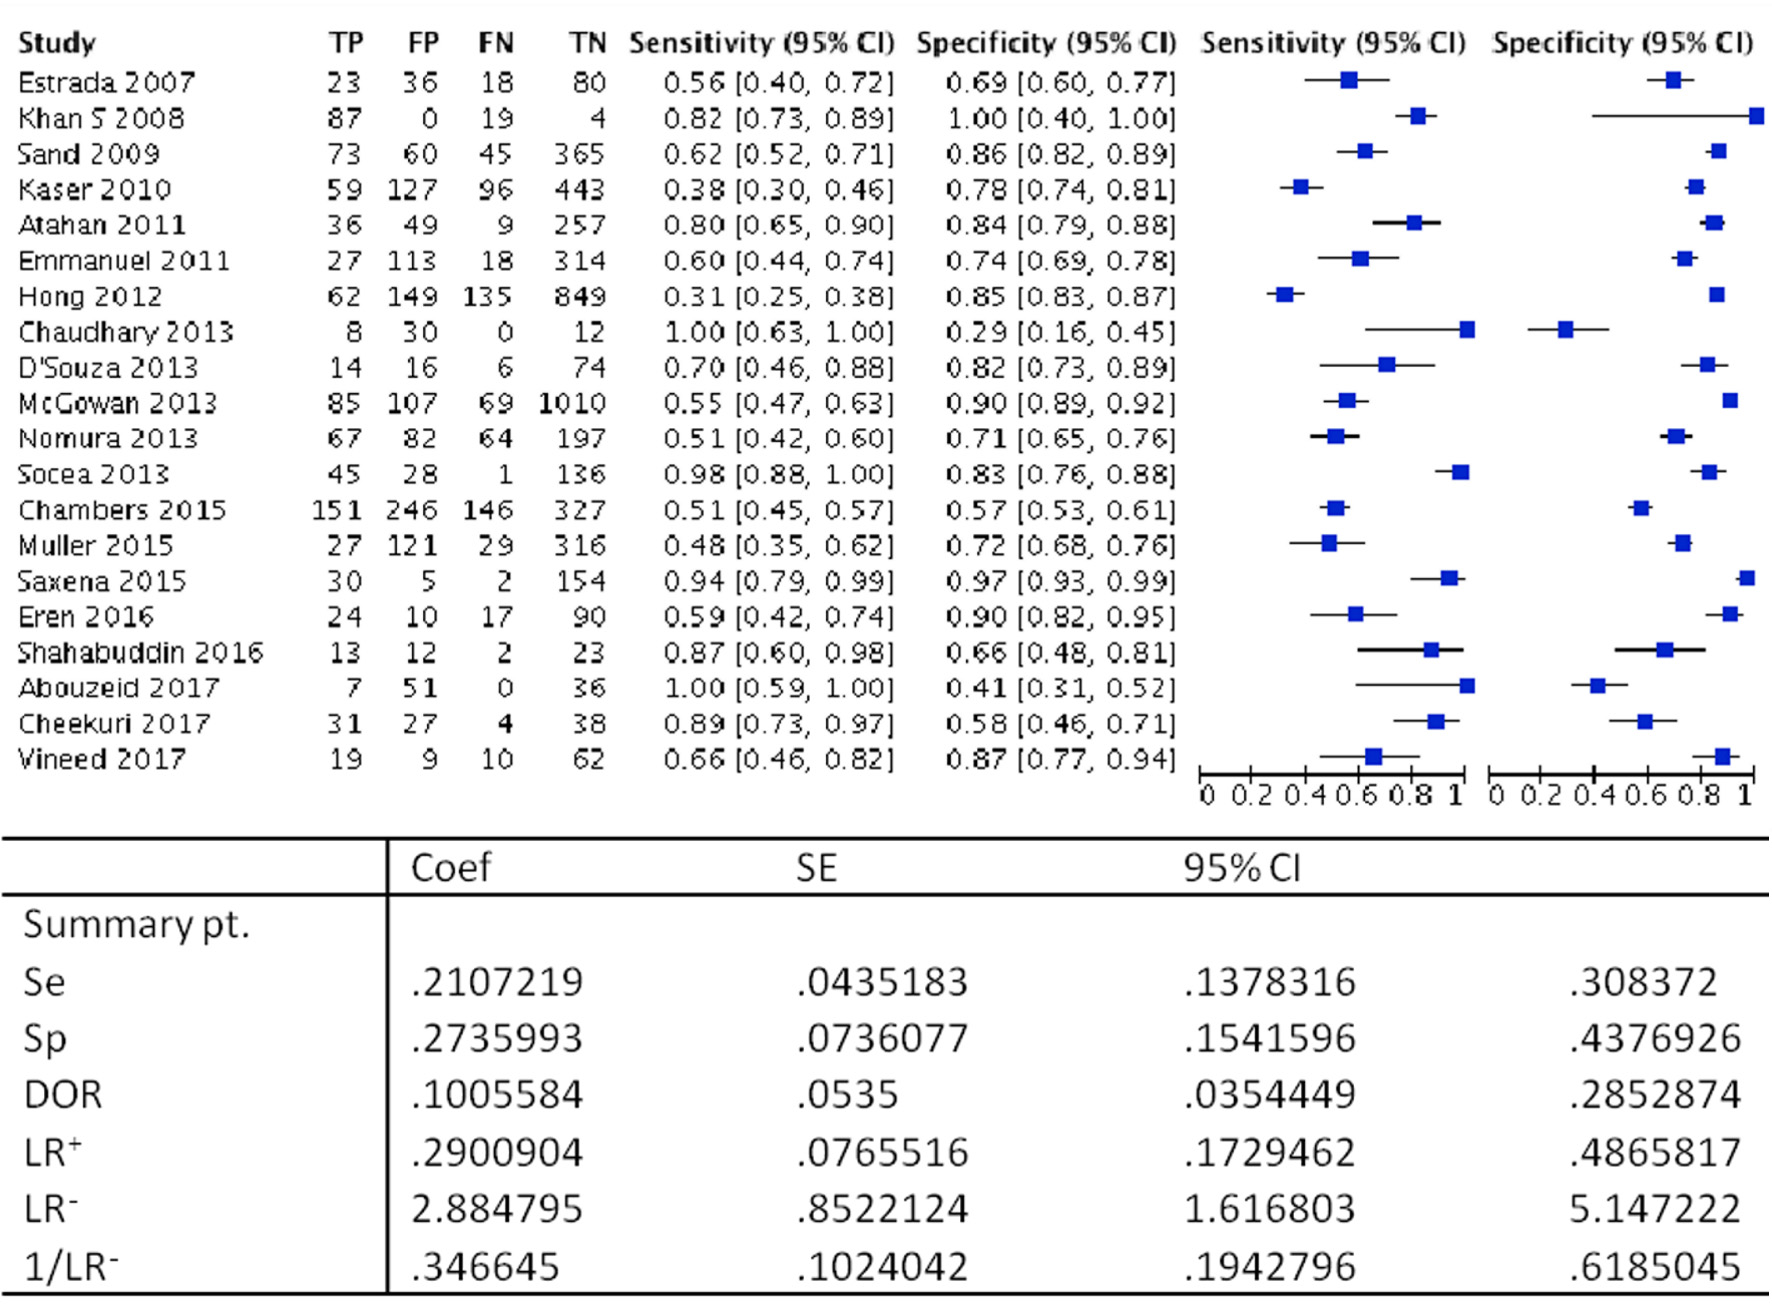
| Pooled estimates | 6,235 (71%) | 1,343(15%) | 0.29 (0.17 - 0.48), SE (0.76) | 2.88 (1.16 - 5.14), SE (0.85) | |