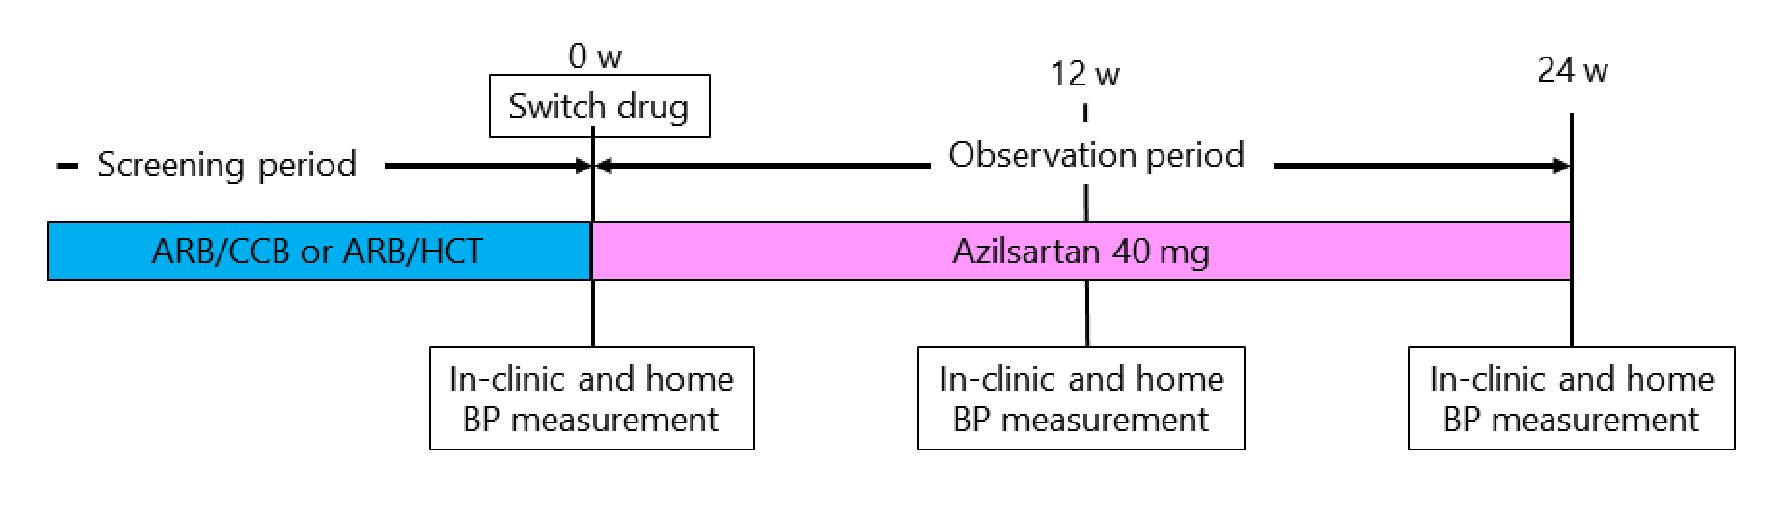
Figure 1. Study protocol. ARB/CCB: angiotensin II receptor blocker and amlodipine 5 mg or azelnidipine 16 mg; AEB/HCT: angiotensin II receptor blocker and hydrochlorothiazide 6.25 mg or 12.5 mg; BP: blood pressure.
| Journal of Clinical Medicine Research, ISSN 1918-3003 print, 1918-3011 online, Open Access |
| Article copyright, the authors; Journal compilation copyright, J Clin Med Res and Elmer Press Inc |
| Journal website http://www.jocmr.org |
Original Article
Volume 11, Number 3, March 2019, pages 202-207
Effect of Switching to Azilsartan From Fixed-Dose Combination of an Angiotensin II Receptor Blocker and Calcium Channel Blocker or a Thiazide in Patients With Hypertension
Figures
Tables
| Data are presented as mean ± standard deviation or n (%). ARB: angiotensin II receptor blocker. | |
| Age (years) | 77 ± 6 |
| Male sex | 18 (45) |
| Body mass index, kg/m2 | 23.7 ± 3.7 |
| Diabetes mellitus | 5 (13) |
| Dyslipidemia | 20 (50) |
| Chronic kidney disease | 5 (18) |
| History of coronary artery disease | 9 (23) |
| History of cerebrovascular disease | 2 (7) |
| Current smoker | 2 (7) |
| Baseline antihypertensive drug | |
| ARB and calcium channel blocker | 25 (63) |
| Valsartan 80 mg/amlodipine 5 mg | 9 (23) |
| Olmesartan 20 mg/azelnidipine 16 mg | 8 (20) |
| Candesartan 8 mg/amlodipine 5 mg | 6 (15) |
| Irbesartan 100 mg/amlodipine 5 mg | 1 (3) |
| Telmisartan 40 mg/amlodipine 5 mg | 1 (3) |
| ARB and diuretic | 15 (38) |
| Valsartan 80 mg/hydrochlorothiazide 6.25 mg | 8 (20) |
| Telmisartan 40 mg/hydrochlorothiazide 6.25 mg | 4 (10) |
| Candesartan 8 mg/hydrochlorothiazide 6.25 mg | 2 (5) |
| Losartan 50 mg/hydrochlorothiazide 12.5 mg | 1 (3) |
| Baseline | 12 weeks | 24 weeks | P valuea | P valueb | P valueb | P valueb | |
|---|---|---|---|---|---|---|---|
| Baseline vs. 12 weeks | Baseline vs. 24 weeks | 12 weeks vs. 24 weeks | |||||
| Data are presented as mean ± standard deviation. SBP: systolic blood pressure; DBP: diastolic blood pressure; HR: heart rate; CCB, calcium channel blocker. aP value by one-way repeated analysis of variance. bP value by the Bonferroni post hoc analysis. *P < 0.05 vs. at 24 weeks. | |||||||
| All (n = 40) | |||||||
| Office SBP | 136 ± 13 | 137 ± 17 | 135 ± 14 | 0.567 | 1.000 | 1.000 | 0.731 |
| Office DBP | 74 ± 9 | 73 ± 8 | 74 ± 8 | 0.921 | 1.000 | 1.000 | 1.000 |
| Office HR | 69 ± 13 | 71 ± 12 | 70 ± 12 | 0.329 | 0.552 | 1.000 | 0.731 |
| Home SBP | 133 ± 14 | 136 ± 14 | 135 ± 11 | 0.407 | 0.724 | 0.873 | 1.000 |
| Home DBP | 71 ± 9 | 73 ± 8 | 74 ± 9 | 0.066 | 0.339 | 0.109 | 1.000 |
| Home HR | 69 ± 12 | 68 ± 10 | 67 ± 11 | 0.109 | 0.743 | 0.220 | 0.655 |
| Without addition of a CCB (n = 33) | |||||||
| Office SBP | 137 ± 12 | 135 ± 17 | 134 ± 14 | 0.715 | 1.000 | 1.000 | 1.000 |
| Office DBP | 74 ± 8 | 72 ± 8 | 72 ± 6 | 0.182 | 0.956 | 0.164 | 1.000 |
| Office HR | 67 ± 12 | 69 ± 11 | 67 ± 11 | 0.274 | 0.572 | 1.000 | 0.511 |
| Home SBP | 132 ± 12 | 134 ± 13 | 136 ± 12 | 0.246 | 1.000 | 0.433 | 0.880 |
| Home DBP | 71 ± 8 | 72 ± 7 | 74 ± 8 | 0.054 | 0.947 | 0.094 | 0.370 |
| Home HR | 68 ± 12 | 66 ± 10 | 65 ± 11 | 0.101 | 0.817 | 0.218 | 0.817 |
| With addition of a CCB (n = 7) | |||||||
| Office SBP | 135 ± 20 | 150 ± 11* | 134 ± 10 | 0.270 | 0.180 | 1.000 | 0.012 |
| Office DBP | 73 ± 11 | 77 ± 8 | 82 ± 10 | 0.072 | 0.821 | 0.178 | 0.166 |
| Office HR | 79 ± 15 | 80 ± 11 | 81 ± 9 | 0.906 | 1.000 | 1.000 | 1.000 |
| Home SBP | 135 ± 20 | 141 ± 17 | 132 ± 10 | 0.338 | 1.000 | 1.000 | 0.616 |
| Home DBP | 74 ± 12 | 78 ± 12 | 75 ± 11 | 0.373 | 0.621 | 1.000 | 0.942 |
| Home HR | 75 ± 7 | 75 ± 8 | 73 ± 9 | 0.950 | 1.000 | 1.000 | 1.000 |
| Baseline | 6 months | P value | |
|---|---|---|---|
| Data are presented as mean ± standard deviation. Na: sodium; K: potassium; Cl: chloride; BUN: blood urea nitrogen; LDL: low-density lipoprotein; HDL: high-density lipoprotein. | |||
| Na (mEq/L) | 140.2 ± 1.7 | 140.0 ± 2.9 | 0.429 |
| K (mEq/L) | 4.2 ± 0.4 | 4.4 ± 0.5 | 0.013 |
| Cl (mEq/L) | 103.3 ± 5.8 | 103.2 ± 2.9 | 0.367 |
| BUN (mg/dL) | 20.2 ± 6.1 | 19.5 ± 6.9 | 0.847 |
| Serum creatinine (mg/dL) | 0.87 ± 0.20 | 0.98 ± 0.34 | 0.115 |
| Hemoglobin A1c (%) | 5.9 ± 0.6 | 5.8 ± 0.7 | 0.167 |
| Triglyceride (mg/dL) | 96.7 ± 41.9 | 112. 2 ± 30.6 | 0.916 |
| LDL-cholesterol (mg/dL) | 98.3 ± 36.9 | 94.5 ± 24.6 | 0.572 |
| HDL-cholesterol (mg/dL) | 62.9 ± 13.6 | 56.8 ± 12.7 | 0.086 |
| Uric acid (mg/dL) | 5.4 ± 1.3 | 5.8 ± 1.8 | 0.630 |