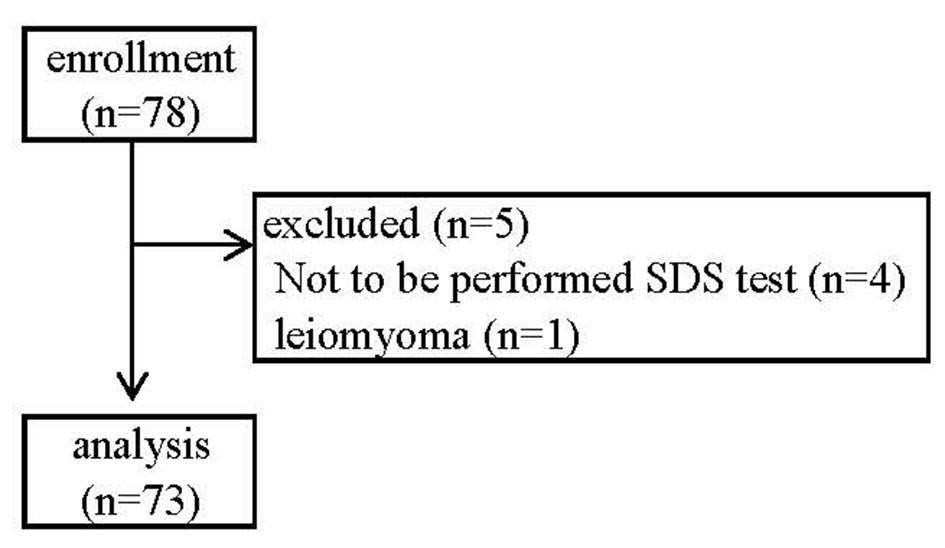
Figure 1. Flow diagram according to selection and non-continuation.
| Journal of Clinical Medicine Research, ISSN 1918-3003 print, 1918-3011 online, Open Access |
| Article copyright, the authors; Journal compilation copyright, J Clin Med Res and Elmer Press Inc |
| Journal website http://www.jocmr.org |
Original Article
Volume 11, Number 3, March 2019, pages 188-195
Preoperative Depressive Mood of Patients With Esophageal Cancer Might Delay Recovery From Operation-Related Malnutrition
Figures
Tables
| Normal SDS group (n = 36) | High SDS group (n = 37) | P value | |
|---|---|---|---|
| Data are expressed as median (25th-75th percentile) or n (%). Mann-Whitney U test and Fisher’s exact test were performed. SDS: Self-Rating Depression Scale; BMI: body mass index. | |||
| SDS (points) | 32.0 (29.0 - 35.0) | 46.0 (40.0 - 51.0) | < 0.001 |
| Sex (male/female) | 31:5 | 23:14 | 0.032 |
| Age (years) | 65.0 (60.25 - 70.75) | 62.0 (55.0 - 68.0) | 0.047 |
| BMI (kg/m2) | 21.6 (20.5 - 23.1) | 19.8 (18.0 - 21.8) | 0.007 |
| Stage | |||
| I and II | 22 (61.1) | 20 (54.1) | 0.638 |
| III and IV | 14 (38.9) | 17 (45.9) | |
| Hospital stay (day) | 27.5 (21.0 - 41.0) | 28.0 (22.0 - 37.0) | 0.908 |
| Normal SDS group (n = 36) | High SDS group (n = 37) | P value | |
|---|---|---|---|
| Data are expressed as median (25th-75th percentile). Mann-Whitney U test was performed. SDS: Self-Rating Depression Scale. | |||
| Global rating | |||
| 1. I feel down-hearted and blue | 2.0 (1.0 - 2.0) | 3.0 (2.0 - 4.0) | 0.006 |
| 2. Morning is when I feel the best | 3.0 (2.0 - 4.0) | 4.0 (3.0 - 4.0) | < 0.001 |
| 3. I have crying spells or feel like it | 1.0 (1.0 - 1.3) | 1.0 (1.0 - 2.0) | 0.003 |
| 4. I have trouble sleeping at night | 1.5 (1.0 - 2.8) | 2.0 (2.0 - 4.0) | 0.014 |
| 5. I eat as much as I used to | 1.0 (1.0 - 1.0) | 3.0 (1.0 - 4.0) | 0.006 |
| 6. I still enjoy sex | 3.0 (2.3 - 4.0) | 4.0 (3.0 - 4.0) | 0.005 |
| 7. I notice that I am losing weight | 1.0 (1.0 - 3.8) | 4.0 (1.0 - 4.0) | 0.021 |
| 8. I have trouble with constipation | 1.0 (1.0 - 2.0) | 2.0 (1.0 - 4.0) | 0.009 |
| 9. My heart beats faster than usual | 1.0 (1.0 - 1.0) | 1.0 (1.0 - 1.0) | 0.013 |
| 10. I get tired for no reason | 1.0 (1.0 - 2.0) | 2.0 (2.0 - 4.0) | < 0.001 |
| 11. My mind is as clear as it used to be | 1.0 (1.0 - 3.0) | 3.0 (1.0 - 4.0) | 0.002 |
| 12. I find it easy to do the things I used to | 1.0 (1.0 - 2.8) | 3.0 (2.0 - 4.0) | < 0.001 |
| 13. I am restless and can’t keep still | 1.0 (1.0 - 1.0) | 1.0 (1.0 - 2.5) | 0.001 |
| 14. I feel hopeful about the future | 1.0 (1.0 - 2.8) | 3.0 (1.0 - 4.0) | 0.014 |
| 15. I am more irritable than usual | 1.0 (1.0 - 1.0) | 2.0 (1.0 - 3.0) | 0.001 |
| 16. I find it easy to make decisions | 1.0 (1.0 - 1.0) | 2.0 (1.0 - 3.0) | 0.014 |
| 17. I feel that I am useful and needed | 1.0 (1.0 - 2.0) | 3.0 (1.0 - 3.0) | 0.001 |
| 18. My life is pretty full | 1.0 (1.0 - 2.0) | 2.0 (1.0 - 3.0) | 0.001 |
| 19. I feel that others would be better off if I were dead | 1.0 (1.0 - 1.0) | 1.0 (1.0 - 1.0) | 0.574 |
| 20. I still enjoy the things I used to do | 1.0 (1.0 - 1.0) | 3.0 (1.0 - 4.0) | < 0.001 |
| Total | 32.0 (29.0 - 35.0) | 46.0 (40.0 - 51.0) | < 0.001 |
| Normal SDS group (n = 33) | High SDS group (n = 35) | P value | |
|---|---|---|---|
| Data are expressed as median (25th-75th percentile). Mann-Whitney U test was performed. SDS: Self-Rating Depression Scale; QOL: quality of life; PCS: physical component summary; MCS: mental component summary. | |||
| %PCS (physical QOL) | 101.4 (94.9 - 111.0) | 95.1 (76.0 - 95.1) | 0.024 |
| %MCS (psychological QOL) | 85.5 (78.4 - 97.3) | 86.1 (74.8 - 95.0) | 0.480 |
| Normal SDS group (n = 36) | High SDS group (n = 37) | P value | |
|---|---|---|---|
| Data are expressed as median (25th-75th percentile). Mann-Whitney U test was performed. SDS: Self-Rating Depression Scale; BMI: body mass index; AC: arm circumference; TSF: triceps skinfold; AMC: arm muscle circumference; AMA: arm muscle area. | |||
| %BMI | 98.6 (93.6 - 105.7) | 91.4 (84.7 - 99.1) | 0.015 |
| %Body fat | 123.0 (100.5 - 152.6) | 100.0 (65.5 - 140.3) | 0.081 |
| %Skeletal muscle | 93.6 (88.5 - 96.8) | 89.4 (83.2 - 94.2) | 0.036 |
| %AC | 100.4 (92.7 - 104.0) | 94.4 (86.1 - 101.7) | 0.022 |
| %TSF | 88.9 (77.8 - 111.1) | 77.8 (65.6 - 119.6) | 0.379 |
| %AMC | 101.2 (95.0 - 106.7) | 98.0 (91.5 - 102.0) | 0.052 |
| %AMA | 102.6 (90.0 - 113.5) | 96.2 (86.9 - 104.5) | 0.033 |
| %Grip strength (n = 35:37) | 83.0 (73.0 - 95.2) | 73.1 (63.9 - 82.6) | 0.012 |
| Normal SDS group (n = 36) | High SDS group (n = 37) | P value | |
|---|---|---|---|
| Data are expressed as median (25th-75th percentile). Mann-Whitney U test was performed. WBC: white blood cell count; TLC: total lymphocyte count; CRP: C-reactive protein; Alb: albumin; ChE: cholinesterase; TG: triglyceride; T-Cho: total cholesterol; HDL-Cho: high-density lipoprotein cholesterol; LDL-Cho: low-density lipoprotein cholesterol; TTR: transthyretin; PNI: prognostic nutritional index; CHI: creatinine height index. | |||
| WBC (/mm3) | 6,600 (5,000 - 7,200) | 7,350 (5,825 - 9,100) | 0.522 |
| TLC (/mm3) | 1,792 (1,407 - 2,088) | 1,596 (1,199 - 1,976) | 0.041 |
| CRP (mg/dL) | 0.09 (0.03 - 0.19) | 0.24 (0.93 - 1.51) | 0.064 |
| Alb (g/dL) | 4.1 (3.9 - 4.2) | 4.0 (3.7 - 4.1) | 0.018 |
| ChE (IU/L) | 299 (235 - 341) | 300 (243 - 350) | 0.669 |
| Failure: 1 | |||
| TG (mg/dL) | 106 (92 - 142) | 136 (76 - 183) | 0.736 |
| T-Cho (mg/dL) | 197 (174 - 215) | 177 (151 - 208) | 0.787 |
| HDL-Cho (mg/dL) | 49 (40 - 62) | 41 (35 - 52) | 0.128 |
| Failure: 10 | Failure: 11 | ||
| LDL-Cho (mg/dL) | 112 (101 - 139) | 100 (86 - 132) | 0.783 |
| Failure: 10 | Failure: 10 | ||
| TTR (mg/dL) | 29.1 (24.1 - 32.2) | 22.6 (19.4 - 27.9) | 0.009 |
| Failure: 7 | Failure: 8 | ||
| PNI (point) | 50.9 (47.6 - 53.0) | 46.9 (44.0 - 51.0) | 0.007 |
| CHI (%) | 82.6 (48.6 - 102.0) | 66.9 (56.7 - 77.9) | 0.285 |
| Failure: 15 | Failure: 13 | ||
| n | Normal SDS | n | High SDS | P value | ||
|---|---|---|---|---|---|---|
| Median (25-75percentile), Mann-Whitney U test were performed; SDS, Self-rating Depression Scale; PCS, physical component summary; MCS, mental component summary. | ||||||
| SDS | Pre-operation | 18 | 32.0 (29.0 - 35.0) | 14 | 46.0 (39.0 - 50.5) | < 0.001 |
| 3 months | 36.5 (34.0 - 44.0) | 49.5 (45.8 - 54.0) | 0.002 | |||
| 6 months | 36.5 (31.0 - 41.5) | 44.0 (37.8 - 51.0) | 0.073 | |||
| %PCS | Pre-operation | 18 | 102.0 (93.1 - 114.0) | 14 | 89.3 (74.1 - 103.5) | 0.023 |
| 3 months | 86.6 (76.8 - 97.5) | 81.8 (72.3 - 91.9) | 0.303 | |||
| 6 months | 91.9 (78.6 - 102.6) | 85.6 (80.0 - 93.4) | 0.442 | |||
| %MCS | Pre-operation | 18 | 85.8 (77.6 - 99.8) | 14 | 89.2 (78.4 - 97.4) | 0.539 |
| 3 months | 85.6 (65.9 - 94.3) | 86.3 (66.7 - 90.9) | 0.594 | |||
| 6 months | 94.9 (82.5 - 102.5) | 89.9 (83.6 - 100.5) | 0.536 | |||
| %BMI | Pre-operation | 22 | 99.8 (93.5 - 105.7) | 16 | 91.2 (81.6 - 106.0) | 0.015 |
| 3 months | 91.1 (85.6 - 96.4) | 79.3 (74.2 - 89.8) | 0.03 | |||
| 6 months | 89.1 (84.2 - 94.2) | 78.9 (74.4 - 87.8) | 0.012 | |||
| %Skeletal muscle | Pre-operation | 22 | 94.8 (88.2 - 97.7) | 16 | 88.1 (82.5 - 94.1) | 0.036 |
| 3 months | 87.6 (81.3 - 92.3) | 78.8 (75.3 - 85.5) | 0.100 | |||
| 6 months | 86.9 (83.7 - 93.7) | 80.5 (77.4 - 84.9) | 0.013 | |||
| %Body fat | Pre-operation | 22 | 126.2 (105.1 - 147.0) | 16 | 94.9 (71.4 - 169.6) | 0.081 |
| 3 months | 102.6 (61.3 - 112.6) | 61.4 (41.6 - 109.4) | 0.096 | |||
| 6 months | 79.7 (63.0 - 106.9) | 67.1 (39.2 - 96.1) | 0.201 | |||
| %Grip strength | Pre-operation | 22 | 84.6 (68.3 - 103.0) | 16 | 74.6 (65.4 - 85.7) | 0.012 |
| 3 months | 67.8 (61.4 - 90.9) | 62.8 (57.1 - 67.5) | 0.019 | |||
| 6 months | 73.1 (64.2 - 90.7) | 65.7 (55.1 - 76.8) | 0.122 | |||
| %BMI ≥ 85 (n = 32) | %BMI < 85 (n = 19) | Univariate OR (95% CI) | P value | Multivariate OR (95% CI)a | P value | ||
|---|---|---|---|---|---|---|---|
| aModel included SDS and PNI. chemo: chemotherapy; SDS: Self-Rating Depression Scale; PNI: prognostic nutritional index. | |||||||
| Sex | Female | 7 | 8 | 1 | |||
| Male | 25 | 11 | 2.60 (0.75 - 8.95) | 0.131 | |||
| Age (years) | < 65 | 19 | 11 | 1 | |||
| ≥ 65 | 13 | 8 | 1.06 (0.34 - 3.36) | 0.917 | |||
| Stage | I and II | 20 | 8 | 1 | |||
| III and IV | 12 | 11 | 2.29 (0.72 - 7.30) | 0.161 | |||
| Chemotherapy | Absence | 14 | 9 | 1 | |||
| Prescription | 18 | 10 | 0.86 (0.28 - 2.70) | 0.802 | |||
| SDS (point) | < 39 | 23 | 7 | 1 | 1 | ||
| ≥ 39 | 9 | 12 | 4.38 (1.31 - 14.68) | 0.017 | 4.07 (1.15 - 14.35) | 0.029 | |
| PNI (point) | ≥ 49 | 22 | 7 | 1 | 1 | ||
| < 49 | 10 | 12 | 3.77 (1.14 - 12.46) | 0.029 | 3.47 (0.98 - 12.24) | 0.053 | |