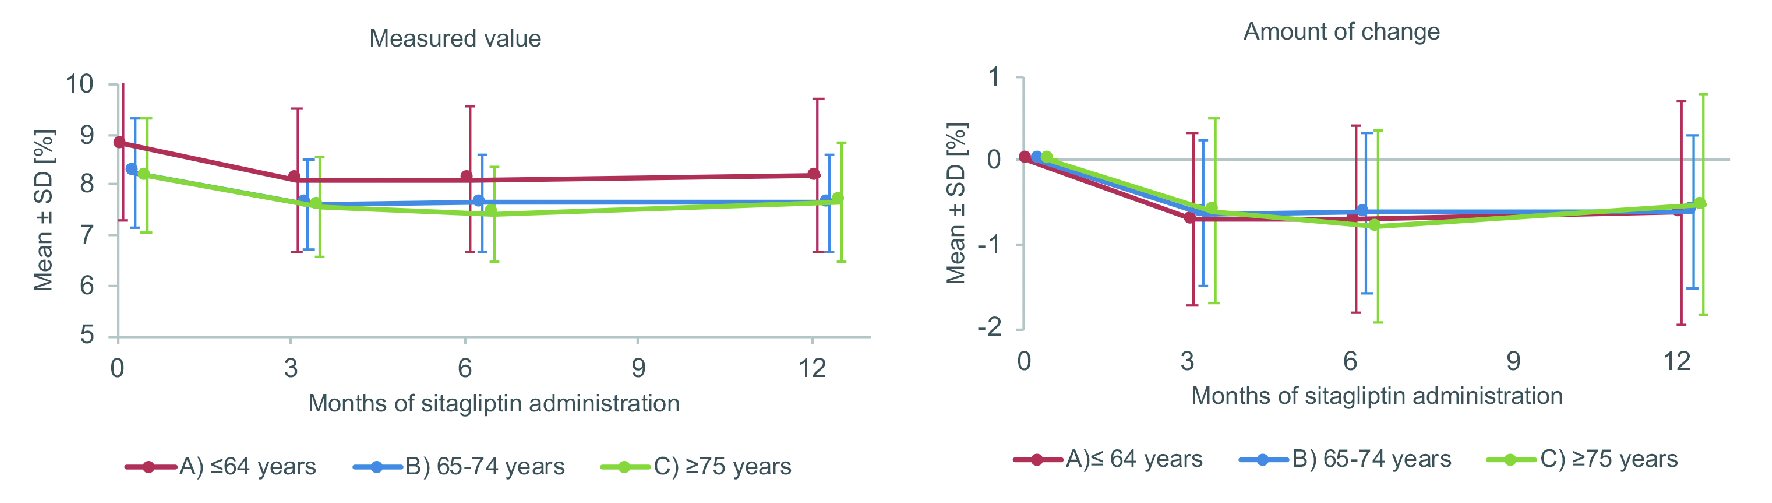
Figure 1. Changes of HbA1c. SD: standard deviation.
| Journal of Clinical Medicine Research, ISSN 1918-3003 print, 1918-3011 online, Open Access |
| Article copyright, the authors; Journal compilation copyright, J Clin Med Res and Elmer Press Inc |
| Journal website http://www.jocmr.org |
Original Article
Volume 11, Number 5, May 2019, pages 311-320
Efficacy and Safety of Adding Sitagliptin in Type 2 Diabetes Patients on Insulin: Age-Stratified Comparison at One Year in the ASSIST-K Study
Figures
Tables
| All patients on insulin | Patients with HbA1c data | |
|---|---|---|
| Men: eGFR = 194 × serum creatinine-1.094 × age at enrollment-0.287; Women: eGFR = 194 × serum creatinine-1.094 × age at enrollment-0.287 × 0.739. Data are shown as the mean ± standard deviation unless otherwise noted. BMI: body mass index; eGFR; estimated glomerular filtration rate; HbA1c: hemoglobin A1c; NGSP: National Glycohemoglobin Standardization Program. | ||
| No. of patients | 937 (100.0%) | 821 (100.0%) |
| Sex | ||
| Male | 508 (54.2%) | 440 (53.6%) |
| Female | 429 (45.8%) | 381 (46.4%) |
| Age at enrollment | 63.9 ± 12.3 | 64.2 ± 11.9 |
| Diabetic complications | ||
| Retinopathy | 315 (33.6%) | 285 (34.7%) |
| Neuropathy | 324 (34.6%) | 296 (36.1%) |
| Nephropathy | 367 (39.2%) | 336 (40.9%) |
| Arteriosclerotic diseases | ||
| Cerebrovascular disease | 72 (7.7%) | 65 (7.9%) |
| Myocardial infarction/angina pectoris | 162 (17.3%) | 142 (17.3%) |
| Arteriosclerosis obliterans | 87 (9.3%) | 81 (9.9%) |
| Other complications | ||
| Hypertension | 531 (56.7%) | 478 (58.2%) |
| Dyslipidemia | 588 (62.8%) | 523 (63.7%) |
| Fatty liver | 308 (32.9%) | 272 (33.1%) |
| History of smoking | 238 (25.4%) | 207 (25.2%) |
| History of alcohol intake | 231 (24.7%) | 192 (23.4%) |
| Duration of diabetes (years) | 17.0 ± 9.2 | 17.2 ± 9.1 |
| Weight (baseline) | 66.23 ± 15.51 | 66.15 ± 14.99 |
| BMI (baseline) | 25.38 ± 4.61 | 25.38 ± 4.48 |
| HbA1c (baseline) (NGSP, %) | 8.50 ± 1.35 | 8.49 ± 1.34 |
| eGFR (baseline) (mL/min/1.73 m2) | 75.851 ± 22.905 | 75.588 ± 22.502 |
| Age at enrollment | Intergroup comparison: P value | |||||
|---|---|---|---|---|---|---|
| A) ≤ 64 years | B) 65 - 74 years | C) ≥ 75 years | A vs. B | A vs. C | B vs. C | |
| *P < 0.050, **P < 0.010, and ***P < 0.001. Data are shown as the mean ± standard deviation unless otherwise noted. BMI: body mass index; eGFR; estimated glomerular filtration rate; HbA1c: hemoglobin A1c; NGSP: National Glycohemoglobin Standardization Program. | ||||||
| No. of patients analyzed | 389 (100.0%) | 267 (100.0%) | 165 (100.0%) | |||
| Sex | ||||||
| Male | 237 (60.9%) | 126 (47.2%) | 77 (46.7%) | Fisher’s exact test | ||
| Female | 152 (39.1%) | 141 (52.8%) | 88 (53.3%) | < 0.001*** | 0.003** | 0.921 |
| Age at enrollment | 54.0 ± 8.3 | 69.6 ± 2.9 | 79.2 ± 3.4 | t-test | ||
| N | 389 | 267 | 165 | < 0.001*** | < 0.001*** | < 0.001*** |
| Diabetic complications | ||||||
| Retinopathy | ||||||
| No | 222 (57.1%) | 131 (49.1%) | 84 (50.9%) | Fisher’s exact test | ||
| Yes | 124 (31.9%) | 102 (38.2%) | 59 (35.8%) | 0.057 | 0.261 | 0.668 |
| Neuropathy | ||||||
| No | 223 (57.3%) | 128 (47.9%) | 68 (41.2%) | Fisher’s exact test | ||
| Yes | 114 (29.3%) | 108 (40.4%) | 74 (44.8%) | 0.004** | < 0.001*** | 0.244 |
| Nephropathy | ||||||
| No | 194 (49.9%) | 124 (46.4%) | 69 (41.8%) | Fisher’s exact test | ||
| Yes | 146 (37.5%) | 113 (42.3%) | 77 (46.7%) | 0.27 | 0.048* | 0.346 |
| Arteriosclerotic diseases | ||||||
| Cerebrovascular disease | ||||||
| No | 311 (79.9%) | 199 (74.5%) | 121 (73.3%) | Fisher’s exact test | ||
| Yes | 16 (4.1%) | 32 (12.0%) | 17 (10.3%) | < 0.001*** | 0.009** | 0.752 |
| Myocardial infarction | ||||||
| No | 287 (73.8%) | 176 (65.9%) | 96 (58.2%) | Fisher’s exact test | ||
| Angina pectoris | ||||||
| Yes | 40 (10.3%) | 60 (22.5%) | 42 (25.5%) | < 0.001*** | < 0.001*** | 0.336 |
| Arteriosclerosis | ||||||
| No | 285 (73.3%) | 199 (74.5%) | 118 (71.5%) | Fisher’s exact test | ||
| Obliterans | ||||||
| Yes | 33 (8.5%) | 29 (10.9%) | 19 (11.5%) | 0.414 | 0.335 | 0.752 |
| Other complications | ||||||
| Hypertension | ||||||
| No | 157 (40.4%) | 80 (30.0%) | 35 (21.2%) | Fisher’s exact test | ||
| Yes | 192 (49.4%) | 167 (62.5%) | 119 (72.1%) | 0.002** | < 0.001*** | 0.041* |
| Dyslipidemia | ||||||
| No | 106 (27.2%) | 68 (25.5%) | 57 (34.5%) | Fisher’s exact test | ||
| Yes | 252 (64.8%) | 178 (66.7%) | 93 (56.4%) | 0.648 | 0.076 | 0.035* |
| Fatty liver | ||||||
| No | 152 (39.1%) | 129 (48.3%) | 83 (50.3%) | Fisher’s exact test | ||
| Yes | 146 (37.5%) | 82 (30.7%) | 44 (26.7%) | 0.024* | 0.008** | 0.486 |
| History of smoking | ||||||
| No | 167 (42.9%) | 125 (46.8%) | 84 (50.9%) | Fisher’s exact test | ||
| Yes | 120 (30.8%) | 59 (22.1%) | 28 (17.0%) | 0.041* | 0.002** | 0.237 |
| History of alcohol intake | ||||||
| No | 165 (42.4%) | 113 (42.3%) | 90 (54.5%) | Fisher’s exact test | ||
| Yes | 114 (29.3%) | 58 (21.7%) | 20 (12.1%) | 0.162 | < 0.001*** | 0.004** |
| Duration of diabetes (years) | 13.6 ± 7.2 | 19.8 ± 8.6 | 21.3 ± 10.5 | t-test | ||
| N | 331 | 227 | 141 | < 0.001*** | < 0.001*** | 0.123 |
| Body weight (baseline) | 72.06 ± 16.14 | 62.40 ± 11.30 | 58.23 ± 11.48 | t-test | ||
| N | 389 | 267 | 164 | < 0.001*** | < 0.001*** | < 0.001* |
| BMI (baseline) | 26.58 ± 4.81 | 24.55 ± 3.74 | 23.89 ± 4.03 | t-test | ||
| N | 376 | 256 | 159 | < 0.001*** | < 0.001*** | 0.089 |
| HbA1c (baseline) (NGSP, %) | 8.80 ± 1.50 | 8.24 ± 1.09 | 8.19 ± 1.13 | t-test | ||
| N | 389 | 267 | 165 | < 0.001*** | < 0.001*** | 0.644 |
| eGFR (baseline) (mL/min/1.73 m2) | 85.1 ± 21.7 | 70.0 ± 19.7 | 63.2 ± 18.8 | t-test | ||
| N | 285 | 176 | 140 | < 0.001*** | < 0.001*** | 0.002** |
| Age at enrollment | Intergroup comparison: P value | |||||
|---|---|---|---|---|---|---|
| A) ≤ 64 years | B) 65 - 74 years | C) ≥ 75 years | A vs. B | A vs. C | B vs. C | |
| *P < 0.050, **P < 0.010, and ***P < 0.001. Data are shown as the mean ± standard deviation unless otherwise noted. NA: not applicable; OHA: oral hypoglycemic agent. | ||||||
| No. of patients analyzed | 389 (100.0%) | 267 (100.0%) | 165 (100.0%) | |||
| Before sitagliptin therapy | ||||||
| Daily no. of insulin doses | ||||||
| 0 | 0 (0.0%) | 0 (0.0%) | 0 (0.0%) | Wilcoxon test | ||
| 1 | 71 (18.3%) | 53 (19.9%) | 39 (23.6%) | 0.266 | 0.002** | 0.031* |
| 2 | 81 (20.8%) | 55 (20.6%) | 53 (32.1%) | |||
| 3 | 103 (26.5%) | 83 (31.1%) | 33 (20.0%) | |||
| 4 | 134 (34.4%) | 76 (28.5%) | 40 (24.2%) | |||
| Mean | 2.8 | 2.7 | 2.4 | |||
| OHAs | Fisher’s exact test | |||||
| Sulfonylureas | 76 (19.5%) | 60 (22.5%) | 34 (20.6%) | 0.379 | 0.816 | 0.719 |
| Biguanides | 200 (51.4%) | 98 (36.7%) | 39 (23.6%) | < 0.001*** | < 0.001*** | 0.006** |
| Thiazolidinediones | 54 (13.9%) | 24 (9.0%) | 12 (7.3%) | 0.065 | 0.031* | 0.594 |
| Alpha-glucosidase inhibitors | 102 (26.2%) | 71 (26.6%) | 43 (26.1%) | 0.928 | 1 | 1 |
| Glinides | 6 (1.5%) | 4 (1.5%) | 5 (3.0%) | 1 | 0.317 | 0.312 |
| Number of OHAs | ||||||
| 0 | 122 (31.4%) | 107 (40.1%) | 69 (41.8%) | Wilcoxon test | ||
| 1 | 138 (35.5%) | 80 (30.0%) | 66 (40.0%) | 0.036* | < 0.001*** | 0.127 |
| 2 | 90 (23.1%) | 65 (24.3%) | 24 (14.5%) | |||
| 3 | 39 (10.0%) | 15 (5.6%) | 6 (3.6%) | |||
| Mean | 1.1 | 1 | 0.8 | |||
| At the start of sitagliptin therapy | ||||||
| Sitagliptin dose | 47.1 ± 9.7 | 45.1 ± 11.3 | 45.0 ± 10.0 | Wilcoxon test | ||
| N | 388 | 267 | 165 | 0.009** | 0.027* | 0.927 |
| Daily no. of insulin doses | ||||||
| 0 | 1 (0.3%) | 1 (0.4%) | 0 (0.0%) | Wilcoxon test | ||
| 1 | 71 (18.3%) | 56 (21.0%) | 41 (24.8%) | 0.19 | 0.003** | 0.064 |
| 2 | 85 (21.9%) | 56 (21.0%) | 50 (30.3%) | |||
| 3 | 100 (25.7%) | 80 (30.0%) | 35 (21.2%) | |||
| 4 | 132 (33.9%) | 74 (27.7%) | 39 (23.6%) | |||
| Mean | 2.7 | 2.6 | 2.4 | |||
| OHAs | Fisher’s exact test | |||||
| Sulfonylureas | 74 (19.0%) | 60 (22.5%) | 31 (18.8%) | 0.324 | 1 | 0.397 |
| Biguanides | 196 (50.4%) | 94 (35.2%) | 31 (18.8%) | < 0.001*** | < 0.001*** | < 0.001*** |
| Thiazolidinediones | 33 (8.5%) | 13 (4.9%) | 9 (5.5%) | 0.087 | 0.292 | 0.824 |
| Alpha-glucosidase inhibitors | 74 (19.0%) | 57 (21.3%) | 30 (18.2%) | 0.487 | 0.905 | 0.46 |
| Glinides | 1 (0.3%) | 0 (0.0%) | 0 (0.0%) | NA | NA | NA |
| No. of concomitant OHAs | ||||||
| 0 | 137 (35.2%) | 122 (45.7%) | 90 (54.5%) | Wilcoxon test | ||
| 1 | 145 (37.3%) | 76 (28.5%) | 54 (32.7%) | 0.040* | < 0.001*** | 0.010* |
| 2 | 88 (22.6%) | 59 (22.1%) | 17 (10.3%) | |||
| 3 | 19 (4.9%) | 10 (3.7%) | 4 (2.4%) | |||
| Mean | 1 | 0.8 | 0.6 | |||
| After 12 months of sitagliptin therapy | ||||||
| Sitagliptin dose | 52.8 ± 15.6 | 51.7 ± 17.2 | 50.3 ± 11.8 | Wilcoxon test | ||
| N | 384 | 264 | 162 | 0.148 | 0.121 | 0.898 |
| Daily no. of insulin doses | ||||||
| 0 | 7 (1.8%) | 3 (1.1%) | 3 (1.8%) | Wilcoxon test | ||
| 1 | 70 (18.0%) | 60 (22.5%) | 43 (26.1%) | 0.039* | 0.007** | 0.287 |
| 2 | 77 (19.8%) | 55 (20.6%) | 45 (27.3%) | |||
| 3 | 102 (26.2%) | 83 (31.1%) | 28 (17.0%) | |||
| 4 | 133 (34.2%) | 66 (24.7%) | 46 (27.9%) | |||
| Mean | 2.7 | 2.6 | 2.4 | |||
| OHAs | Fisher’s exact test | |||||
| Sulfonylureas | 66 (17.0%) | 47 (17.6%) | 36 (21.8%) | 0.834 | 0.188 | 0.315 |
| Biguanides | 172 (44.2%) | 74 (27.7%) | 25 (15.2%) | < 0.001*** | < 0.001*** | 0.003** |
| Thiazolidinediones | 35 (9.0%) | 15 (5.6%) | 8 (4.8%) | 0.134 | 0.118 | 0.828 |
| Alpha-glucosidase inhibitors | 75 (19.3%) | 51 (19.1%) | 34 (20.6%) | 1 | 0.727 | 0.71 |
| Glinides | 0 (0.0%) | 0 (0.0%) | 0 (0.0%) | NA | NA | NA |
| Number of concomitant OHAs | ||||||
| 0 | 160 (41.1%) | 137 (51.3%) | 90 (54.5%) | Wilcoxon test | ||
| 1 | 125 (32.1%) | 79 (29.6%) | 51 (30.9%) | 0.005** | < 0.001*** | 0.366 |
| 2 | 89 (22.9%) | 45 (16.9%) | 20 (12.1%) | |||
| 3 | 15 (3.9%) | 6 (2.2%) | 4 (2.4%) | |||
| Mean | 0.9 | 0.7 | 0.6 | |||
| All patients | Age at enrollment | Intergroup comparison: P value | |||||
|---|---|---|---|---|---|---|---|
| A) ≤ 64 years | B) 65 - 74 years | C) ≥ 75 years | A vs. B | A vs. C | B vs. C | ||
| No. of patients analyzed | 821 (100.0%) | 389 (100.0%) | 267 (100.0%) | 165 (100.0%) | Fisher’s exact test | ||
| Severe hypoglycemia | 24 (2.9%) | 12 (3.1%) | 8 (3.0%) | 4 (2.4%) | 1.000 | 0.787 | 1.000 |
| Gastrointestinal symptoms | 9 (1.1%) | 5 (1.3%) | 3 (1.1%) | 1 (0.6%) | 1.000 | 0.675 | 1.000 |
| Constipation | 20 (2.4%) | 9 (2.3%) | 4 (1.5%) | 7 (4.2%) | 0.575 | 0.266 | 0.114 |
| Others | 20 (2.4%) | 5 (1.3%) | 9 (3.4%) | 6 (3.6%) | 0.097 | 0.093 | 1.000 |