Figures
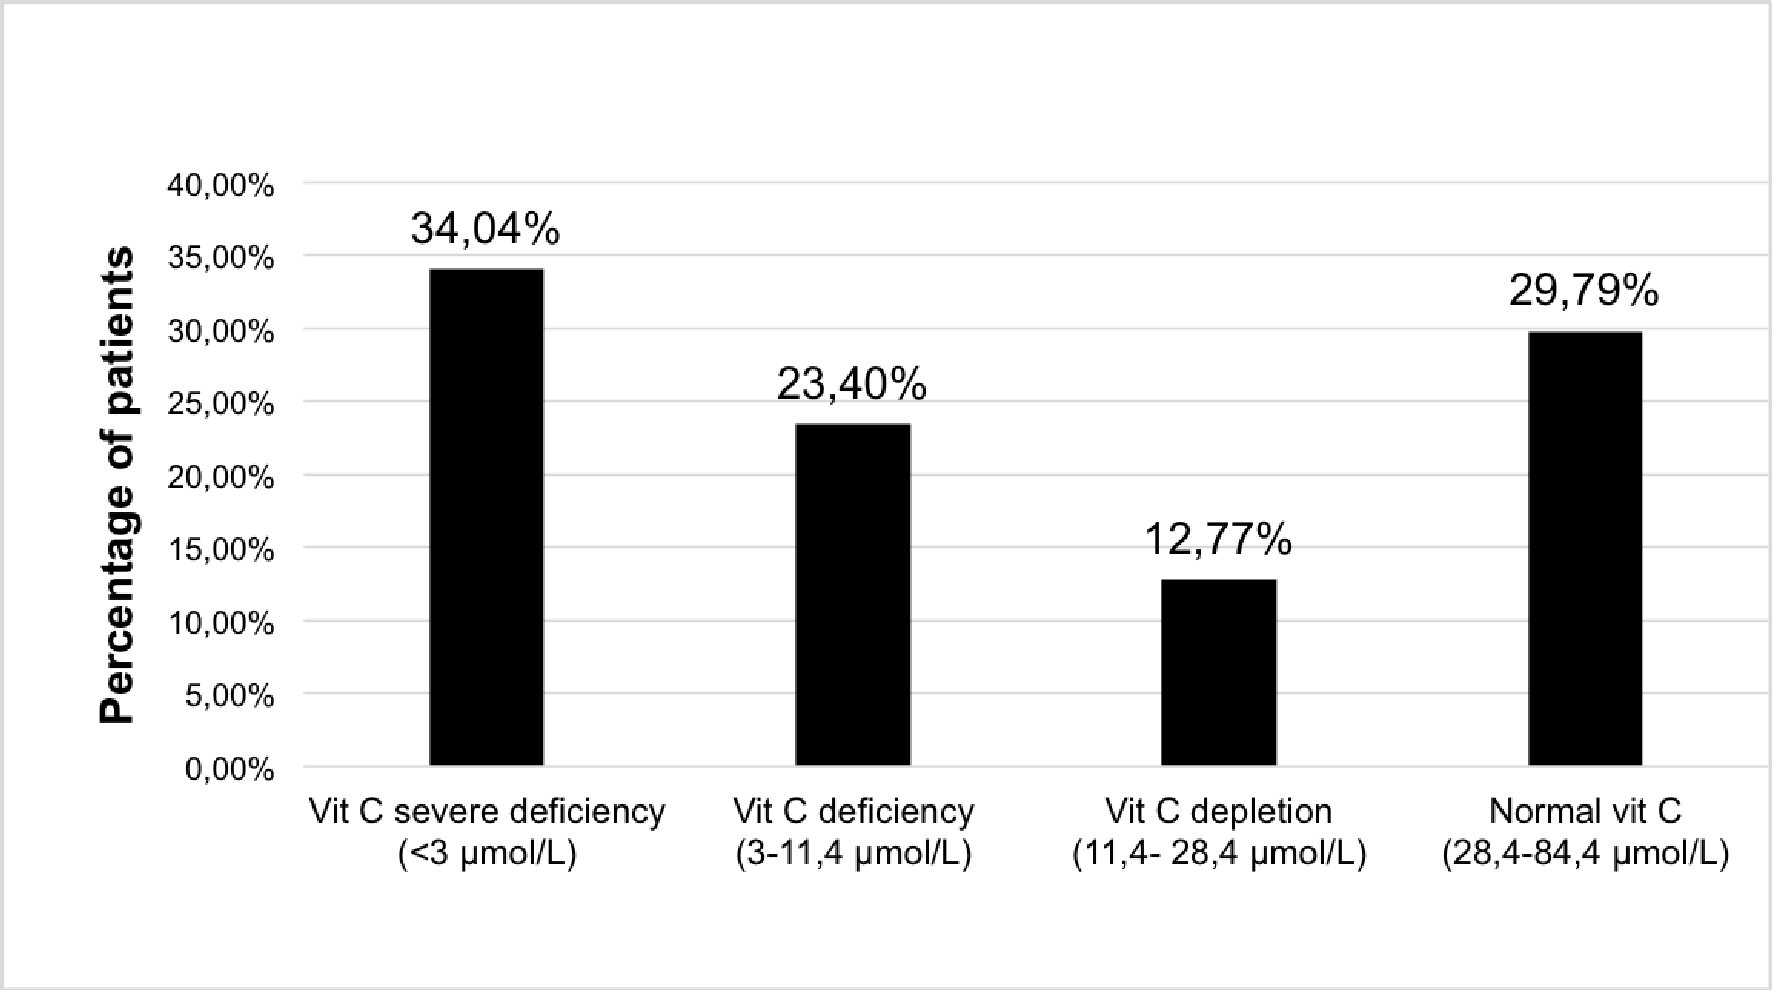
Figure 1. Distribution of plasma vitamin C concentration in patients withdrawing from alcohol. Vitamin C measures (µmol/L): severe deficiency < 3 µmol/L; deficiency: 3 - 11.4 µmol/L; depletion: 11.4 - 28.4 µmol/L; normal > 28.4 µmol/L.
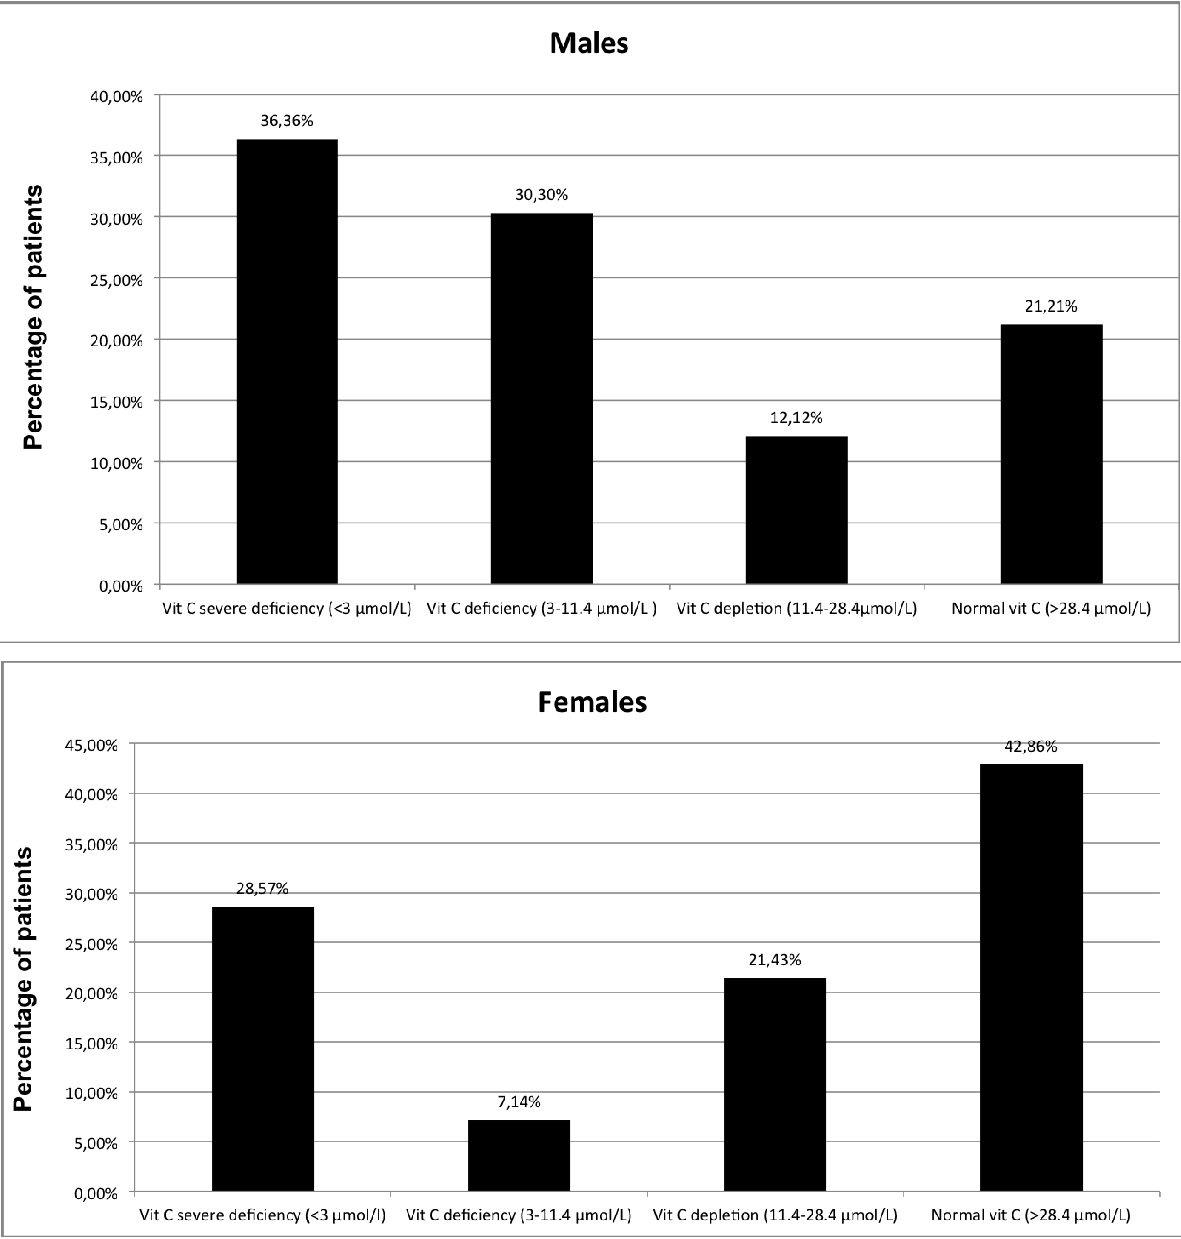
Figure 2. Distribution of plasma vitamin C concentration in patients withdrawing from alcohol by sex. Vitamin C measures (µmol/L): severe deficiency < 3 µmol/L; deficiency: 3 - 11.4 µmol/L; depletion: 11.4 - 28.4 µmol/L; normal > 28.4 µmol/L.
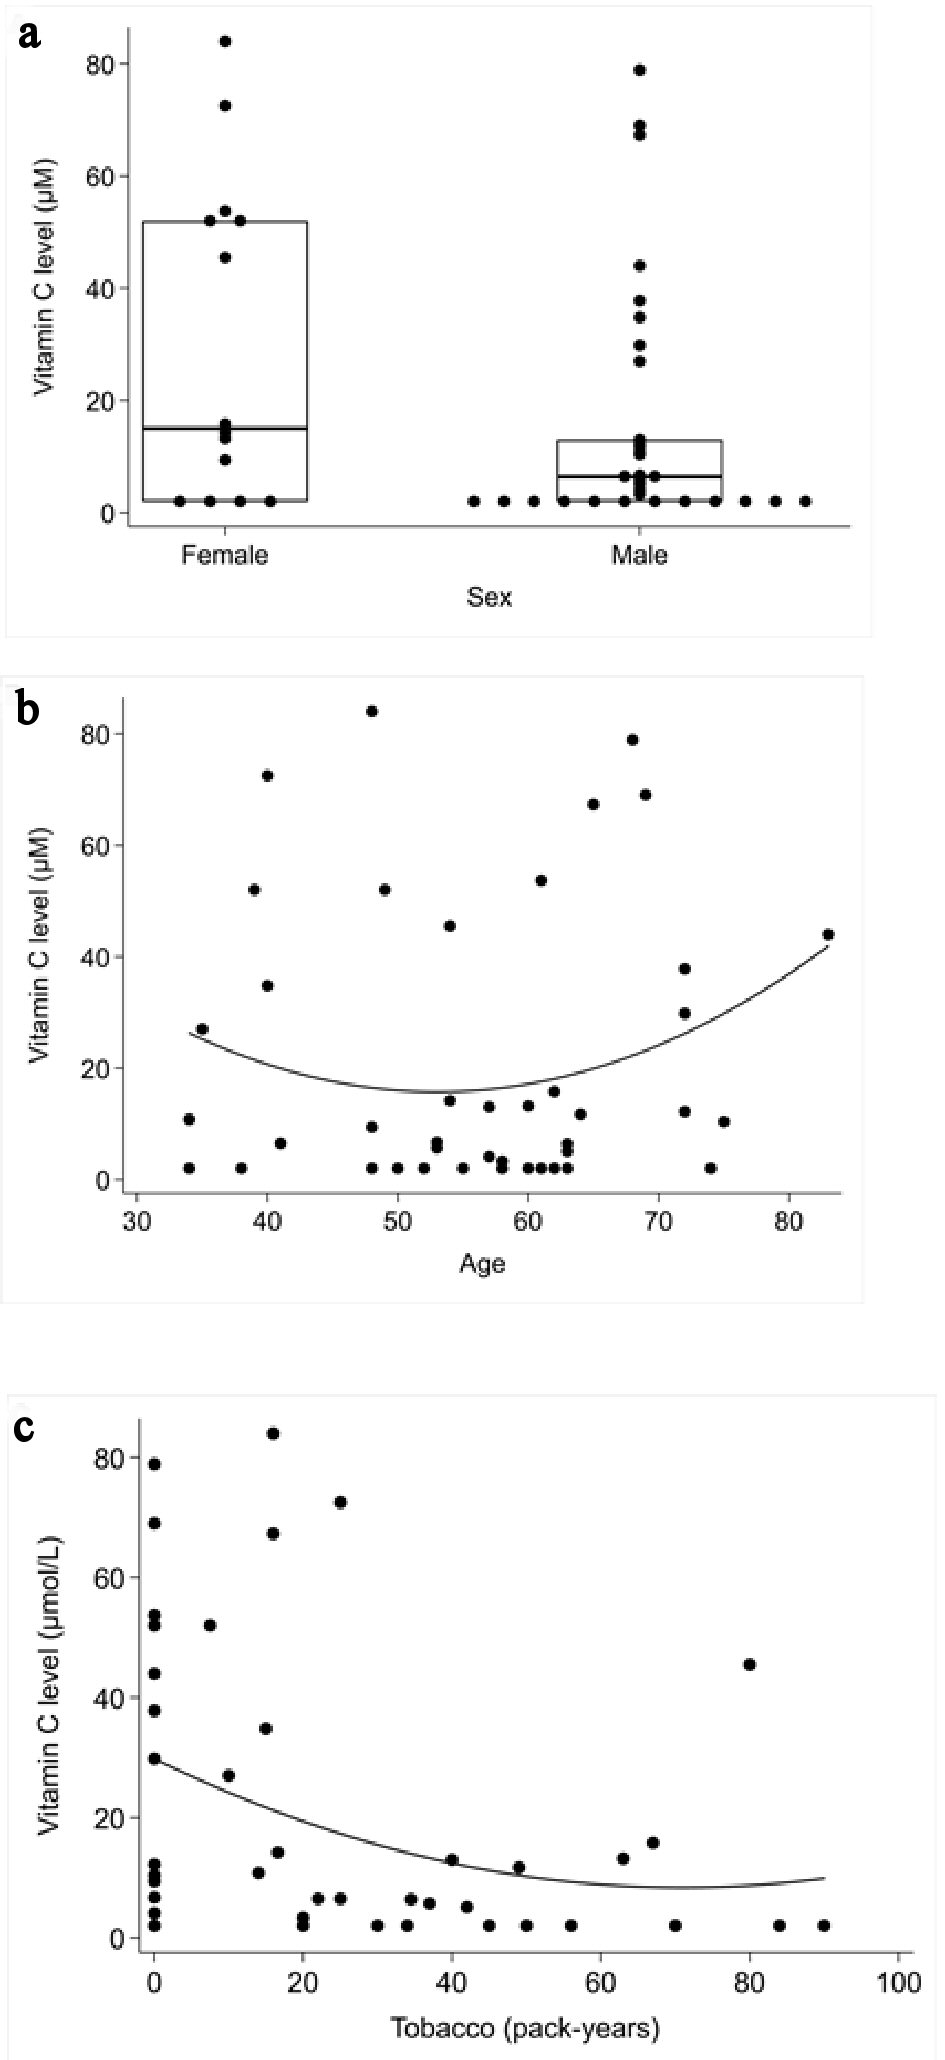
Figure 3. Correlation between plasma vitamin C concentrations and the role of the sex, age and tobacco consumption. (a) Mann-Whitney rank sum test: role of the sex Spearman’s correlation coefficient test. (b) Role of age. (c) Tobacco consumption.
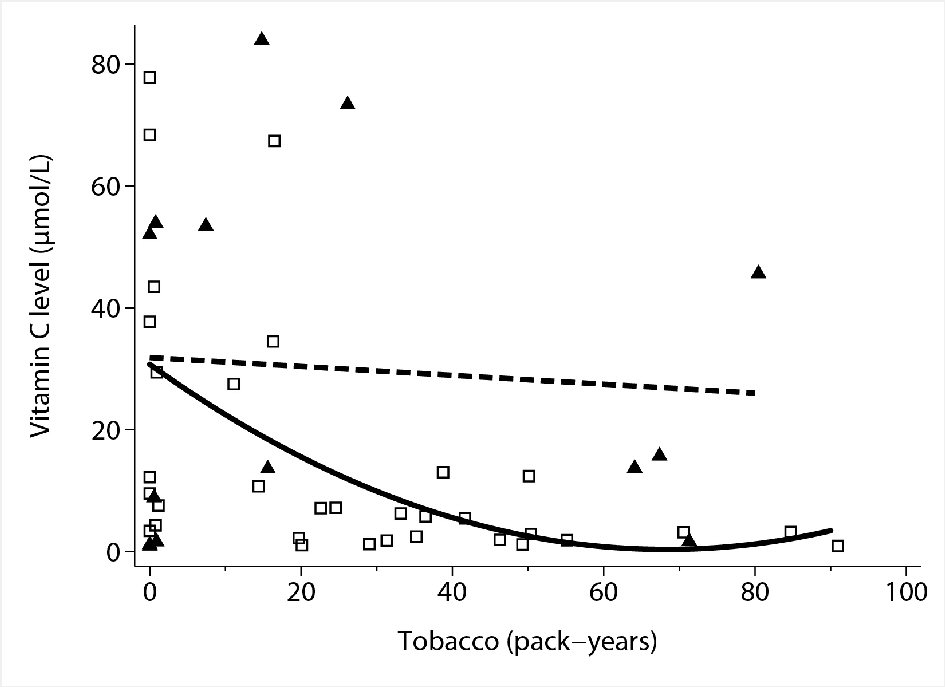
Figure 4. Association between tobacco consumption and sex and vitamin C concentrations by multivariable linear regression. Hollow squares: individual observations (males). Solid triangles: individual observations (females). Solid line: quadratic fit of vitamin C levels by tobacco use in males. Dashed line: linear fit of vitamin C levels by tobacco use in females.
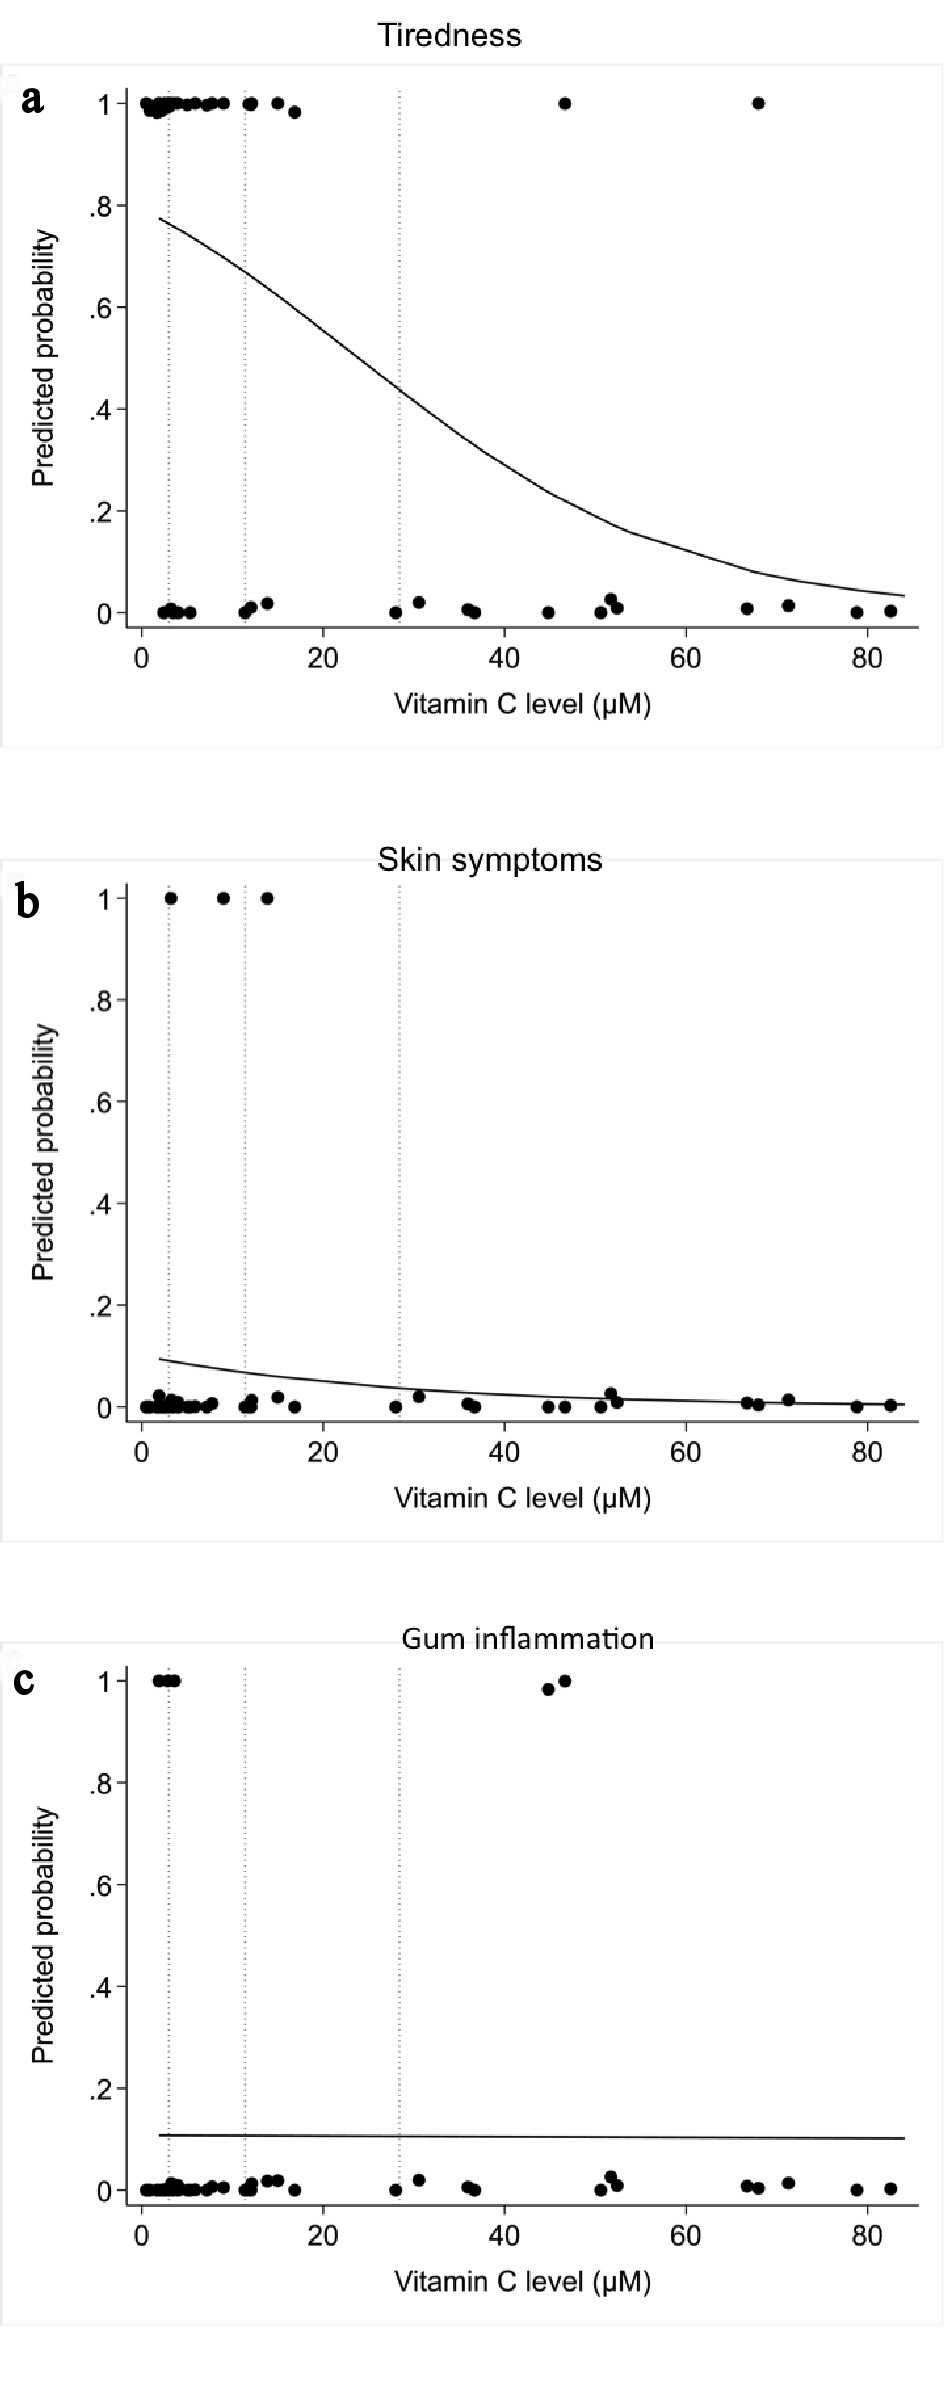
Figure 5. Correlation between plasma vitamin C concentrations and scurvy symptoms by logistic regression analysis: (a) tiredness or weakness; (b) skin symptoms; (c) gum involvement.
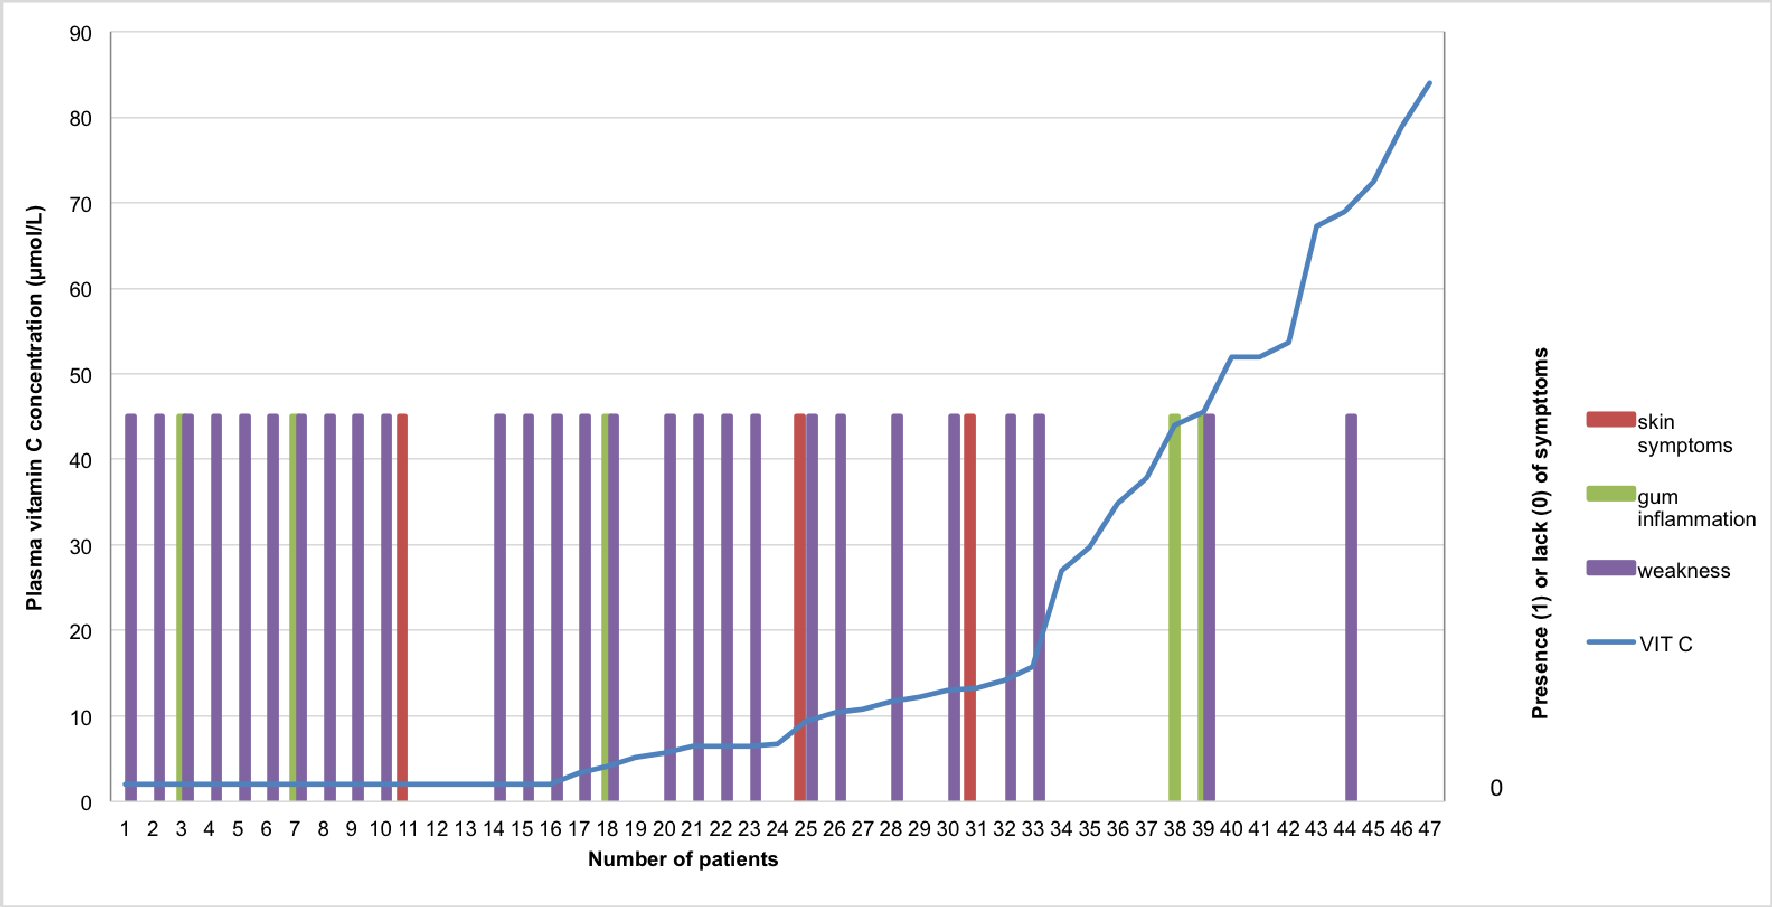
Figure 6. Correlation between plasma vitamin C concentrations and scurvy symptoms patient-individualized: In purple: tiredness or weakness; In red: skin symptoms (especially petechiae or purpura); In green: gum involvement. A transformation was applied to convert the status of tiredness, skin symptoms or gum involvement into binary variables. In regard to the binary variables: 0 corresponds to “absence of tiredness” whereas 1 means “presence of tiredness”. The same applies for the other symptoms such as skin symptoms and gum involvement.
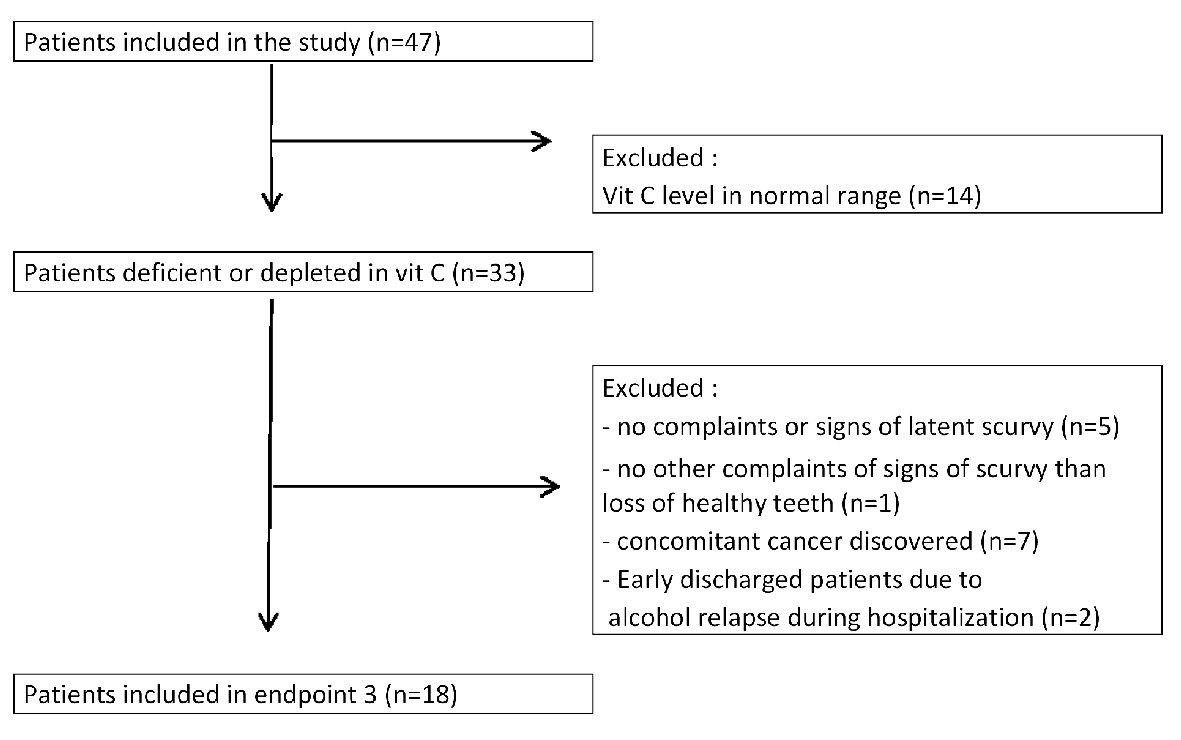
Figure 7. Study design for endpoint 3: follow-up of latent scurvy symptoms in patients supplemented with vitamin C for 3 months.
Table
Table 1. Clinical, Demographic and Biochemical Parameters of Enrolled Patients
| Males | Females |
|---|
| Number | 33 | 14 |
| Age (years) | 57.97 ± 12 | 51.73 ± 8 |
| Body mass index (kg/m2) | 25.7 ± 4.1 | 25.2 ± 6.9 |
| AST (IU/L) | 70 ± 54 | 93 ± 84 |
| Gamma-GT (IU/L) | 251 ± 262 | 385 ± 393 |
| Corpuscular volume | 95.4 ± 8.7 | 101.1 ± 8.4 |
| Platelet count (109/L) | 189,393 ± 91,053 | 224,057 ± 116,071 |
| Prothrombin (%) | 90 ± 13 | 85 ± 21 |
| Albumin (g/L) | 40.1 ± 5.3 | 39.3 ± 12.2 |
| Hepatic ultrasonography | | |
| Normal | 12/33 | 2/14 |
| Steatosis | 15/33 | 7/14 |
| Compensated cirrhosis | 4/33 | 4/14 |
| Decompensated cirrhosis | 2/33 | 1/14 |


