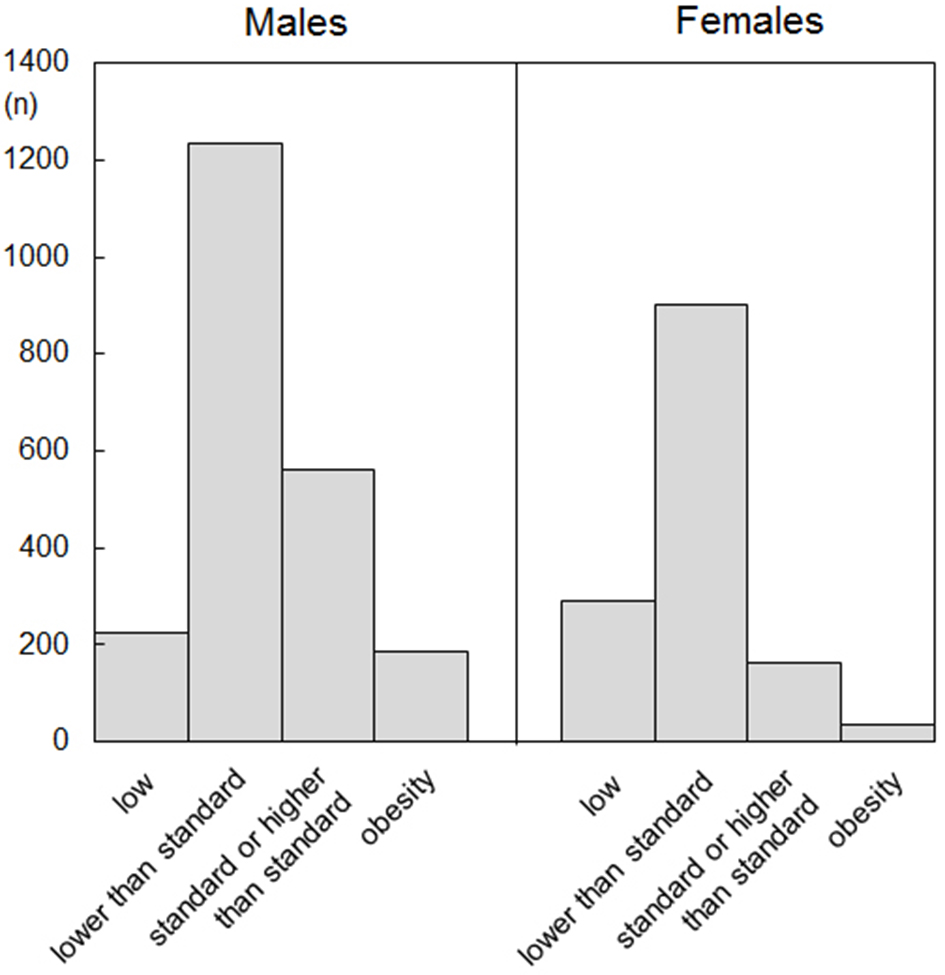
Figure 1. Histogram of body mass index (BMI) in male and female. The subjects were divided into four groups: low (18.5 > BMI), lower than standard (22.0 > BMI ≥ 18.5), standard or higher than standard (25.0 > BMI ≥ 22.0) and obesity (BMI ≥ 25.0).
| Journal of Clinical Medicine Research, ISSN 1918-3003 print, 1918-3011 online, Open Access |
| Article copyright, the authors; Journal compilation copyright, J Clin Med Res and Elmer Press Inc |
| Journal website http://www.jocmr.org |
Original Article
Volume 10, Number 10, October 2018, pages 772-780
Recommendations of Lifestyle Modification According to a Survey of First-Year University Students
Figures
Tables
| All | Gender | P value | BMI | P value | |||||||||||
|---|---|---|---|---|---|---|---|---|---|---|---|---|---|---|---|
| Low (18.5 > BMI) | Lower than standard (22.0 > BMI ≥ 18.5) | Standard or higher than standard (25.0 > BMI ≥ 22.0) | Obesity (BMI ≥ 25.0) | ||||||||||||
| Males | Females | Males | Females | Males | Females | Males | Females | Males | Females | Males | Females | ||||
| n (%), the number of subjects (percentage); BMI, body mass index. | |||||||||||||||
| n | 3,598 (100) | 2,206 (100) | 1,392 (100) | 224 (10.2) | 292 (21.0) | 1,233 (55.9) | 902 (64.8) | 562 (25.5) | 164 (11.8) | 187 (8.5) | 34 (2.4) | ||||
| (100) | (100) | (100) | (100) | (100) | (100) | (100) | (100) | (100) | (100) | (100) | |||||
| Age (years) | 18 | 2,241 (62.3) | 1,301 (59.0) | 940 (67.5) | < 0.001 | 129 (57.6) | 173 (59.2) | 729 (59.1) | 634 (70.3) | 339 (60.3) | 113 (68.9) | 104 (55.6) | 20 (58.8) | 0.005 | 0.003 |
| 19 | 1,089 (30.3) | 710 (32.2) | 379 (27.2) | 74 (33.0) | 94 (24.8) | 413 (33.5) | 234 (25.9) | 171 (30.4) | 40 (24.4) | 52 (27.8) | 11 (32.4) | ||||
| Over 20 | 268 (7.4) | 195 (8.8) | 73(5.2) | 21 (9.4) | 25 (8.6) | 91 (7.4) | 34 (3.8) | 52 (9.3) | 11 (6.7) | 31 (16.6) | 3 (8.8) | ||||
| Housing | Alone | 1,156 (32.1) | 791 (35.9) | 365 (26.2) | < 0.001 | 87 (38.8) | 83 (28.4) | 436 (35.4) | 221 (24.5) | 206 (36.9) | 55 (33.5) | 62 (33.2) | 6 (17.6) | 0.153 | 0.135 |
| With their relative | 2,226 (61.9) | 1,255 (57.0) | 971 (69.8) | 130 (58.0) | 198 (67.8) | 708 (57.5) | 641 (71.1) | 306 (54.7) | 106 (64.6) | 111 (59.4) | 26 (76.5) | ||||
| Others | 216 (6.0) | 160 (7.3) | 56 (4.0) | 7 (3.1) | 11 (3.8) | 89 (7.2) | 40 (4.4) | 50 (8.9) | 3 (1.8) | 14 (7.5) | 2 (5.9) | ||||
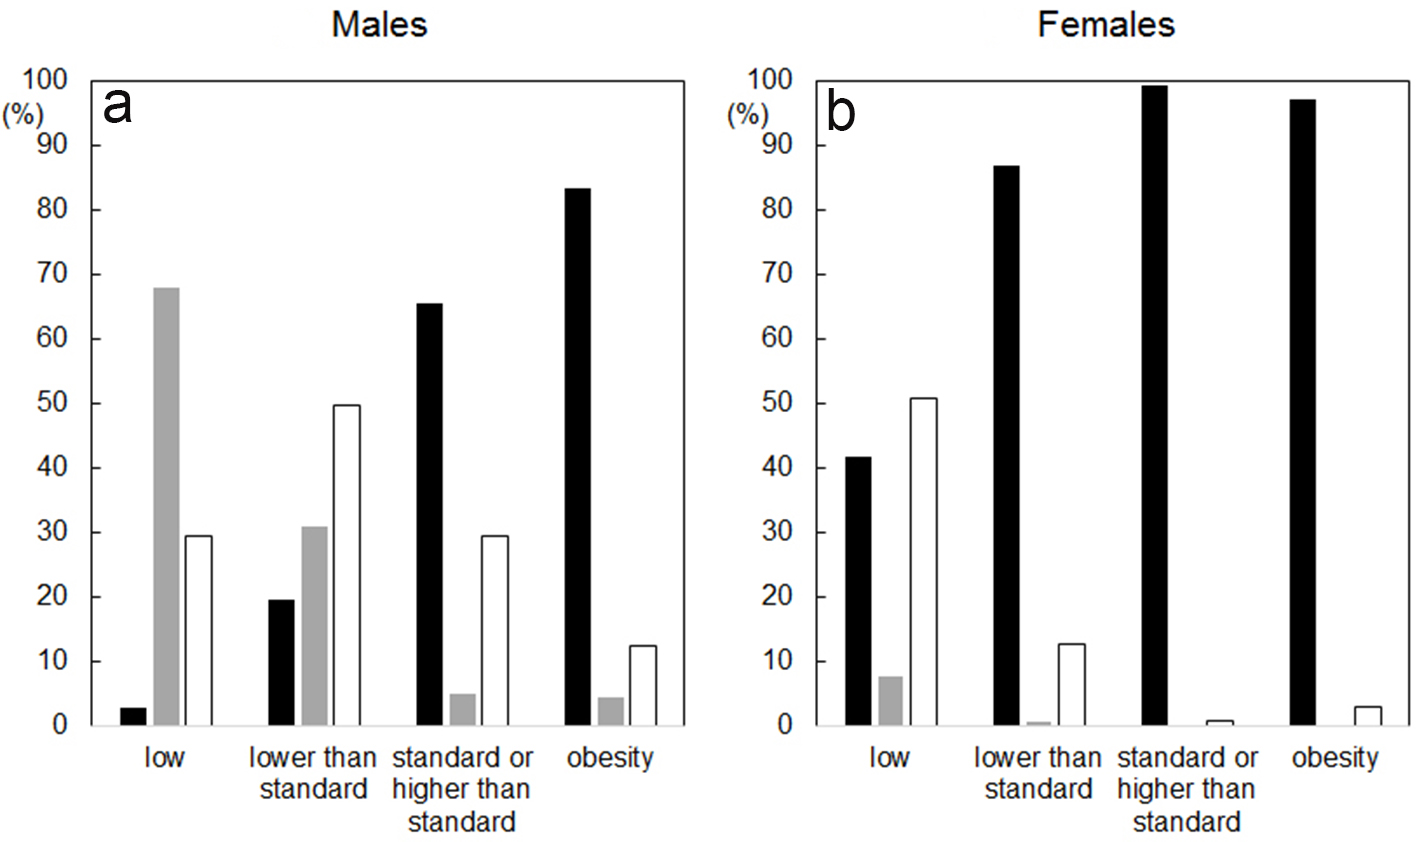
| Body image | Want to lose weight | 1,855 (52.0) | 767 (35.0) | 1,088 (79.2) | < 0.001 | 6 (2.7) | 119 (41.6) | 240 (19.6) | 773 (86.9) | 366 (65.6) | 163 (99.4) | 155 (83.3) | 33 (97.1) | < 0.001 | < 0.001 |
| Want to gain weight | 593 (16.6) | 565 (25.8) | 28 (2.0) | 152 (67.9) | 22 (7.7) | 377 (30.8) | 6 (0.7) | 28 (5.0) | 0 (0.0) | 8 (4.3) | 0 (0.0) | ||||
| Want to stay the same weight | 1,120 (31.4) | 862 (39.3) | 258 (18.8) | 66 (29.5) | 145 (50.7) | 609 (49.7) | 111 (12.5) | 164 (29.4) | 1 (0.6) | 23 (12.4) | 1 (2.9) | ||||
| Interest in promoting health | No | 162 (4.5) | 119 (5.4) | 43 (3.1) | 0.001 | 15 (6.7) | 7 (2.4) | 63 (5.1) | 33 (3.7) | 34 (6.1) | 3 (1.8) | 7 (3.7) | 0 (0.0) | 0.254 | 0.433 |
| Not much | 785 (21.9) | 500 (22.7) | 285 (20.6) | 57 (25.4) | 67 (23.1) | 294 (23.9) | 180 (20.1) | 113 (20.2) | 33 (20.1) | 36 (19.3) | 5 (14.7) | ||||
| Moderately | 1,770 (49.4) | 1045 (47.5) | 725 (52.4) | 109 (48.7) | 150 (51.7) | 579 (47.1) | 471 (52.6) | 262 (46.8) | 81 (49.4) | 95 (50.8) | 23 (67.6) | ||||
| Yes | 867 (24.2) | 537 (24.4) | 330 (23.9) | 43 (19.2) | 66 (22.8) | 294 (23.9) | 211 (23.6) | 151 (27.0) | 47 (28.4) | 49 (26.2) | 6 (17.6) | ||||
| All | Gender | P value | BMI | P value | |||||||||||
|---|---|---|---|---|---|---|---|---|---|---|---|---|---|---|---|
| Low (18.5 > BMI) | Lower than standard (22.0 > BMI ≥ 18.5) | Standard or higher than standard (25.0 > BMI ≥ 22.0) | Obesity (BMI ≥ 25.0) | ||||||||||||
| Males | Females | Males | Females | Males | Females | Males | Females | Males | Females | Males | Females | ||||
| n (%), the number of subjects (percentage); BMI, body mass index. | |||||||||||||||
| n | 3,591 (100) | 2,201 (100) | 1,390 (100) | 223 (10.1) | 292 (21.0) | 1,232 (56.0) | 900 (64.7) | 560 (25.4) | 164 (11.8) | 186 (8.5) | 34 (2.4) | ||||
| (100) | (100) | (100) | (100) | (100) | (100) | (100) | (100) | (100) | (100) | (100) | |||||
| Health levels (HL) | Low (HL > 3.9) | 871 (24.3) | 582 (26.4) | 289 (20.8) | < 0.001 | 71 (31.8) | 59 (20.2) | 280 (22.7) | 188 (20.9) | 142 (25.4) | 28 (17.1) | 89 (47.8) | 14 (41.2) | < 0.001 | 0.036 |
| Slightly low (5.5 > HL ≥ 3.9) | 896 (25.0) | 559 (24.5) | 337 (24.2) | 66 (29.6) | 68 (23.3) | 295 (23.9) | 208 (23.1) | 149 (26.6) | 52 (31.7) | 49 (26.3) | 9 (26.5) | ||||
| Slightly high (7.6 > HL ≥ 5.5) | 923 (25.7) | 539 (24.5) | 384 (27.6) | 44 (19.7) | 79 (27.1) | 336 (27.3) | 255 (28.3) | 134 (23.9) | 42 (25.6) | 25 (13.4) | 8 (23.5) | ||||
| High (HL ≥ 7.6) | 901 (25.1) | 521 (23.7) | 380 (27.3) | 42 (18.8) | 86 (29.5) | 321 (26.1) | 249 (27.7) | 135 (24.1) | 42 (25.6) | 23 (12.4) | 3 (8.8) | ||||
| All | Gender | P value | BMI | P value | |||||||||||
|---|---|---|---|---|---|---|---|---|---|---|---|---|---|---|---|
| Low (18.5 > BMI) | Lower than standard (22.0 > BMI ≥ 18.5) | Standard or higher than standard (25.0 > BMI ≥ 22.0) | Obesity (BMI ≥ 25.0) | ||||||||||||
| Males | Females | Males | Females | Males | Females | Males | Females | Males | Females | Males | Females | ||||
| n (%), the number of subjects (percentage); BMI, body mass index. | |||||||||||||||
| n | 3,598 (100) | 2,206 (100) | 1,392 (100) | 224 (10.2) | 292 (21.0) | 1,233 (55.9) | 902 (64.8) | 562 (25.5) | 164 (11.8) | 187 (8.5) | 34 (2.4) | ||||
| (100) | (100) | (100) | (100) | (100) | (100) | (100) | (100) | (100) | (100) | (100) | |||||
| Stress | Not feel | 342 (9.5) | 229 (10.4) | 113 (8.1) | < 0.001 | 13 (5.8) | 25 (8.6) | 135 (11.0) | 74 (8.2) | 57 (10.2) | 12 (7.3) | 24 (12.8) | 2 (5.9) | 0.103 | 0.211 |
| Hardly feel | 1,183 (33.0) | 777 (35.4) | 406 (29.2) | 76 (33.9) | 100 (34.4) | 435 (35.5) | 248 (27.5) | 213 (38.0) | 51 (31.1) | 53 (28.3) | 7 (20.6) | ||||
| Sometimes feel | 1,785 (49.8) | 1,011 (46.0) | 774 (55.7) | 112 (50.0) | 151 (51.9) | 562 (45.9) | 506 (56.2) | 247 (44.0) | 93 (56.7) | 90 (48.1) | 24 (70.6) | ||||
| Always feel | 277 (7.7) | 180 (8.2) | 97 (7.0) | 23 (10.3) | 15 (5.2) | 93 (7.6) | 73 (8.1) | 44 (7.8) | 8 (4.9) | 20 (10.7) | 1 (2.9) | ||||
| Need to reduce stress | 503 (14.0) | 287 (13.0) | 216 (15.5) | 0.035 | 27 (12.1) | 55 (18.8) | 171 (13.9) | 133 (14.7) | 71 (12.6) | 25 (15.2) | 18 (9.6) | 3 (8.8) | 0.400 | 0.258 | |
| Cause of stress | Study at the university | 1,308 (36.4) | 858 (38.9) | 450 (32.3) | < 0.001 | 90 (40.2) | 91 (31.2) | 459 (37.2) | 293 (32.5) | 236 (42.0) | 53 (32.3) | 73 (39.0) | 13 (38.2) | 0.276 | 0.865 |
| Part-time job | 576 (16.0) | 346 (15.7) | 230 (16.5) | 0.504 | 36 (16.1) | 46 (15.8) | 206 (16.7) | 155 (17.2) | 84 (14.9) | 25 (15.2) | 20 (10.7) | 4 (11.8) | 0.191 | 0.762 | |
| Friend relations | 548 (15.2) | 275 (12.5) | 273 (19.6) | < 0.001 | 31 (11.8) | 53 (18.2) | 152 (12.3) | 171 (19.0) | 67 (11.9) | 36 (22.0) | 25 (13.4) | 13 (38.2) | 0.873 | 0.034 | |
| Employment and career path | 354 (9.8) | 223 (10.1) | 131 (9.4) | 0.494 | 23 (10.3) | 31 (10.6) | 130 (10.5) | 72 (8.0) | 54 (9.6) | 24 (14.6) | 16 (8.6) | 4 (11.8) | 0.822 | 0.043 | |
| Parent-child relationship | 329 (9.1) | 159 (7.2) | 170 (12.2) | < 0.001 | 16 (7.1) | 35 (12.0) | 96 (7.8) | 112 (12.4) | 36 (6.4) | 22 (13.4) | 11 (5.9) | 1 (2.9) | 0.648 | 0.932 | |
| Club or circle activity | 204 (5.7) | 130 (5.9) | 74 (5.3) | 0.466 | 9 (4.0) | 15 (5.1) | 70 (5.7) | 48 (5.3) | 39 (6.9) | 8 (4.9) | 12 (6.4) | 3 (8.8) | 0.436 | 0.822 | |
| Love relations | 188 (5.2) | 120 (5.4) | 68 (4.9) | 0.467 | 10 (4.5) | 19 (6.5) | 73 (5.9) | 43 (4.8) | 29 (5.2) | 5 (3.0) | 8 (4.3) | 1 (2.9) | 0.672 | 0.370 | |
| Others | 341 (9.5) | 192 (8.7) | 149 (10.7) | 0.046 | 22 (9.8) | 34 (11.6) | 103 (8.4) | 99 (11.0) | 44 (7.8) | 13 (7.9) | 23 (12.3) | 3 (8.8) | 0.248 | 0.617 | |
| Method used to relieve stress | Spending time with friend | 1,601 (44.5) | 912 (41.3) | 689 (49.5) | < 0.001 | 91 (40.6) | 156 (53.4) | 524 (42.5) | 454 (50.3) | 225 (40.0) | 68 (41.5) | 72 (38.5) | 11 (32.4) | 0.627 | 0.016 |
| Personal computers, televisions and games, etc. | 985 (27.4) | 670 (30.4) | 315 (22.6) | < 0.001 | 96 (42.9) | 60 (20.5) | 341 (27.7) | 187 (20.7) | 151 (26.9) | 51 (31.1) | 82 (43.9) | 17 (50.0) | < 0.001 | < 0.001 | |
| Exercise and sports | 926 (25.7) | 757 (34.3) | 169 (12.1) | < 0.001 | 43 (19.2) | 36 (21.3) | 426 (34.5) | 117 (13.0) | 228 (40.6) | 15 (9.1) | 60 (32.1) | 1 (2.9) | < 0.001 | 0.198 | |
| Shopping | 494 (13.7) | 160 (7.3) | 334 (24.0) | < 0.001 | 27 (12.1) | 74 (25.3) | 83 (6.7) | 216 (23.9) | 39 (6.9) | 40 (24.4) | 11 (5.9) | 4 (11.8) | 0.032 | 0.377 | |
| Relaxation | 50 (1.4) | 13 (0.6) | 37 (2.7) | < 0.001 | 1 (0.4) | 11 (3.8) | 8 (0.6) | 19 (2.1) | 3 (0.5) | 7 (4.3) | 1 (0.5) | 0 (0.0) | 0.979 | 0.170 | |
| Cannot dissolve | 190 (5.3) | 111 (5.0) | 79 (5.7) | 0.401 | 11 (4.9) | 20 (6.8) | 68 (5.5) | 48 (5.3) | 21 (3.7) | 11 (6.7) | 11 (5.9) | 0 (0.0) | 0.413 | 0.343 | |
| Others | 342 (9.5) | 131 (5.9) | 211 (15.2) | < 0.001 | 14 (6.3) | 42 (14.4) | 76 (6.2) | 132 (14.6) | 31 (5.5) | 29 (17.7) | 10 (5.3) | 8 (23.5) | 0.930 | 0.392 | |
| All | Gender | P value | BMI | P value | ||||||||||
|---|---|---|---|---|---|---|---|---|---|---|---|---|---|---|
| Low (18.5 > BMI) | Lower than standard (22.0 > BMI ≥ 18.5) | Standard or higher than standard (25.0 > BMI ≥ 22.0) | Obesity (BMI ≥ 25.0) | |||||||||||
| Males | Females | Males | Females | Males | Females | Males | Females | Males | Females | Males | Females | |||
| n (%), the number of subjects (percentage); BMI, body mass index. There were the subjects who had multiple answers. | ||||||||||||||
| n | 3,598 (100) | 2,206 (100) | 1,392 (100) | 224 (10.2) | 292 (21.0) | 1,233 (55.9) | 902 (64.8) | 562 (25.5) | 164 (11.8) | 187 (8.5) | 34 (2.4) | |||
| (100) | (100) | (100) | (100) | (100) | (100) | (100) | (100) | (100) | (100) | (100) | ||||
| Poor dietary habits | 1,104 (30.7) | 690 (31.3) | 414 (29.7) | 0.330 | 70 (31.3) | 79 (27.1) | 360 (29.2) | 271 (30.0) | 190 (33.8) | 51 (31.1) | 70 (37.4) | 13 (38.2) | 0.059 | 0.500 |
| Lack of exercise | 1,548 (43.0) | 841 (38.1) | 707 (50.8) | < 0.001 | 90 (40.2) | 141 (48.3) | 412 (33.4) | 446 (49.4) | 239 (42.5) | 100 (61.0) | 100 (53.5) | 20 (58.8) | < 0.001 | 0.028 |
| Irregular schedule | 1,140 (31.7) | 728 (33.0) | 412 (29.6) | 0.033 | 83 (37.1) | 96 (32.9) | 434 (35.2) | 274 (30.4) | 167 (29.7) | 38 (23.2) | 44 (23.5) | 4 (11.8) | 0.002 | 0.017 |
| Others | 79 (2.2) | 64 (2.9) | 25 (1.8) | 0.194 | 3 (1.3) | 4 (1.4) | 33 (2.7) | 17 (1.9) | 13 (2.3) | 4 (2.4) | 5 (2.7) | 0 (0.0) | 0.681 | 0.718 |
| Not necessary | 132 (3.7) | 106 (4.8) | 26 (1.9) | < 0.001 | 8 (3.6) | 4 (1.4) | 67 (5.4) | 18 (2.0) | 23 (4.1) | 4 (2.4) | 8 (4.3) | 0 (0.0) | 0.467 | 0.702 |
| All | Gender | P value | BMI | P value | |||||||||||
|---|---|---|---|---|---|---|---|---|---|---|---|---|---|---|---|
| Low (18.5 > BMI) | Lower than standard (22.0 > BMI ≥ 18.5) | Standard or higher than standard (25.0 > BMI ≥ 22.0) | Obesity (BMI ≥ 25.0) | ||||||||||||
| Males | Females | Males | Females | Males | Females | Males | Females | Males | Females | Males | Females | ||||
| n (%), the number of subjects (percentage); BMI, body mass index. | |||||||||||||||
| n | 3,598 (100) | 2,206 (100) | 1,392 (100) | 224 (10.2) | 292 (21.0) | 1,233 (55.9) | 902 (64.8) | 562 (25.5) | 164 (11.8) | 187 (8.5) | 34 (2.4) | ||||
| (100) | (100) | (100) | (100) | (100) | (100) | (100) | (100) | (100) | (100) | (100) | |||||
| Eat regular meals three times a day | Yes | 2,240 (62.3) | 1,258 (57.0) | 982 (70.6) | < 0.001 | 115 (51.3) | 218 (74.7) | 694 (56.3) | 626 (69.6) | 339 (60.3) | 115 (70.1) | 110 (58.8) | 23 (67.6) | 0.113 | 0.399 |
| No | 1,356 (37.7) | 948 (43.0) | 408 (29.4) | 109 (48.7) | 74 (25.3) | 539 (43.7) | 274 (30.4) | 223 (39.7) | 49 (29.9) | 77 (41.2) | 11 (32.4) | ||||
| Sleep habits | Unhealthy | 261 (7.3) | 163 (7.4) | 98 (7.1) | 0.007 | 14 (8.6) | 19 (6.5) | 95 (7.7) | 65 (7.3) | 43 (7.7) | 12 (7.4) | 11 (5.9) | 2 (5.9) | 0.419 | 0.931 |
| Sometimes wake up | 843 (23.5) | 555 (25.2) | 288 (20.8) | 67 (29.9) | 62 (21.2) | 316 (25.8) | 182 (20.3) | 128 (22.8) | 34 (20.9) | 44 (23.5) | 10 (29.4) | ||||
| Soundly | 2,479 (69.2) | 1,481 (67.3) | 998 (72.1) | 143 (63.8) | 211 (72.3) | 816 (66.5) | 648 (72.4) | 390 (69.5) | 117 (71.8) | 132 (70.6) | 22 (64.7) | ||||
| Wake up | Getting up is good | 1,387 (39.8) | 847 (40.0) | 540 (39.6) | 0.849 | 79 (35.7) | 114 (39.9) | 465 (39.5) | 343 (38.9) | 225 (41.7) | 67 (41.4) | 78 (43.1) | 16 (50.0) | 0.372 | 0.604 |
| Cannot wake up in the morning | 2,094 (60.2) | 1,272 (60.0) | 822 (60.4) | 142 (64.3) | 172 (60.1) | 712 (60.5) | 539 (61.1) | 315 (58.3) | 95 (58.6) | 103 (56.9) | 16 (50.0) | ||||
| Sleeping hours | 4 h or less | 227 (6.3) | 133 (6.0) | 94 (6.8) | 0.002 | 19 (8.5) | 18 (6.2) | 79 (6.4) | 63 (7.0) | 22 (3.9) | 9 (5.5) | 13 (7.0) | 4 (11.8) | 0.413 | 0.968 |
| 5 h table | 804 (22.4) | 446 (20.2) | 358 (25.8) | 47 (21.0) | 71 (24.4) | 243 (19.7) | 237 (26.3) | 118 (21.0) | 42 (25.8) | 38 (20.3) | 8 (23.5) | ||||
| 6 h table | 1,617 (45.0) | 1,021 (46.3) | 596 (42.9) | 97 (43.3) | 129 (44.3) | 571 (46.4) | 381 (42.2) | 262 (46.7) | 71 (43.6) | 91 (48.7) | 15 (44.1) | ||||
| 7 h table | 754 (21.0) | 477 (21.7) | 277 (19.9) | 48 (21.4) | 63 (21.6) | 259 (21.0) | 176 (19.5) | 132 (23.5) | 32 (19.6) | 38 (20.3) | 6 (17.6) | ||||
| More than 8 h | 191 (5.3) | 126 (5.7) | 65 (4.7) | 13 (5.8) | 10 (3.4) | 79 (6.4) | 45 (5.0) | 27 (4.8) | 9 (5.5) | 7 (3.7) | 1 (2.8) | ||||
| Exercise | Not do it | 618 (17.2) | 208 (9.4) | 410 (29.5) | < 0.001 | 38 (17.0) | 102 (34.9) | 104 (8.4) | 258 (28.7) | 46 (8.2) | 40 (24.4) | 20 (10.7) | 10 (29.4) | < 0.001 | 0.438 |
| Hardly do it | 1,178 (32.8) | 628 (28.5) | 550 (39.6) | 92 (41.3) | 112 (38.4) | 358 (29.1) | 350 (38.9) | 126 (22.5) | 73 (44.5) | 52 (27.8) | 15 (44.1) | ||||
| Sometimes do it | 1,350 (37.6) | 1,000 (45.4) | 350 (25.2) | 73 (32.7) | 64 (21.9) | 583 (47.3) | 236 (26.2) | 264 (47.1) | 43 (26.2) | 80 (42.8) | 7 (20.6) | ||||
| Do it well | 447 (12.4) | 367 (16.7) | 80 (5.8) | 20 (9.0) | 14 (4.8) | 187 (15.2) | 56 (6.2) | 125 (22.3) | 8 (4.9) | 35 (18.7) | 2 (5.9) | ||||
| Ingenuity of exercise | Not do it | 360 (10.1) | 205 (9.4) | 155 (11.2) | < 0.001 | 31 (14.0) | 44 (15.3) | 123 (10.1) | 96 (10.7) | 36 (6.4) | 14 (8.5) | 15 (8.1) | 1 (2.9) | 0.004 | 0.135 |
| Hardly do it | 810 (22.7) | 502 (22.9) | 308 (22.3) | 50 (22.6) | 65 (22.6) | 306 (25.0) | 208 (23.2) | 115 (20.5) | 28 (17.1) | 31 (16.7) | 7 (20.6) | ||||
| Sometimes do it | 1,849 (51.8) | 1,104 (50.4) | 745 (53.9) | 105 (47.5) | 148 (51.4) | 591 (48.3) | 475 (53.0) | 302 (53.9) | 101 (61.6) | 106 (57.0) | 21 (61.8) | ||||
| Always | 553 (15.5) | 379 (17.3) | 174 (12.6) | 35 (15.8) | 31 (10.8) | 203 (16.6) | 117 (13.1) | 107 (19.1) | 21 (12.8) | 34 (18.3) | 5 (14.7) | ||||