Journal of Clinical Medicine Research, ISSN 1918-3003 print, 1918-3011 online, Open Access
Article copyright, the authors; Journal compilation copyright, J Clin Med Res and Elmer Press Inc
Journal website http://www.jocmr.org

Original Article

Volume 10, Number 9, September 2018, pages 700-706


Soluble Fms-Like Tyrosine Kinase-1 Is A Marker of Endothelial Dysfunction During Sepsis

Figures

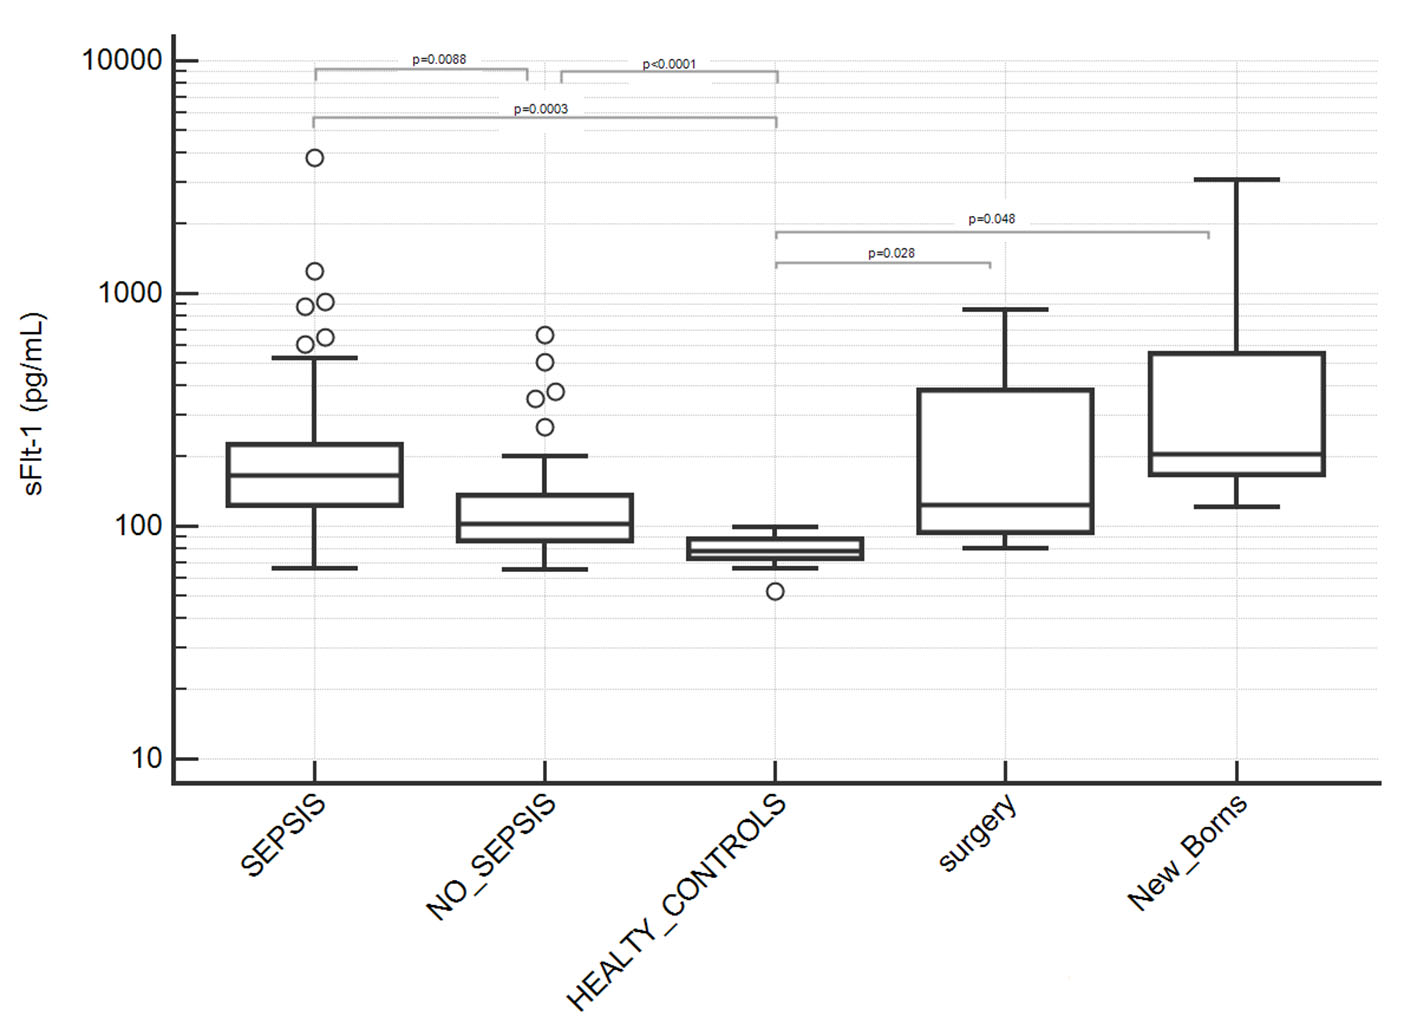
Figure 1.
Figure 1. Serum levels of sFlt-1 in patients groups. Septic patients showed significantly higher levels of sFlt-1 compared to sepsis-negative patients and healthy controls (P values indicated in figure; where not indicated, difference was not statistically significant). Two subgroups of sepsis-negative patients who underwent surgery or new borns were separately analyzed due to a potential not baseline condition for sFlt-1 assay after surgery or after birth; they showed a statistically significant difference with healthy controls but not with sepsis-positive nor -negative patients. Results are showed in semilogarithmic plot.
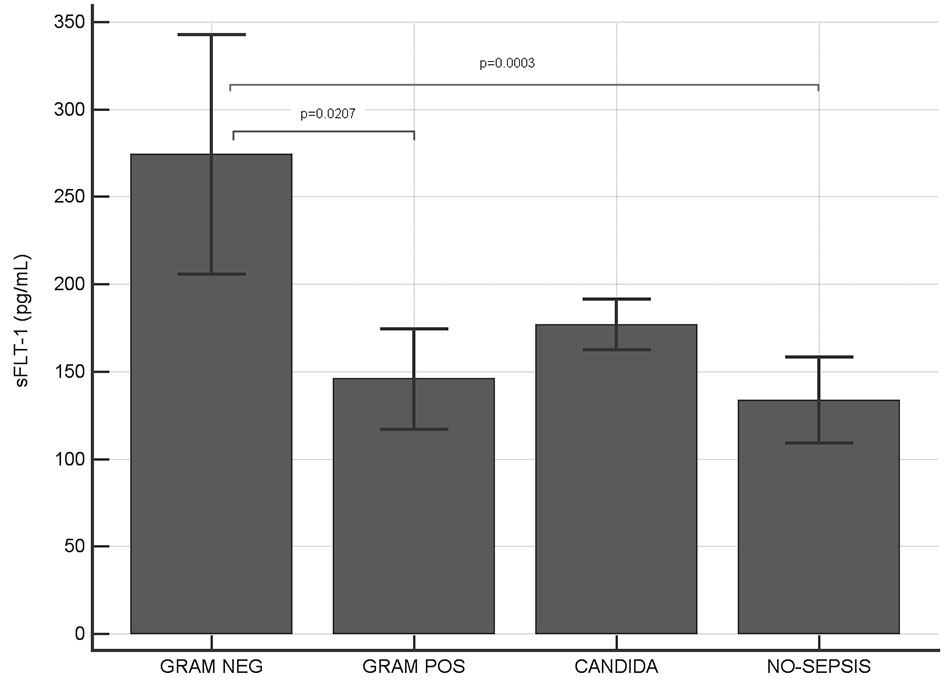
Figure 2.
Figure 2. Serum levels of sFlt-1 in Gram-negative, Gram-positive, Candida infections and in sepsis-negative individuals. Significant higher levels of sFlt-1 have been observed in Gram-negative infected patients compared to both Gram-positive and sepsis-negative patients (P values indicated in figure; where not indicated, difference was not statistically significant).
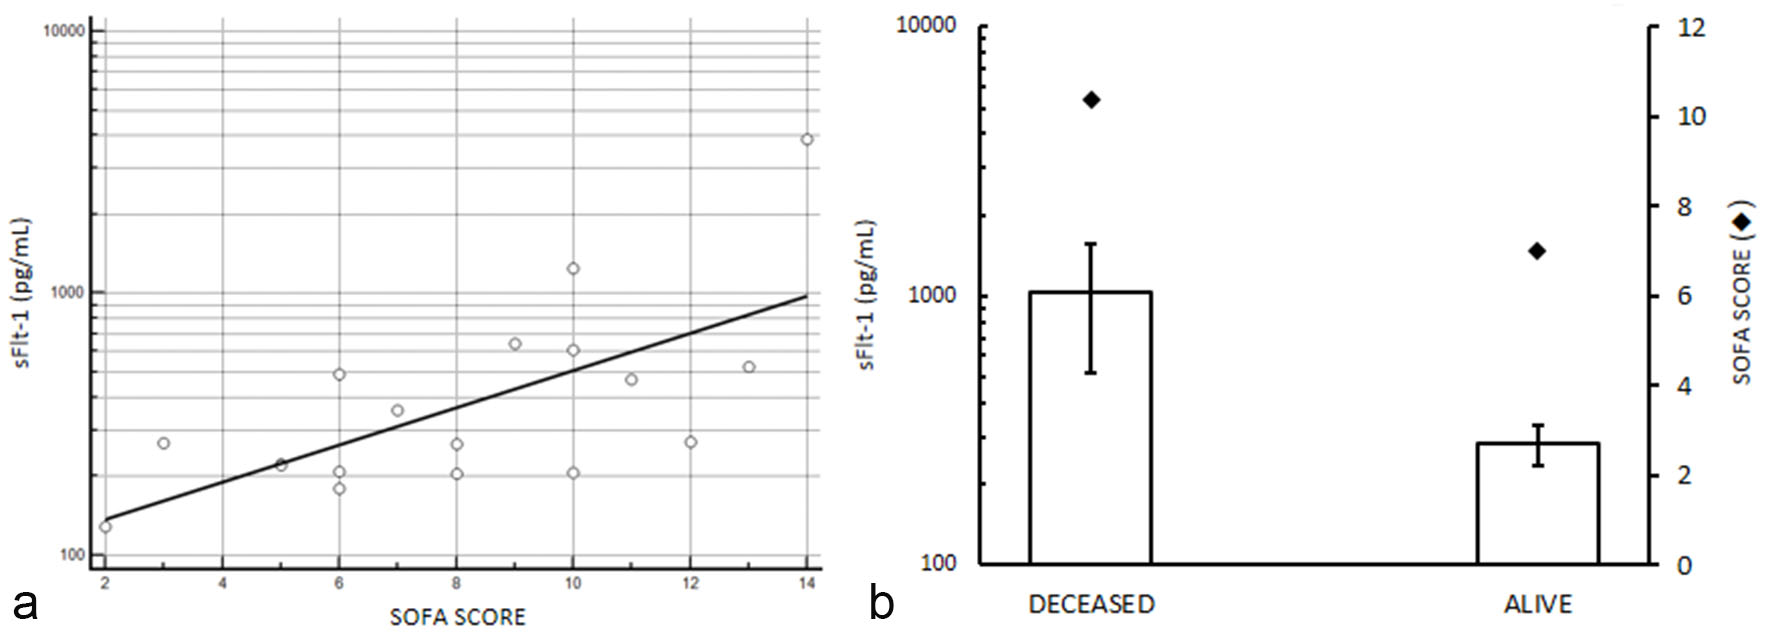
Figure 3.
Figure 3. sFlt-1 and sequential organ failure assessment in selected septic patients with serum levels of sFlt-1 higher than 190 pg/mL (see text for details). (a) sFlt-1 and SOFA score correlation, P < 0.0001 by Chi-squared test for trend. (b) serum levels of sFlt-1 mean values in patients deceased after sepsis and in alive individuals; SOFA score mean values are reported in the second axis. Higher serum levels of sFlt-1 and SOFA score are observed in deceased patients compared to survived (P < 0.05 by Chi-squared test). sFlt-1 values are showed in semilogarithmic plot.
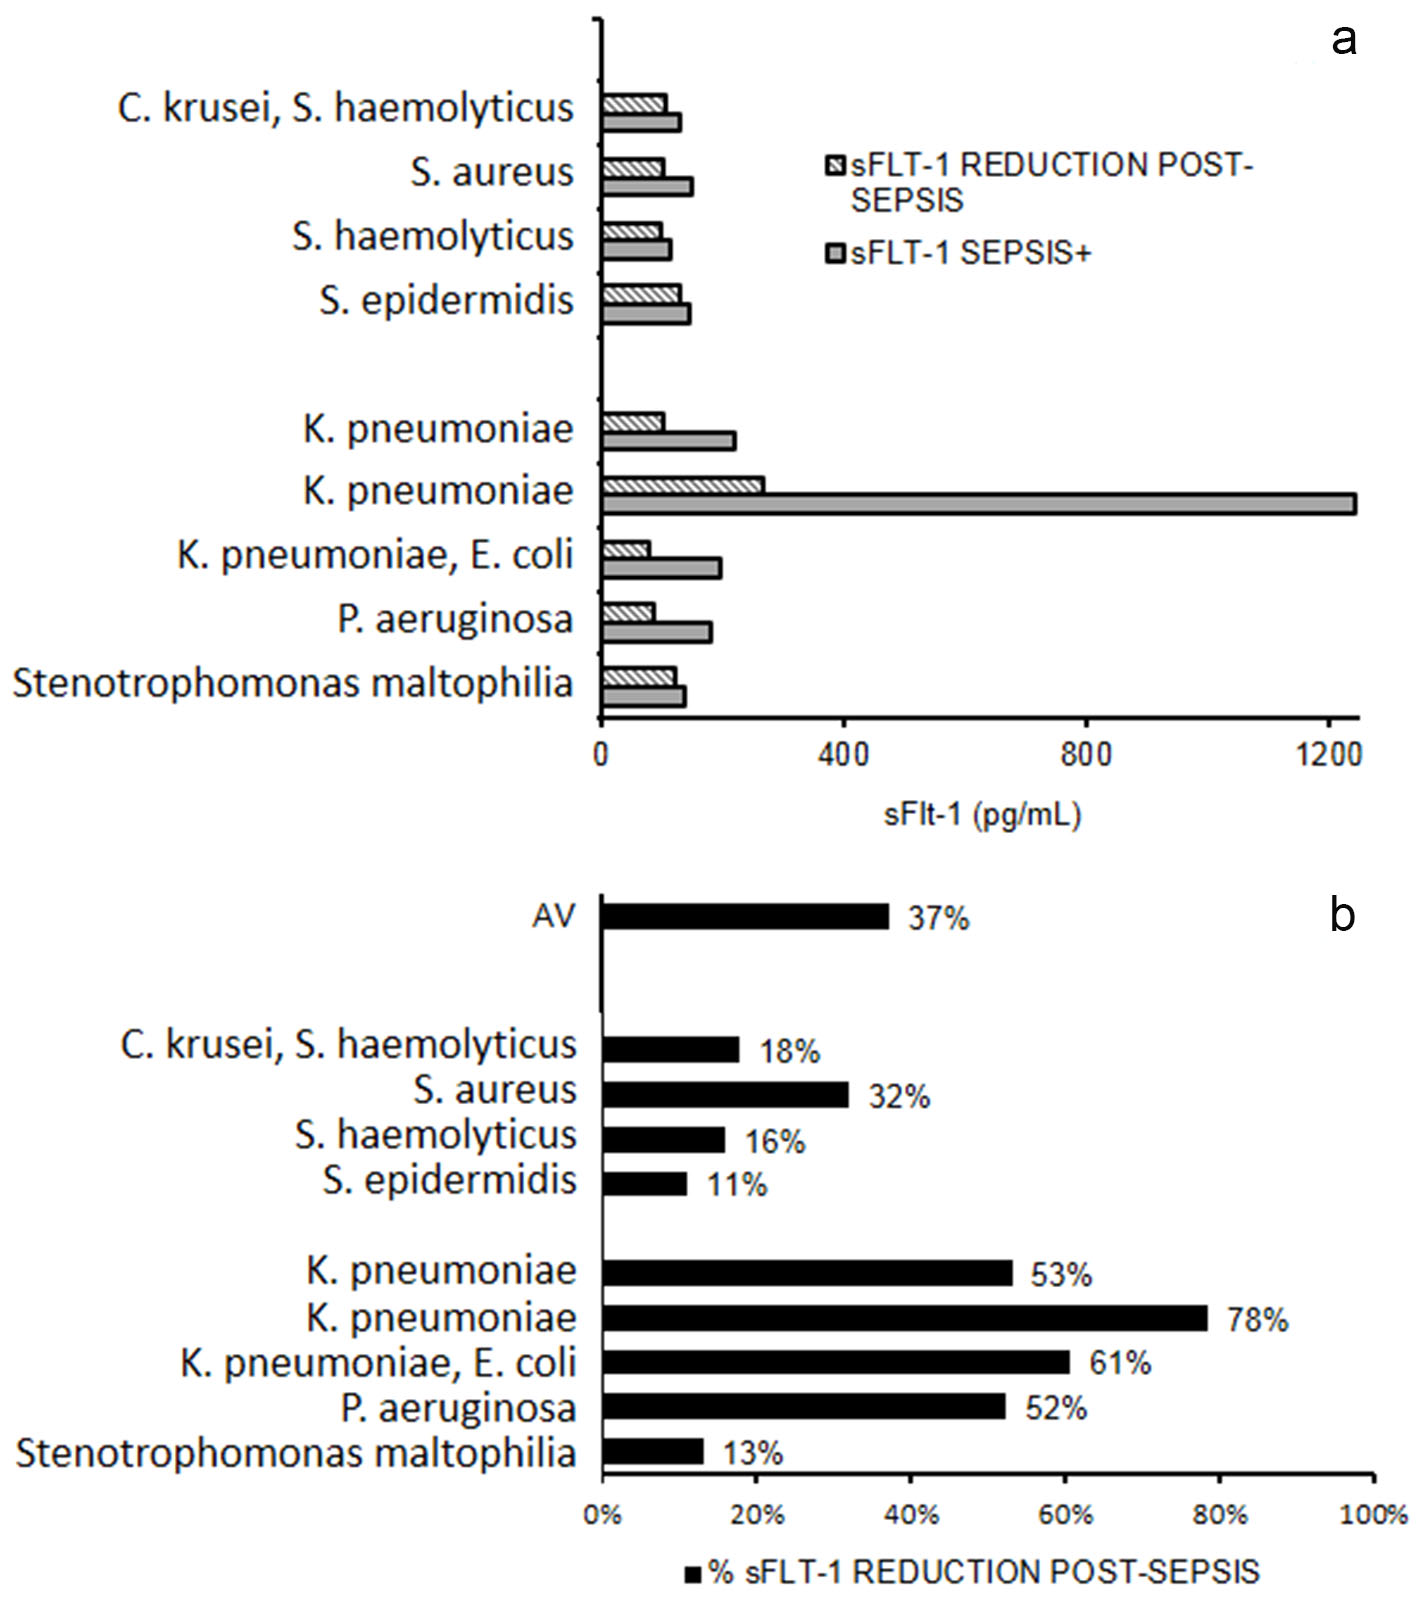
Figure 4.
Figure 4. sFlt-1 after sepsis resolution. (a) Serum levels of sFlt-1 measured in nine patients during and after sepsis. (b) Percentage reduction of sFlt-1 after sepsis. AV: mean percentage reduction.

Tables

Table 1. Patients Population and Percentages of Microganisms Identified in Blood Cultures
 
Healthy controlsNo-sepsis controlsSepsisNew bornsSurgeryPost-sepsis recovery
N18667713149
Age range (years)24 - 656 - 8820 - 960 - 28 days6 - 8933 - 89
Gram-pos.--27%--40%
Gram-neg.--68%--50%
Candida--8%--10%


Table 2. sFlt-1 Serum Levels Observed in the Analyzed Groups of Patients and Statistical Summary of Results
 
Healthy controlsNo-sepsis controlsSepsisNew bornsSurgery
SEM: standard error of the mean; CI: confidence interval.
N1866771314
sFlt-1, mean (pg/mL)78.9133.4277.7592.1233.2
SEM2.512.352.4233.162.3
95% CI (mean)73.707 - 84.106108.933 - 157.932173.425 - 382.03084.136 - 1,100.06698.558 - 367.811
sFlt-1, median (pg/mL)78.2103.0165.5204.6123.3
95% CI (median)73.773 - 86.35394.988 - 119.330148.328 - 191.607164.783 - 653.92793.468 - 387.771
5 - 95 percentiles58.088 - 95.32874.194 - 359.02085.572 - 794.290122.295 - 2,836.32579.710 - 790.900