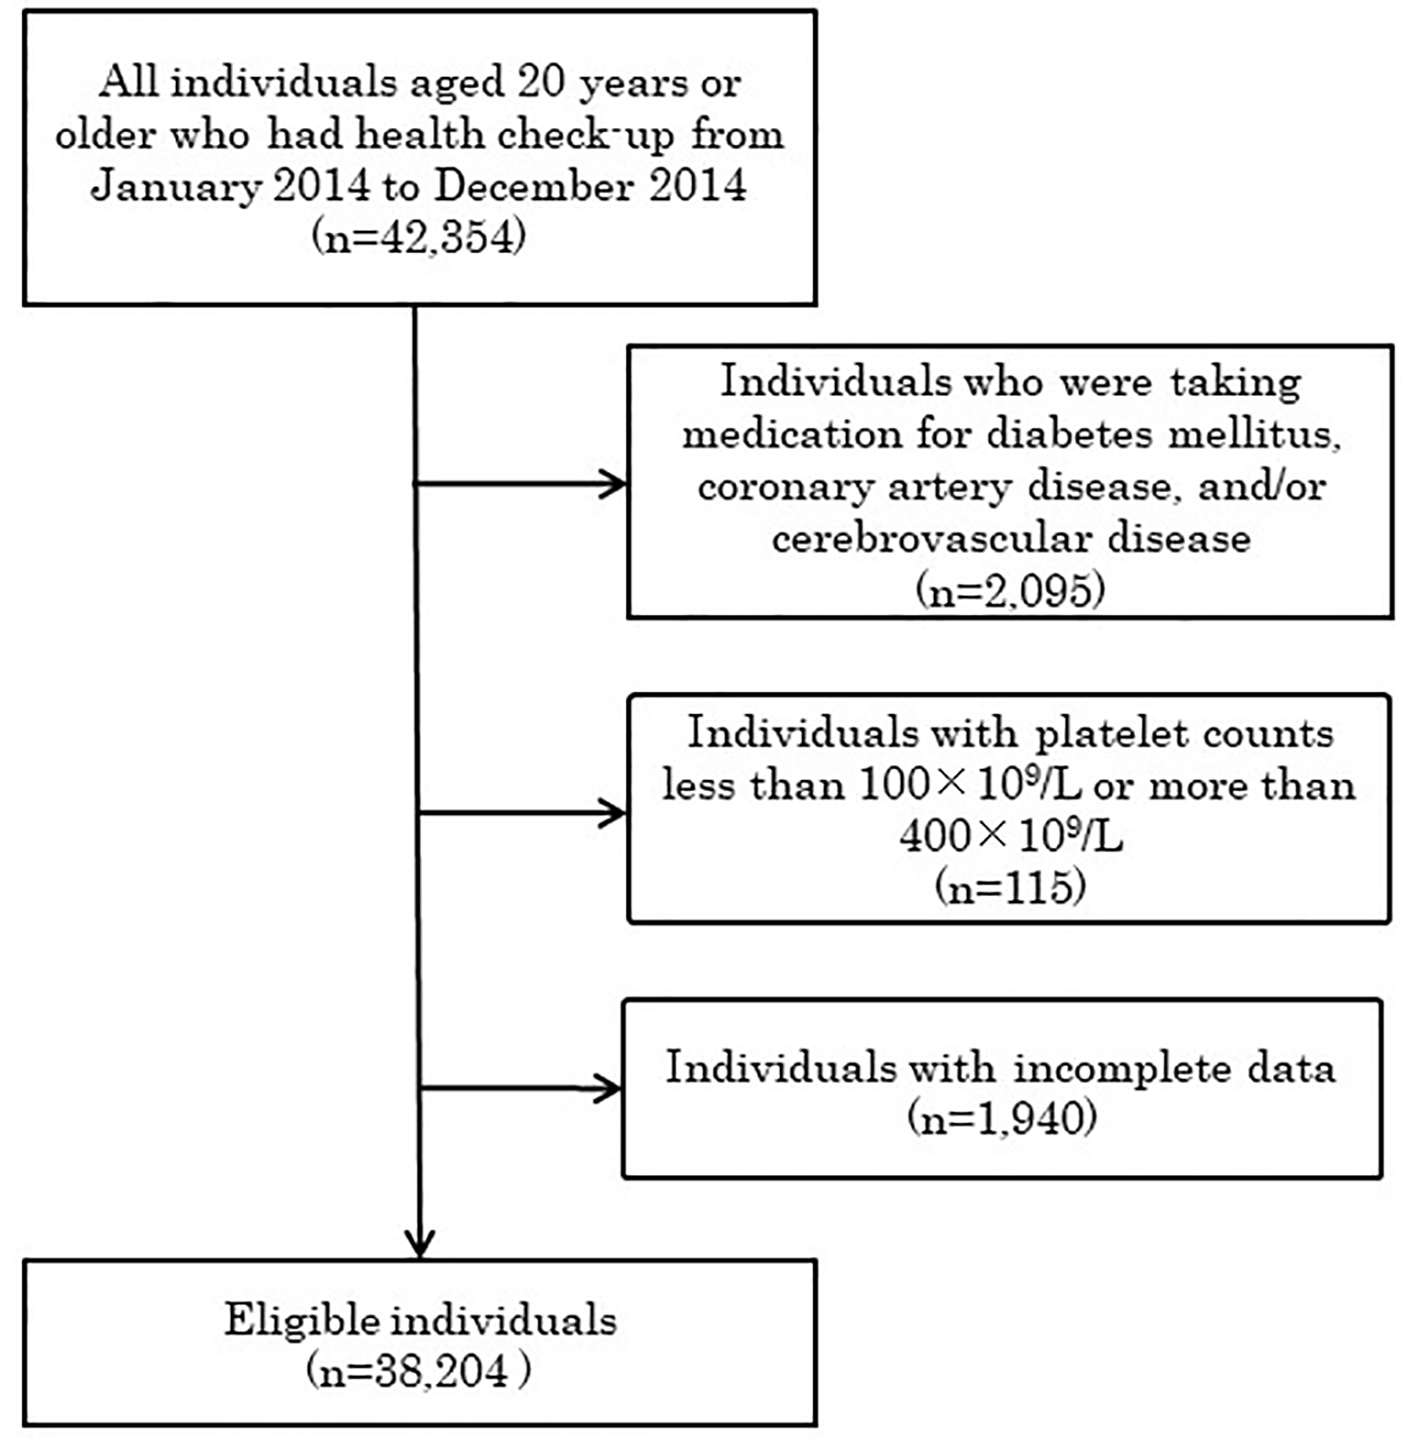
Figure 1. Study flow diagram.
| Journal of Clinical Medicine Research, ISSN 1918-3003 print, 1918-3011 online, Open Access |
| Article copyright, the authors; Journal compilation copyright, J Clin Med Res and Elmer Press Inc |
| Journal website http://www.jocmr.org |
Original Article
Volume 10, Number 4, April 2018, pages 345-350
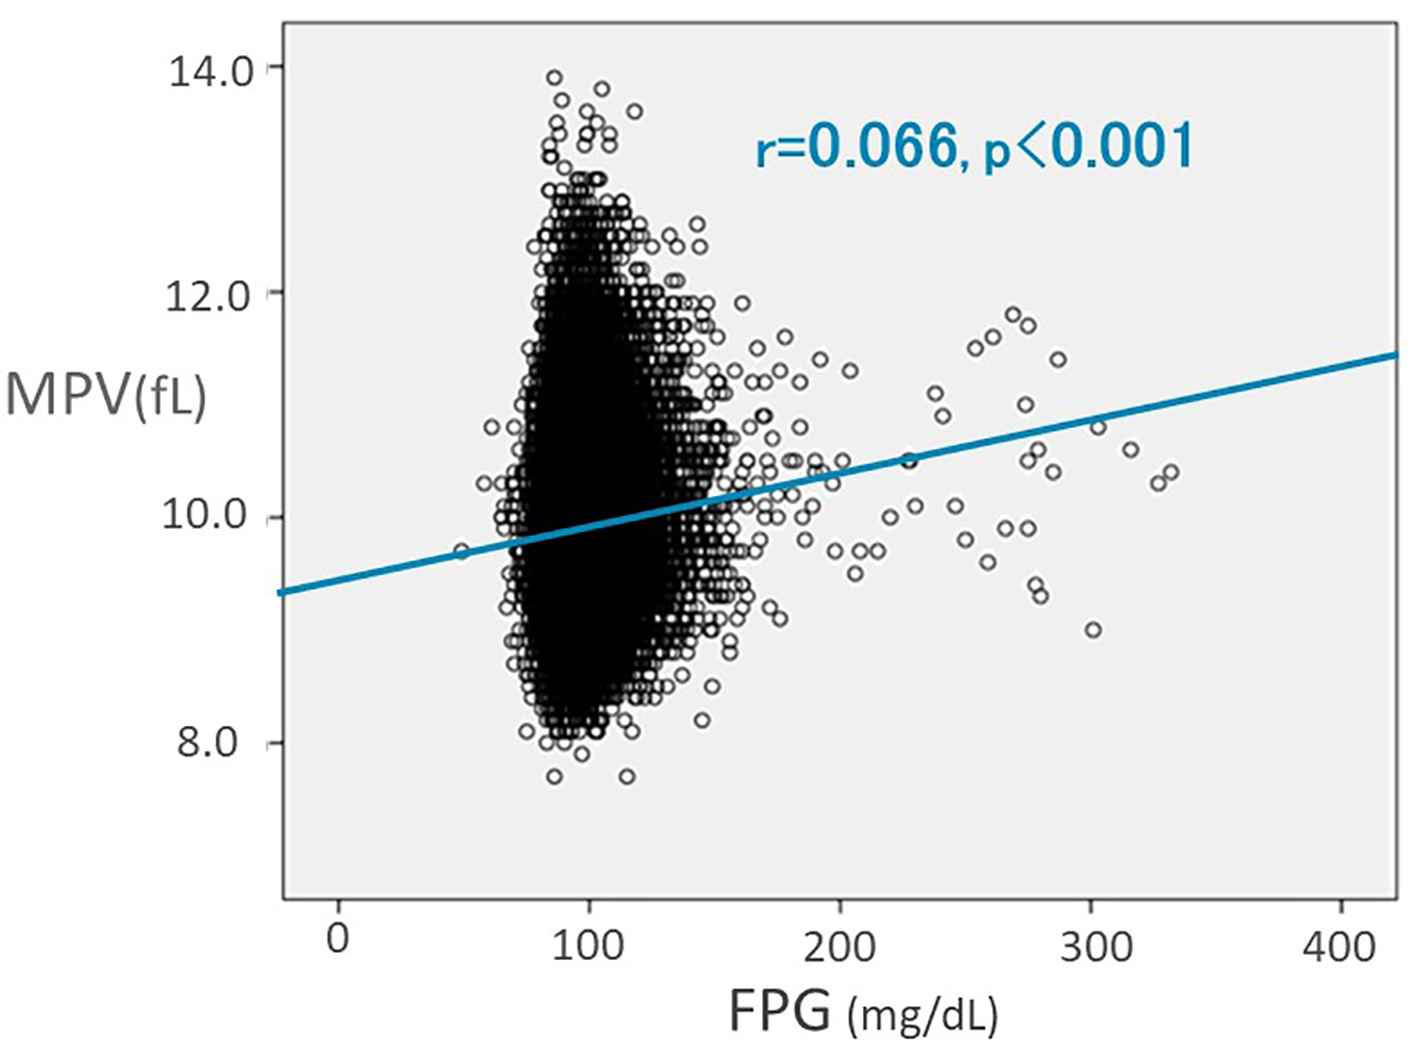
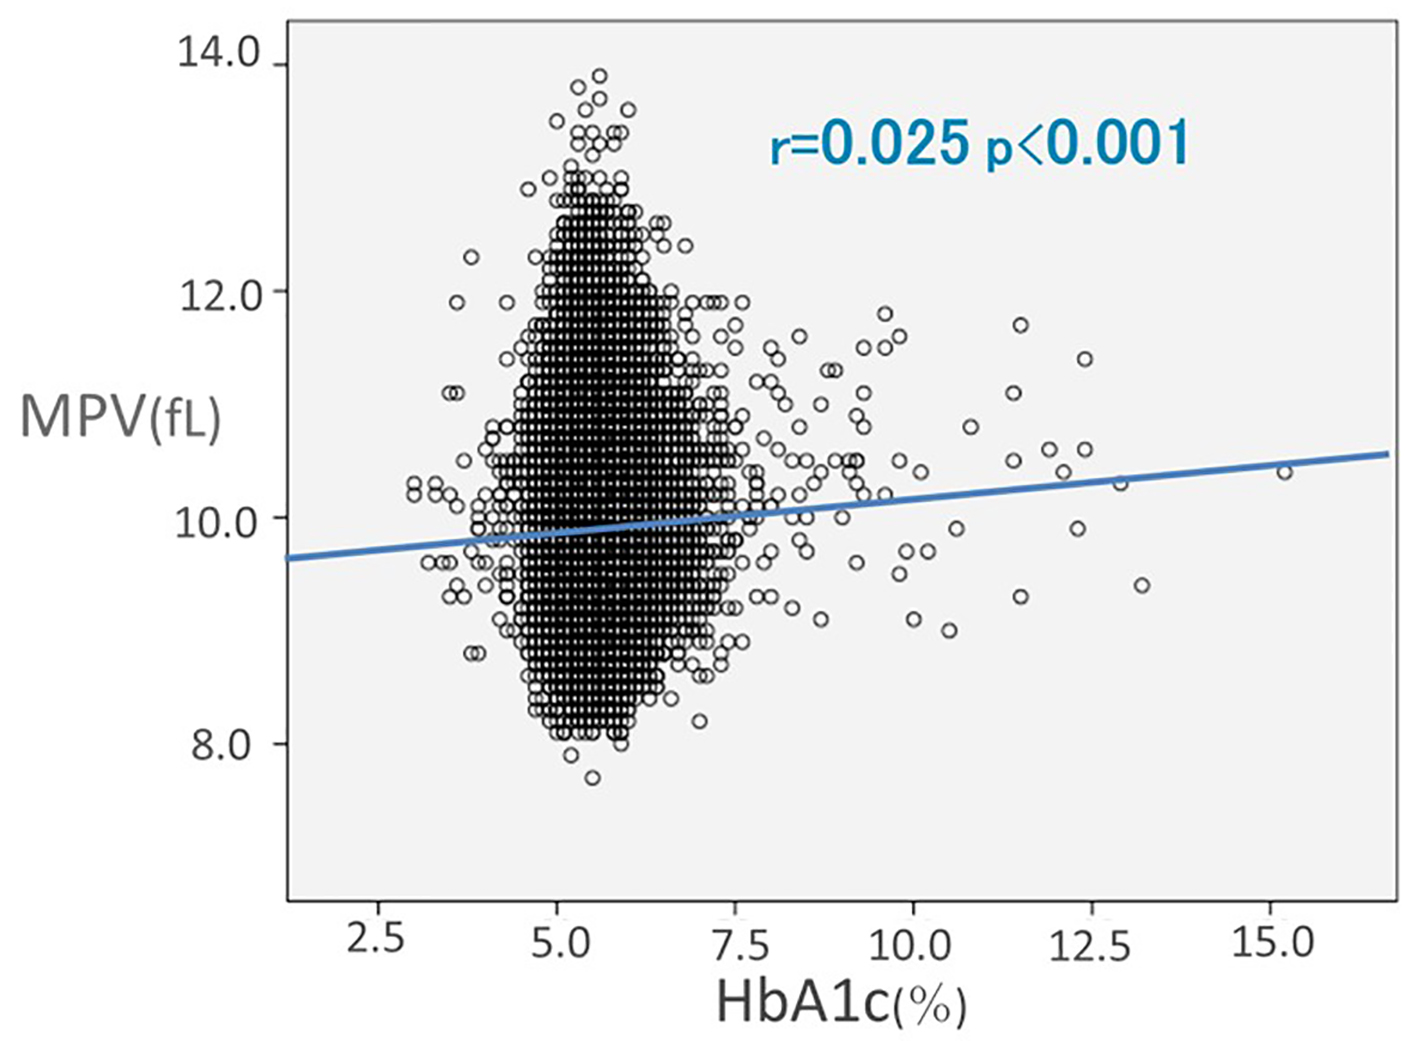
The Relationship Between Mean Platelet Volume and Fasting Plasma Glucose and HbA1c Levels in a Large Cohort of Unselected Health Check-Up Participants
Figures
Tables
| Characteristics | |
|---|---|
| FPG: fasting plasma glucose; MPV: mean platelet volume. | |
| Age, mean (SD), years | 52.3 (12.1) |
| Male, n (%) | 17,622 (46.1) |
| FPG, mean (SD), mg/dL | 98.9 (11.3) |
| HbA1c, mean (SD), % | 5.5 (0.4) |
| MPV, mean (SD), fL | 9.97 (0.71) |
| Group 1 | Group 2 | Group 3 | Group 4 | P value | |
|---|---|---|---|---|---|
| MPV: mean platelet volume; FPG: fasting plasma glucose. | |||||
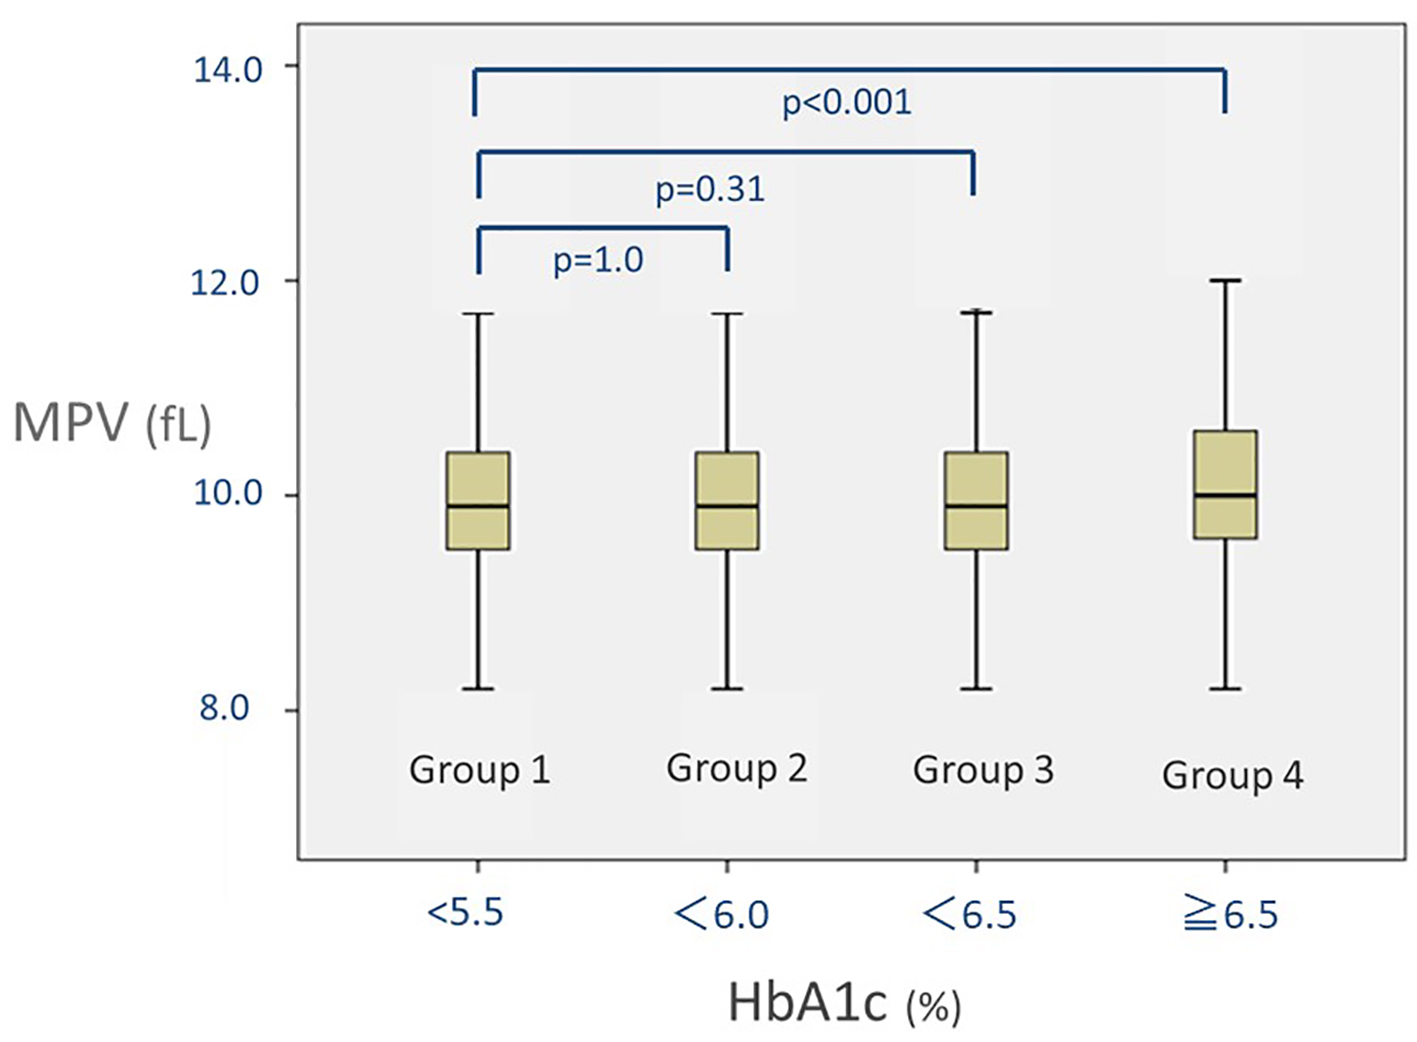
| HbA1c (%) | < 5.5 | 5.5 - 5.9 | 6.0 - 6.4 | ≥ 6.5 | |
| Number of subjects | 15,974 | 18,044 | 3,529 | 657 | |
| Male, number (%) | 6,957 (43.6) | 8,452 (46.8) | 1,760 (49.9) | 453 (68.9) | < 0.001 |
| Age, mean (SD), years | 47 (11) | 54 (12) | 61 (11) | 62 (12) | < 0.001 |
| MPV, mean (SD), fL | 9.96 (0.71) | 9.97 (0.71) | 9.99 (0.70) | 10.09 (0.72) | < 0.001 |
| Platelets, mean (SD), 109/L | 216 (43.5) | 217 (45.1) | 218 (47.8) | 214 (46.4) | 0.007 |
| FPG, mean (SD), mg/dL | 95.0 (7.5) | 99.2 (8.4) | 108.3 (11.4) | 136.2 (33.4) | < 0.001 |