Journal of Clinical Medicine Research, ISSN 1918-3003 print, 1918-3011 online, Open Access
Article copyright, the authors; Journal compilation copyright, J Clin Med Res and Elmer Press Inc
Journal website http://www.jocmr.org

Original Article

Volume 10, Number 2, February 2018, pages 146-153


Different Effects of Oral Contraceptive and Dydrogesterone Treatment on Oxidative Stress Levels in Premenopausal Women

Figures

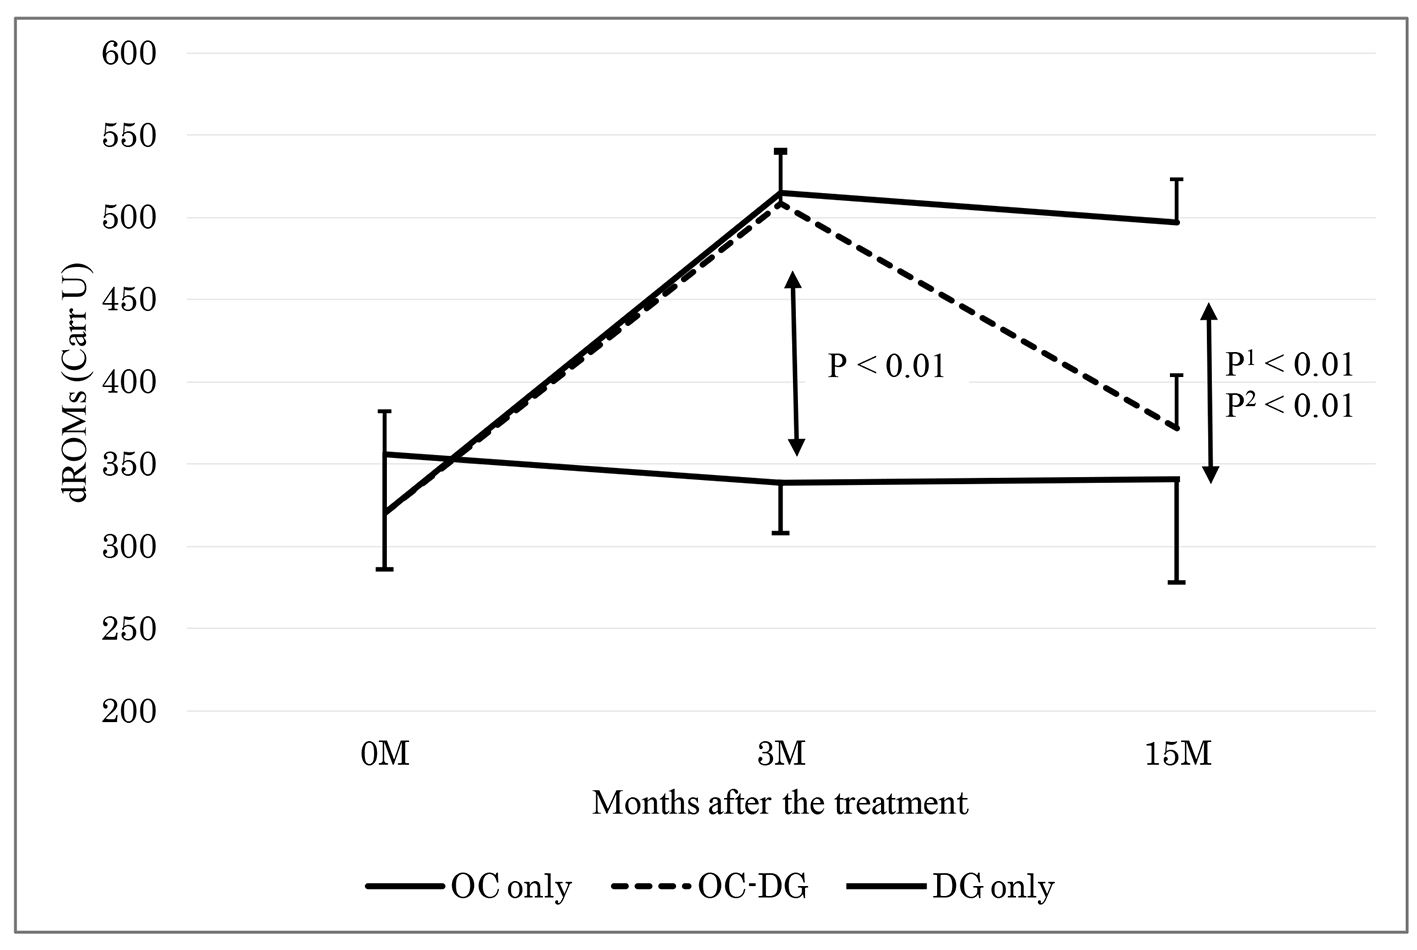
Figure 1.
Figure 1. Changes of d-ROMs 3 and 15 months after the treatment. OC: oral contraceptive; DG: dydrogesterone; OC-DG: initial OC treatment was switched to DG treatment. Data are presented as means ± standard deviations. P: OC (3 M) versus DG only groups 0 and 3 months after the treatment; P1: OC versus DG; P2: OC-DG versus DG only groups 3 and 15 months after the treatment by two-way repeated measure ANOVA.
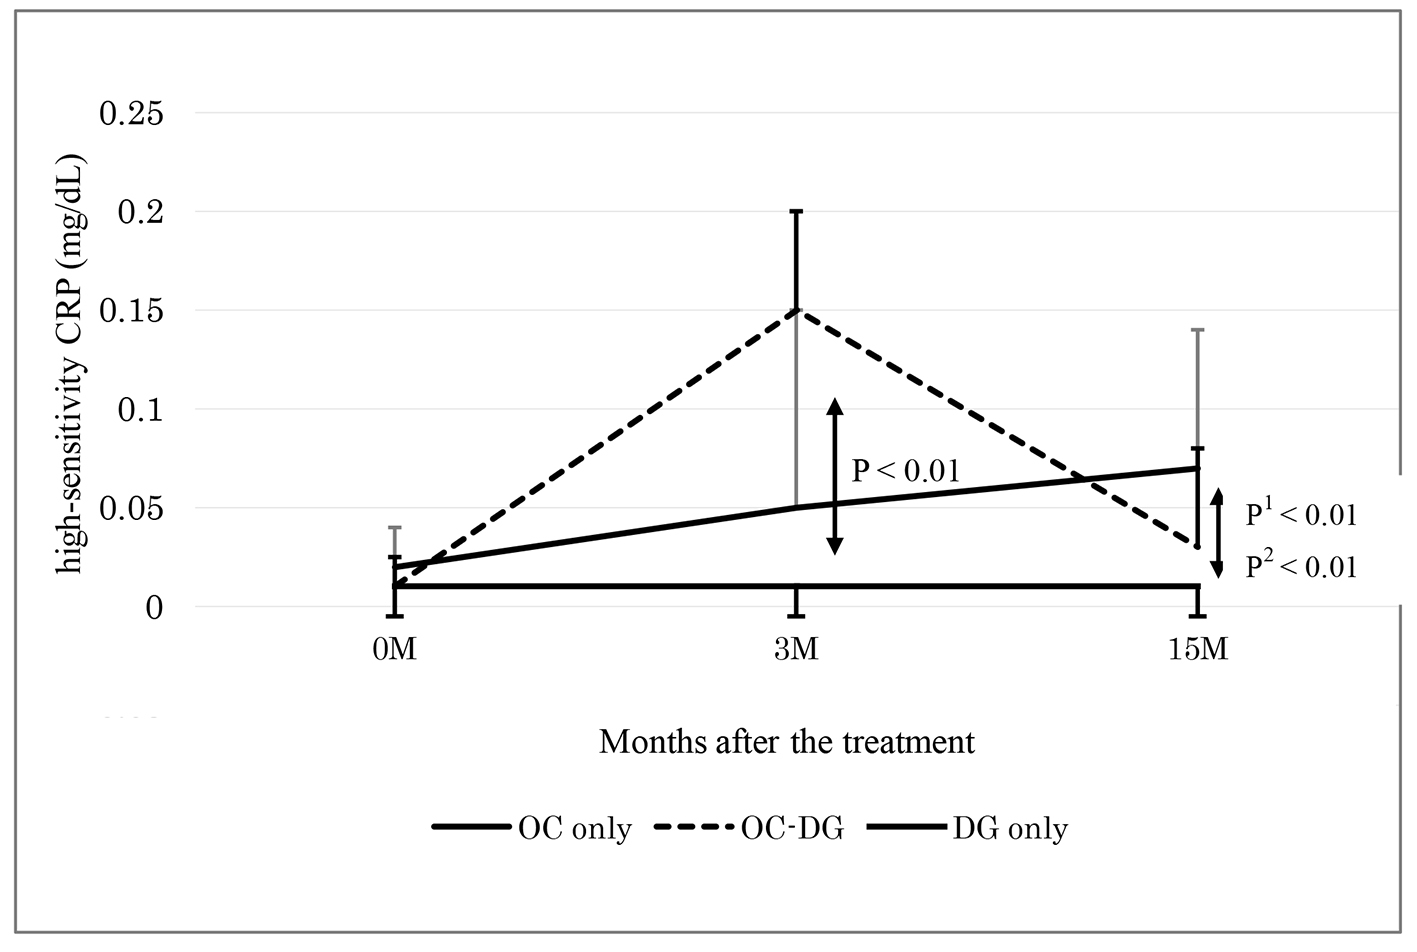
Figure 2.
Figure 2. Changes of high-sensitivity CRP 3 and 15 months after the treatment. OC: oral contraceptive, DG: dydrogesterone, OC-DG: initial OC treatment was switched to DG treatment. Data are presented as medians (interquartile ranges). P: OC (3 M) versus DG groups 0 and 3 months after the treatment; P1: OC versus DG; P2: OC-DG versus DG only groups 3 and 15 months after the treatment by two-way repeated measure ANOVA.

Tables

Table 1. Clinical Background of Study Subjects
 
ParameterOC group (N = 17)DG group (N = 10)P
OC: oral contraceptive; DG: dydrogesterone; WBC: white blood count; LDL: low-density lipoprotein; HDL: high-density lipoprotein; ROMs: reactive oxygen metabolites; BAP: biological antioxidant potential. Data are presented as means ± standard deviations, medians (interquartile ranges) or subject numbers (%). P < 0.05 (significance level): comparison between the OC and DG groups by an unpaired t-test or Fisher’s exact test.
Age, years37.5 ± 9.841.4 ± 6.10.27
Current smokers, n (%)2 (12%)1 (10%)0.99
Body mass index, kg/m220.7 ± 2.520.4 ± 2.20.73
Systolic blood pressure, mm Hg115 ± 18109 ± 100.31
Diastolic blood pressure, mm Hg73 ± 1370 ± 90.55
Hemoglobin, g/dL12.9 ± 1.011.7 ± 1.80.05
WBC, /µL5,688 ± 1,3195,140 ± 1,0880.28
Platelet, × 104/µL26.1 ± 5.029.0 ± 6.60.20
Hemoglobin A1c, %4.8 ± 0.24.9 ± 0.30.31
LDL-cholesterol, mg/dL100 ± 3198 ± 260.87
HDL-cholesterol, mg/dL75 ± 2073 ± 100.75
Triglyceride, mg/dL98 (46 - 159)77 (55 - 102)0.57
Fibrinogen, mg/dL275 ± 78237 ± 270.15
High-sensitivity CRP, mg/dL0.02 (0.01 - 0.05)0.01 (0.01 - 0.02)0.19
d-ROMs, Carr U321 ± 61356 ± 700.19
BAP, µM2,033 ± 1791,953 ± 1910.28


Table 2. Changes in Data From Baseline to 3 Months After Initial Treatment
 
ParameterBaseline3 monthsP
OC: oral contraceptive; DG: dydrogesterone; WBC: white blood coun; LDL: low-density lipoprotein; HDL: high-density lipoprotein; ROMs: reactive oxygen metabolites; BAP: biological antioxidant potential. Data are presented as means ± standard deviations or medians (interquartile ranges). *P < 0.05, **P < 0.01: comparison between the OC and DG groups by two-way repeated measure ANOVA.
d-ROMs, Carr U< 0.01**
  OC group (N = 17)321 ± 61512 ± 79
  DG group (N = 10)356 ± 70339 ± 31
BAP, µM0.21
  OC group (N = 17)2,033 ± 1792,029 ± 161
  DG group (N = 10)1,953 ± 1911,970 ± 117
High-sensitivity CRP, mg/dL0.01*
  OC group (N = 17)0.02 (0.01 - 0.05)0.10 (0.03 - 0.22)
  DG group (N = 10)0.01 (0.01 - 0.02)0.01 (0.01 - 0.02)
WBC, /µL0.28
  OC group (N = 17)5,688 ± 1,3195,994 ± 1,134
  DG group (N = 10)5,140 ± 1,0885,550 ± 1,527
Platelet, × 104/µL0.40
  OC group (N = 17)26.1 ± 5.028.4 ± 7.1
  DG group (N = 10)29.0 ± 6.629.4 ± 5.5
Fibrinogen, mg/dL0.06
  OC group (N = 17)275 ± 78278 ± 68
  DG group (N = 10)237 ± 27234 ± 28
LDL-cholesterol, mg/dL0.75
  OC group (N = 17)100 ± 31108 ± 31
  DG group (N = 10)98 ± 26103 ± 24


Table 3. Changes of Data From 3 to 15 Months After Initial Treatment
 
Parameter3 months15 monthsP1P2P3
OC: oral contraceptive; DG: dydrogesterone; WBC: white blood count; LDL: low-density lipoprotein; HDL: high-density lipoprotein; ROMs: reactive oxygen metabolites; BAP: biological antioxidant potential. Data are presented as means ± standard deviations or medians (interquartile ranges). *P < 0.05, **P < 0.01: comparison by two-way repeated measure ANOVA. P1: between the continuous and discontinuous OC groups; P2: between the continuous OC and DG groups; P3: between the discontinuous OC and DG groups.
d-ROMs, Carr U0.04*< 0.01**< 0.01**
  Continuous OC group (N = 10)515 ± 26497 ± 26
  Discontinuous OC group (N = 7)508 ± 31372 ± 32
  DG group (N = 10)339 ± 31341 ± 63
BAP, µM0.630.200.06
  Continuous OC group (N = 10)2,026 ± 531,964 ± 63
  Discontinuous OC group (N = 7)2,034 ± 632,035 ± 75
  DG group (N = 10)1,970 ± 1171,865 ± 104
High-sensitivity CRP, mg/dL0.580.01*< 0.01**
  Continuous OC group (N = 10)0.05 (0.02 - 0.20)0.07 (0.03 - 0.11)
  Discontinuous OC group (N = 7)0.15 (0.07 - 0.27)0.03 (0.02 - 0.08)
  DG group (N = 10)0.01 (0.01 - 0.02)0.01 (0.01 - 0.02)
WBC, /µL0.810.330.50
  Continuous OC group (N = 10)6,010 ± 3705,970 ± 383
  Discontinuous OC group (N = 7)5,971 ± 4435,771 ± 457
  DG group (N = 10)5,550 ± 1,5275,330 ± 1,667
Platelet, × 104/µL0.470.970.44
  Continuous OC group (N = 10)29.4 ± 2.327.8 ± 1.3
  Discontinuous OC group (N = 7)27.0 ± 2.726.3 ± 1.6
  DG group (N = 10)29.4 ± 5.527.6 ± 4.8
Fibrinogen, mg/dL0.530.340.09
  Continuous OC group (N = 10)256 ± 22250 ± 20
  Discontinuous OC group (N = 7)312 ± 31238 ± 28
  DG group (N = 10)234 ± 28232 ± 32
LDL-cholesterol, mg/dL0.950.660.67
  Continuous OC group (N = 10)107 ± 10104 ± 9
  Discontinuous OC group (N = 7)110 ± 12103 ± 11
  DG group (N = 10)103 ± 2499 ± 17