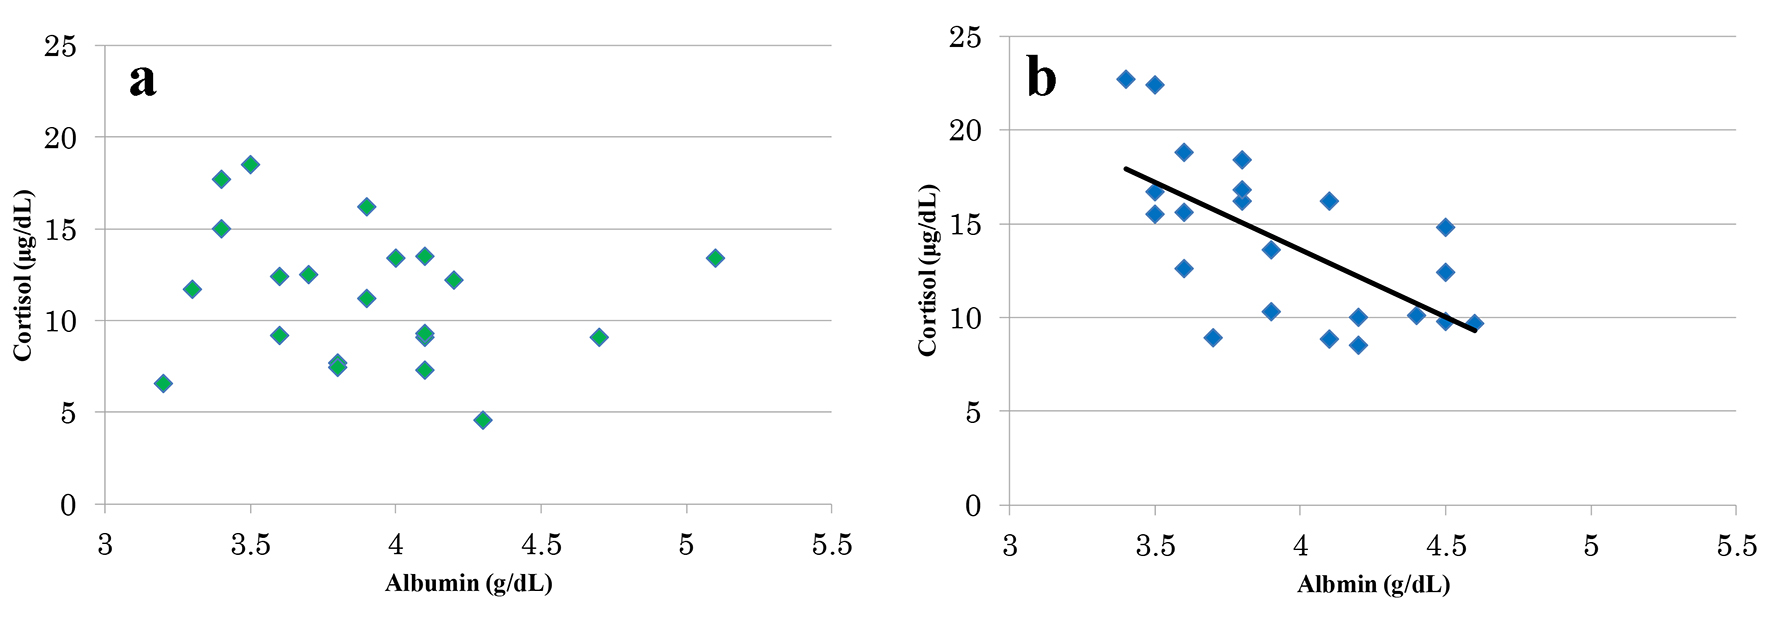
| Journal of Clinical Medicine Research, ISSN 1918-3003 print, 1918-3011 online, Open Access |
| Article copyright, the authors; Journal compilation copyright, J Clin Med Res and Elmer Press Inc |
| Journal website http://www.jocmr.org |
Original Article
Volume 10, Number 2, February 2018, pages 137-145
Impact of Oxidative Stress and Newer Antiepileptic Drugs on the Albumin and Cortisol Value in Severe Motor and Intellectual Disabilities With Epilepsy
Figures


Tables
| Evaluation | Standard value | Unit |
|---|---|---|
| *1 U.CARR = 0.08 mg/100 mL H2O2. | ||
| d-ROMs test | *U.CARR | |
| Normal range | 250 - 300 | |
| Border range | 301 - 320 | |
| Low-level oxidative stress | 321 - 340 | |
| Intermediate level oxidative stress | 341 - 400 | |
| High-level oxidative stress | 401 - 500 | |
| Very high-level oxidative stress | > 500 | |
| BAP test | µmol/L | |
| Normal range | < 2,200 | |
| Border range | 2,000 - 2,200 | |
| Slight lack state | 1,800 - 1,999 | |
| Lack state | 1,600 - 1,799 | |
| Severe lack state | 1,400 - 1,599 | |
| Very severe lack state | < 1,400 | |
| Newer AED addition group (n = 23) | Old AED alone group (n = 21) | |
|---|---|---|
| *Hypertension, diabetes, hyperlipidemia, kidney disease, infectious disease. †There is overlap in a value. | ||
| Sex | ||
| Male | 16 (69.6%) | 14 (66.7%) |
| Female | 7 (30.4%) | 7 (33.3%) |
| Age (years) | ||
| Average ± standard deviation | 26.5 ± 7.3 | 29.8 ± 8.3 |
| Maximum | 39 | 45 |
| Minimum | 10 | 12 |
| Median | 27.0 | 30.0 |
| Main disease | ||
| Cerebral palsy | 9 (39.1%) | 14 (66.7%) |
| Hypoxia encephalopathic aftereffects | 3 (13.0%) | 2 (9.5%) |
| Epileptic encephalopathy aftereffects | 3 (13.0%) | 0 |
| Cerebral hemorrhage aftereffects | 2 (8.7%) | 0 |
| Lissencephaly | 2 (8.7%) | 0 |
| CFC syndrome | 0 | 2 (9.5%) |
| Meningitis aftereffects | 1 (4.3%) | 0 |
| Dentatorubral-pallidoluysian atrophy (DRPLA) | 1 (4.3%) | 0 |
| Acute encephalopathic aftereffects | 1 (4.3%) | 0 |
| Theophylline encephalopathic aftereffects | 1 (4.3%) | 0 |
| Arthrogryposis | 0 | 1 (4.8%) |
| Schizencephaly | 0 | 1 (4.8%) |
| Psychomotor retardation | 0 | 1 (4.8%) |
| Renal damage | ||
| Available | 0 | 0 |
| None | 23 | 21 |
| Liver damage | ||
| Available | 0 | 0 |
| None | 23 | 21 |
| Comorbidities* | ||
| Available | 0 | 0 |
| None | 23 | 21 |
| Use of AED† | ||
| Valproate sodium (VPA) | 19 (24.1%) | 15 (40.5%) |
| Phenytoin (PHT) | 6 (7.6%) | 6 (16.2%) |
| Phenobarbital (PB) | 6 (7.6%) | 5 (13.5%) |
| Clonazepam (CZP) | 6 (7.6%) | 0 |
| Carbamazepine (CBZ) | 4 (7.7%) | 6 (16.2%) |
| Zonisamide (ZNS) | 4 (5.1%) | 1 (2.7%) |
| Clobazam (CLB) | 3 (3.8%) | 2 (5.4%) |
| Ethosuximide (ESM) | 2 (2.5%) | 1 (2.7%) |
| Others | 3 (3.8%) | 1 (2.7%) |
| Lamotrigine (LTG) | 11 (13.9%) | 0 |
| Levetiracetam (LEV) | 15 (19.0%) | 0 |
| Unit | Measurement point 1 | Measurement point 2 | P value | |
|---|---|---|---|---|
| Measurement point 1: approximately 1 week ago when newer AED was added. Measurement point 2: it is approximately 1 year later from point 1. Wilcoxon signed-rank test was used for statistical analysis. | ||||
| d-ROMs value | U.CARR | 415.7 ± 75.1 | 376.1 ± 92.5 | < 0.05 |
| BAP value | µmol/L | 2,282.1 ± 210.4 | 2,378.7 ± 221. | < 0.05 |
| Albumin (Alb) | g/dL | 3.79 ± 0.38 | 4.05 ± 0.37 | < 0.05 |
| Aspartate aminotransferase (AST) | U/L | 19.3 ± 6.3 | 19.5 ± 6.7 | 0.97 |
| Alanine aminotransferase (ALT) | U/L | 17.3 ± 7.2 | 19.3 ± 14.2 | 0.69 |
| Blood urea nitrogen (BUN) | mg/dL | 9.3 ± 3.9 | 9.9 ± 3.5 | 0.58 |
| Serum creatinine (Scr) | mg/dL | 0.36 ± 0.09 | 0.36 ± 0.10 | 0.49 |
| Sodium ion (Na) | mEq/L | 138.7 ± 4.0 | 138.4 ± 3.0 | 0.49 |
| Chloride ion (Cl) | mEq/L | 99.4 ± 5.2 | 98.6 ± 5.0 | 0.14 |
| Red blood cell (RBC) | 104/µL | 440.9 ± 48.9 | 443.2 ± 39.2 | 0.08 |
| Hemoglobin (Hb) | g/dL | 12.9 ± 1.8 | 13.5 ± 1.1 | 0.06 |
| Hematocrit (Hct) | % | 40.1 ± 4.5 | 40.6 ± 4.6 | 0.21 |
| White blood cell (WBC) | 102/µL | 73.0 ± 18.1 | 75.3 ± 18.0 | 0.49 |
| Platelet (PLT) | 104/µL | 25.7 ± 8.2 | 23.5 ±7.5 | 0.33 |
| Unit | Measurement point 1 | Measurement point 2 | P value | |
|---|---|---|---|---|
| Measurement point 1: point of periodical drawing blood from April 2015 to September. Measurement point 2: it is approximately 1 year later from point 1. Wilcoxon signed-rank test was used for statistical analysis. | ||||
| d-ROMs value | U.CARR | 366.2 ± 86.7 | 385.0 ± 92.5 | < 0.05 |
| BAP value | µmol/L | 2,336.6 ± 221.0 | 2,276.3 ± 165.4 | 0.14 |
| Albumin (Alb) | g/dL | 3.91 ± 0.45 | 3.89 ± 0.44 | 0.52 |
| Aspartate aminotransferase (AST) | U/L | 17.7 ± 8.1 | 20.2 ± 7.8 | 0.06 |
| Alanine aminotransferase (ALT) | U/L | 16.6 ± 11.2 | 16.0 ± 8.2 | 0.54 |
| Blood urea nitrogen (BUN) | mg/dL | 10.5 ± 3.8 | 10.5 ± 3.9 | 0.49 |
| Serum creatinine (Scr) | mg/dL | 0.39 ± 0.15 | 0.39 ± 0.14 | 0.83 |
| Sodium ion (Na) | mEq/L | 137.9 ± 4.2 | 138.2 ± 3.8 | 0.32 |
| Chloride ion (Cl) | mEq/L | 100.1 ± 4.0 | 100.2 ± 4.2 | 0.71 |
| Red blood cell (RBC) | 104/µL | 423.1 ± 44.6 | 423.9 ± 42.6 | 0.60 |
| Hemoglobin (Hb) | g/dL | 12.9 ± 1.4 | 12.1 ± 2.5 | 0.30 |
| Hematocrit (Hct) | % | 39.2 ± 3.7 | 38.7 ± 4.2 | 0.97 |
| White blood cell (WBC) | 102/µL | 67.0 ± 23.8 | 64.6 ±17.5 | 0.62 |
| Platelet (PLT) | 104/µL | 22.9 ± 9.9 | 22.7 ± 7.6 | 0.98 |