Journal of Clinical Medicine Research, ISSN 1918-3003 print, 1918-3011 online, Open Access
Article copyright, the authors; Journal compilation copyright, J Clin Med Res and Elmer Press Inc
Journal website http://www.jocmr.org

Original Article

Volume 10, Number 6, June 2018, pages 486-492


Recurrence Is Associated With Body Mass Index in Patients Undergoing a Single-Level Lumbar Disc Herniation Surgery

Figures

Figure 1.
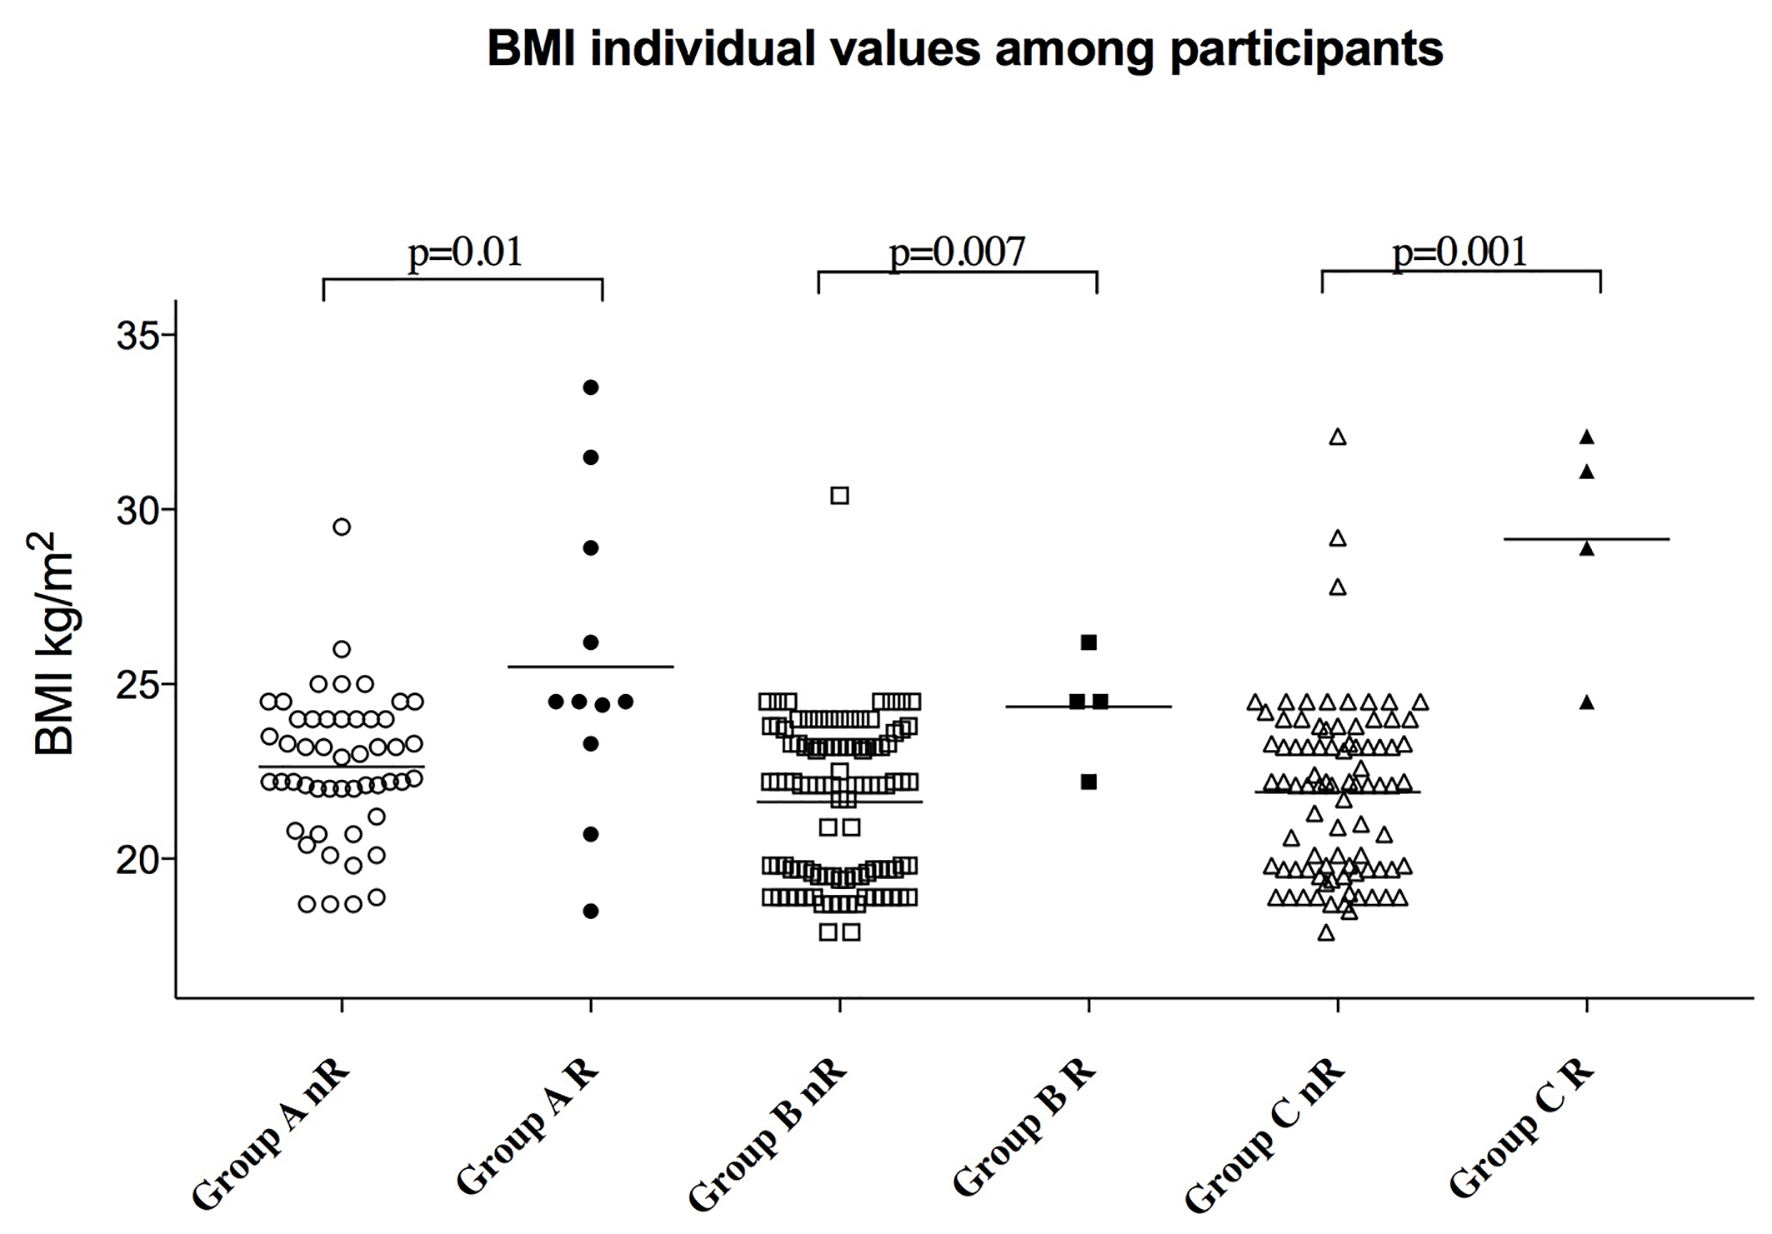
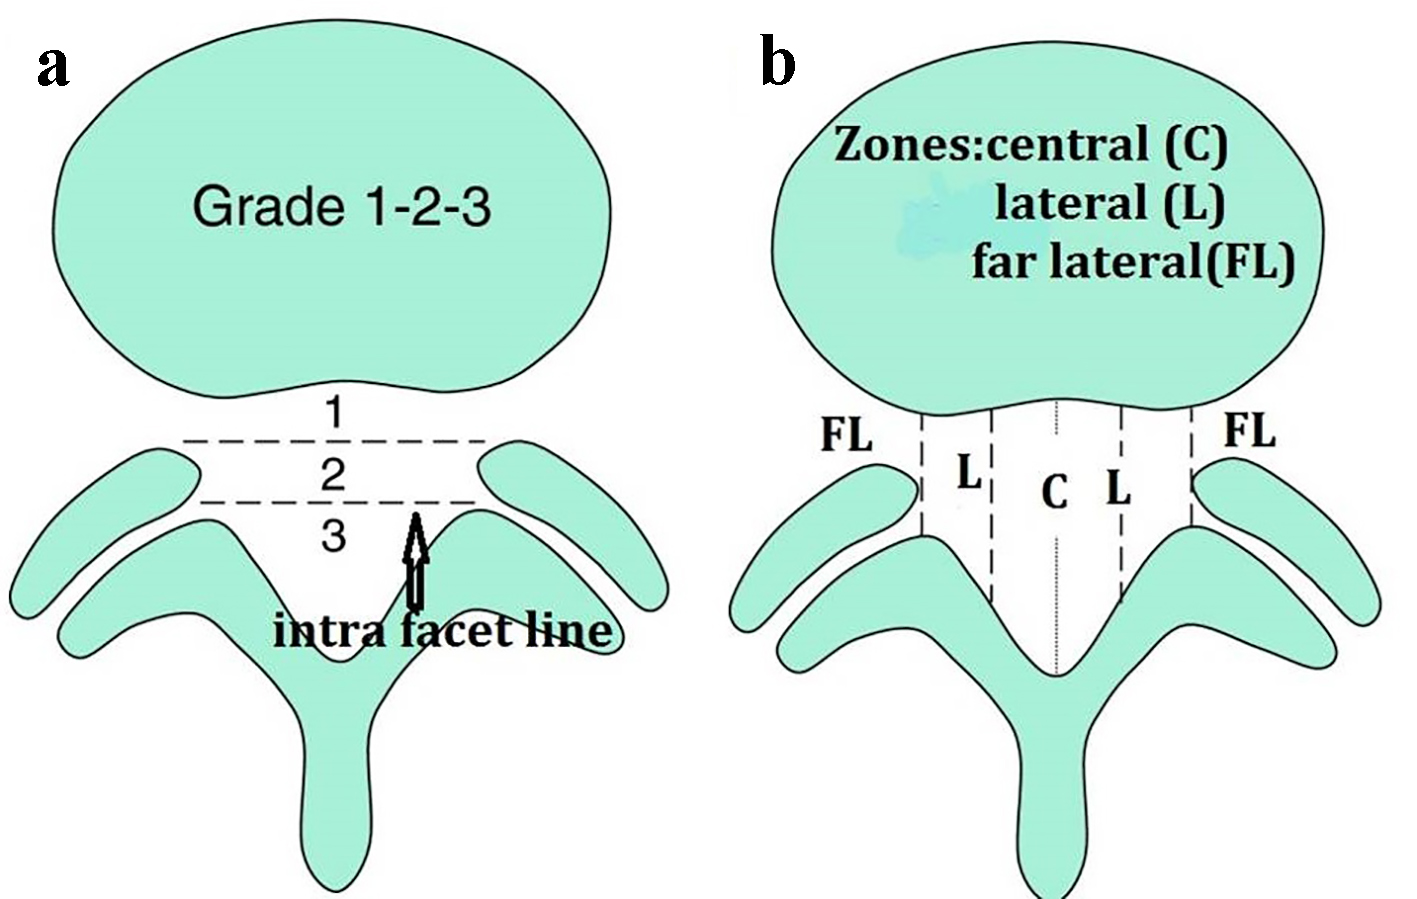
Figure 1. To portray the size of disc herniation, the lesion is described as 1, 2, or 3 (a). In reference to the intra-facet line, a determination is made as to whether the disc herniation extends up to or less than 50% of the distance from the non-herniated posterior aspect of the disc to the intra-facet line (size-1), or more than 50% of that distance (size-2). If the herniation extends altogether beyond the intra-facet line, it is termed a size-3 disc. To further qualify location of the disc herniation, the lesion is described as central, lateral or far lateral (b).
Figure 2.
Figure 2. Body mass index (BMI) individual values among the three groups of participants according to the presence of recurrence or not. Bars represent mean values. Group A: 50 patients with no recurrence and 11 patients with recurrence; group B: 101 patients with no recurrence and four patients with recurrence; group C: 86 patients with no recurrence and four patients with recurrence.
Figure 3.
Figure 3. Receiver operating characteristic (ROC) curve, body mass index (BMI) - recurrence.

Tables

Table 1. Baseline Characteristics of Patients
 
Upper disc levels (group A, n = 61, 23.8%)L4-L5 (group B, n = 105, 41.0%)L5-S1 (group C, n = 90, 35.1%)P value
Data are presented as mean ± SD, otherwise is indicated. BMI: body mass index; L: lumbar; S: sacral; VAS: visual analog scale.
Age, years55.8 ± 12.156.8 ± 12.753.4 ± 13.50.247
Sex (male), n (%)35 (57.3)56 (53.3)47 (52.2)0.814
BMI, kg/m223.1 ± 2.821.7 ± 2.222.1 ± 2.60.006
Surgical technique
  Laminectomy (L), n(%)21(34.4)29 (27.6)32 (35.5)0.446
  Partial laminectomy (PL) n (%),5 (8.1)24 (22.8)10 (11.1)0.016
  Hemi laminectomy (HL) n (%),8 (13.1)13 (12.3)6 (6.6)0.328
  Microdiscectomy (MD) n (%),27 (44.2)39 (37.1)44 (48.8)0.250
Diabetes, n (%)10 (16.3)11 (10.4)8 (8.8)0.338
Disc herniation size
  Grade 1 lesions, n (%)15 (24.5)21 (20)22 (24.4)0.699
  Grade 2 lesions, n (%)24 (39.3)41 (39.0)36 (40)0.991
  Grade 3 lesions, n (%)22 (36.0)43 (40.9)32 (35.5)0.700
VAS preoperative8.0 ± 0.87.9 ± 0.88.0 ± 0.80.513
Length of hospital stay, days4.7 ± 0.84.5 ± 0.74.5 ± 0.80.049
Drop foot on admission, n (%)0 (0)3 (2.8)0 (0)0.113
Smoking, n (%)27 (44.2)33 (31.4)36 (40)0.214
Family history, n (%)44 (72.1)39 (37.1)46 (51.1)0.001
Location (far lateral), n (%)13 (21.3)9 (8.5)4 (4.4)0.003
History of injury to the lumbar spine, n (%)16 (26.2)9 (8.5)9 (10)0.003
Steroid use, n (%)4 (6.5)5 (4.7)6 (6.6)0.823


Table 2. Outcomes of Patients
 
TotalGroup A, n = 61 (23.8%)Group B, n = 105 (41.0%)Group C, n = 90 (35.1%)P value
Data are presented as n (%), otherwise is indicated. L: lumbar; S: sacral.
Recurrence, n (%)19 (7.4)11 (18)4 (3.8)4 (4.4)0.001
Odom scale score
  I229 (89.4)51 (83.6)93 (88.5)85 (94.4)0.097
  II14 (5.4)3 (4.9)7 (6.6)4 (4.4)0.775
  III6 (2.3)2 (3.2)4 (3.8)0 (0)0.185
  IV7 (2.7)5 (8.1)1 (0.9)1 (1.1)0.011


Table 3. Univariate Analysis for Recurrence
 
ParametersRecurrence, n = 19No recurrence, n = 237P value
Data are presented as mean ± SD, otherwise is indicated. BMI: body mass index; L: lumbar; S: sacral; VAS: visual analog scale.
BMI, kg/m226.0 ± 4.021.9 ± 2.30.001
Age, years53.5 ± 13.255.5 ± 12.80.468
VAS preoperative8.0 ± 0.87.9 ± 0.80.784
Length of hospital stay, days4.7 ± 0.94.5 ± 0.70.314
Sex (male), n (%)11 (57.8)127 (53.5)0.813
Surgical technique
  Laminectomy (L), n (%)7 (36.8)75 (31.6)0.619
  Partial laminectomy (PL) n (%),3 (15.7)36 (15.1)1.000
  Hemi laminectomy (HL) n (%),2 (10.5)25 (10.5)1.000
  Microdiscectomy (MD) n (%),7 (36.8)103 (43.4)0.637
Disc herniation size
  Grade 1 lesions, n (%)4 (21.0)54 (22.7)1.000
  Grade 2 lesions, n (%)11 (57.8)90 (37.9)0.094
  Grade 3 lesions, n (%)4 (21.0)93 (39.2)0.114
Diabetes, n (%)2 (10.5)27 (11.3)1.000
Smoking, n (%)0.461
Family history, n (%)10 (5.2)119 (50.2)1.000
Location (far lateral), n (%)4 (21.0)22 (9.2)0.112
History of injury to the lumbar spine, n (%)7 (36.8)27 (11.3)0.006
Steroid use, n (%)1 (5.2)14 (5.9)1.000


Table 4. Multivariable Analysis (OR, 95% CI)
 
NameORCIP
BMI: body mass index; OR: odd ratio; CI: confidence interval; P: value for the difference between groups; pVAS: postoperative visual analog scale; Inj: history of injury to the lumbar spine.
History of injury to the lumbar spine0.3120.092 - 1.0560.061
BMI1.5361.280 - 1.8420.001


Table 5. Statistical Findings for ROC
 
AreaStd errorP value
BMI: body mass index; Rec: recurrence.
BMI-Rec0.8390.0600.001
BMI-Odom I0.5970.0650.099
BMI-Odom III0.5370.1270.759
BMI-Odom IV0.3860.1410.302