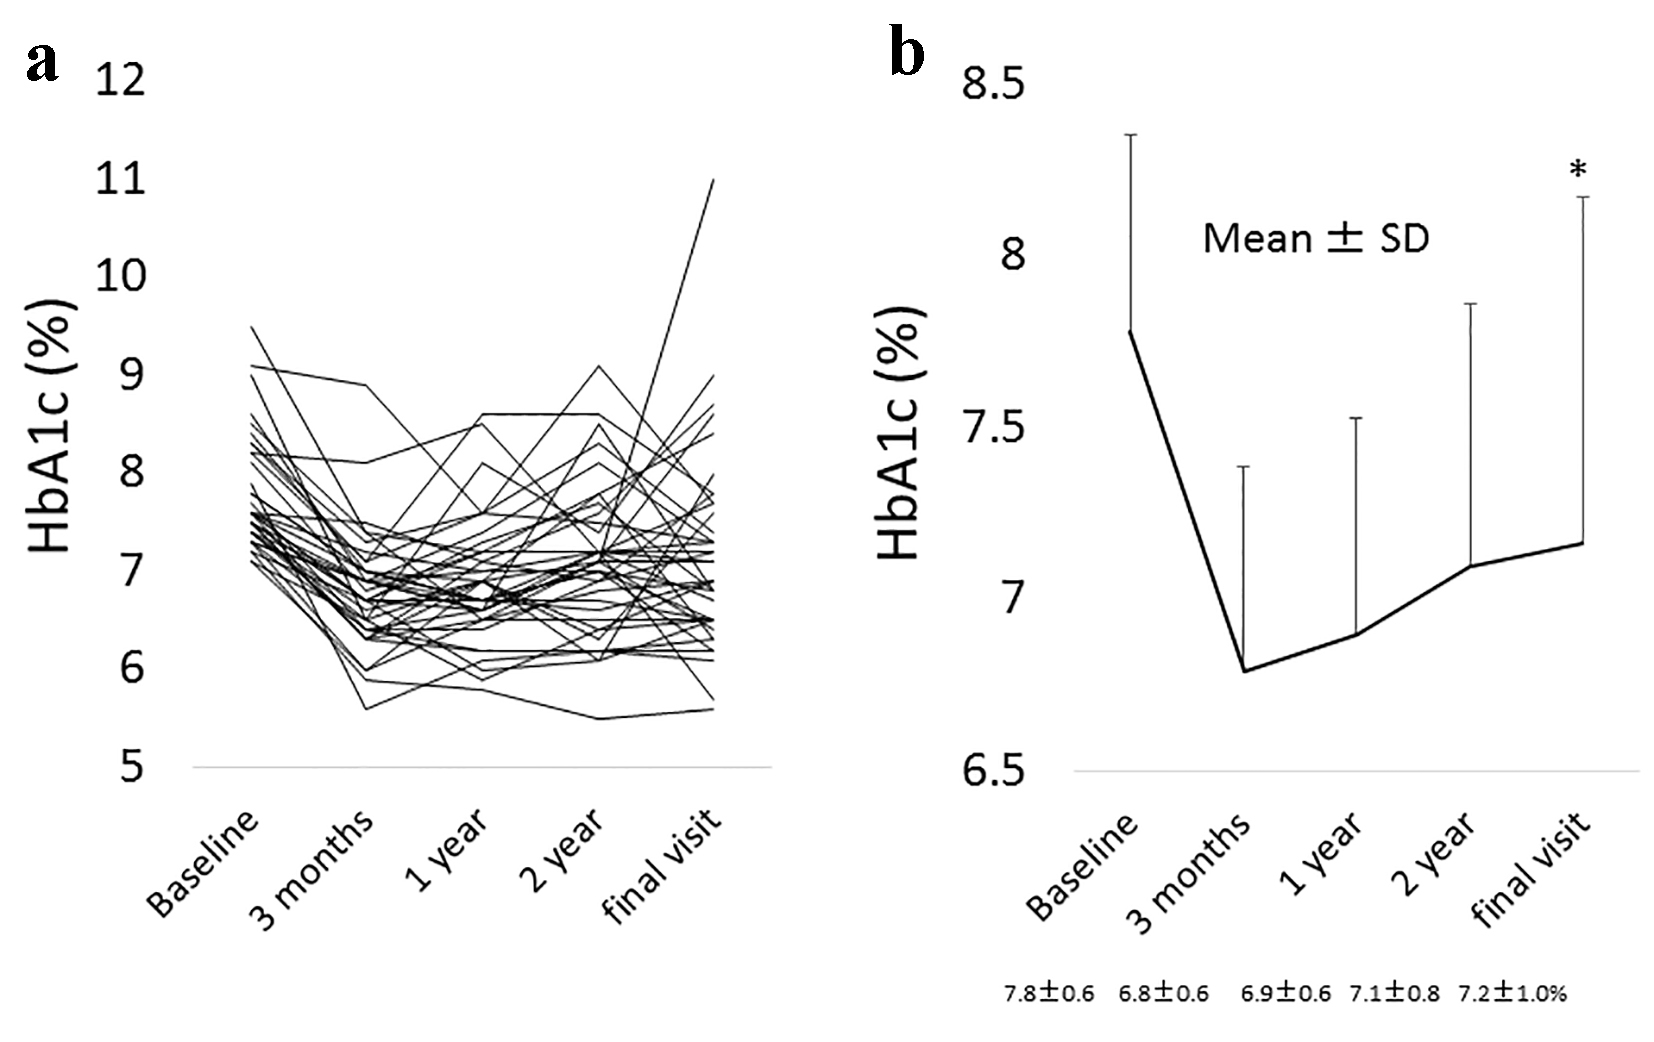
Figure 1. (a) The change in HbA1c levels from the baseline to the final visit with alogliptin therapy in all individuals. (b) The mean change ± standard deviation (SD) in HbA1c levels from the baseline to the final visit with alogliptin therapy. *Statistical significance. Final visit: mean 3.5 years from baseline.
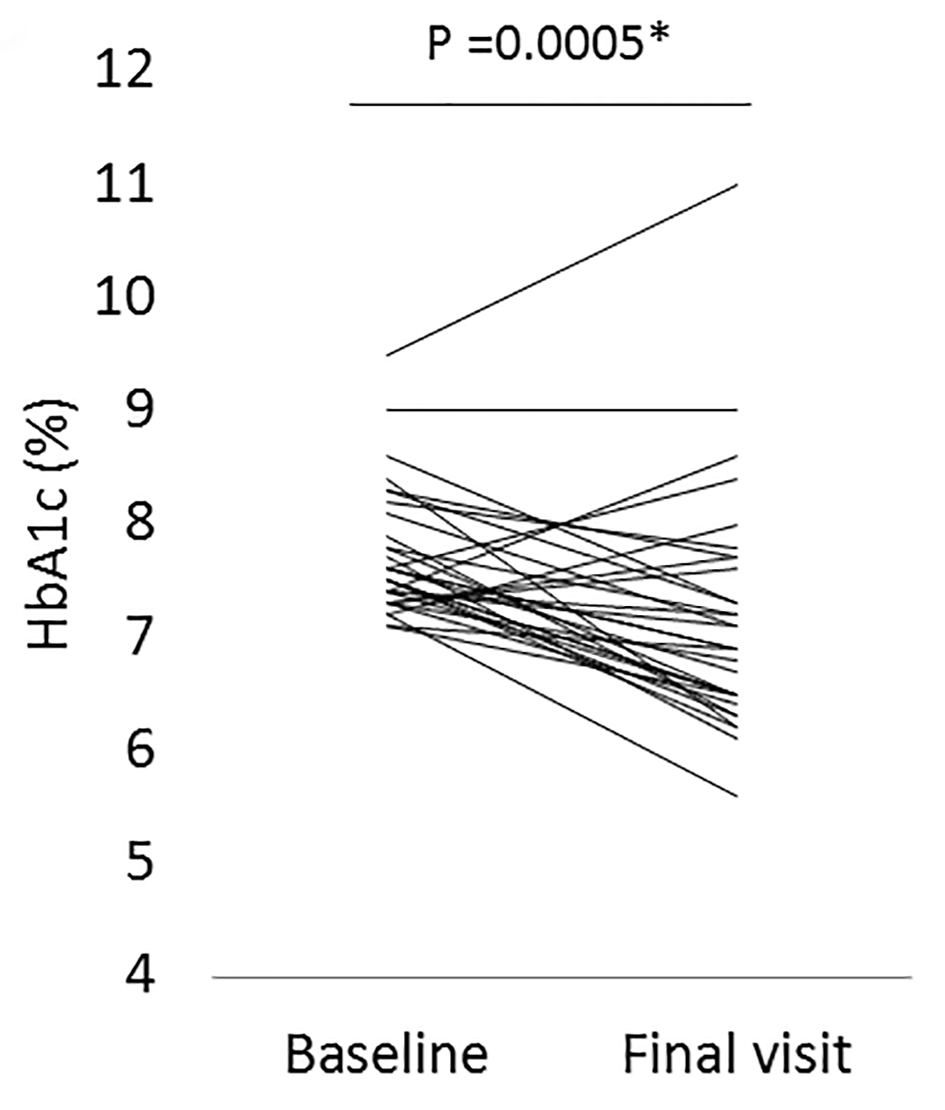
Figure 3. The change in HbA1c levels from the baseline to the final visit with alogliptin therapy in a subgroup patients who either did not change all of their anti-diabetic drugs or the dose of sulfonylureas (SUs) was decreased, or the SUs were changed to a lower strength repaglinide (n = 32). *Statistical significance. Final visit: mean 3.5 years from baseline.
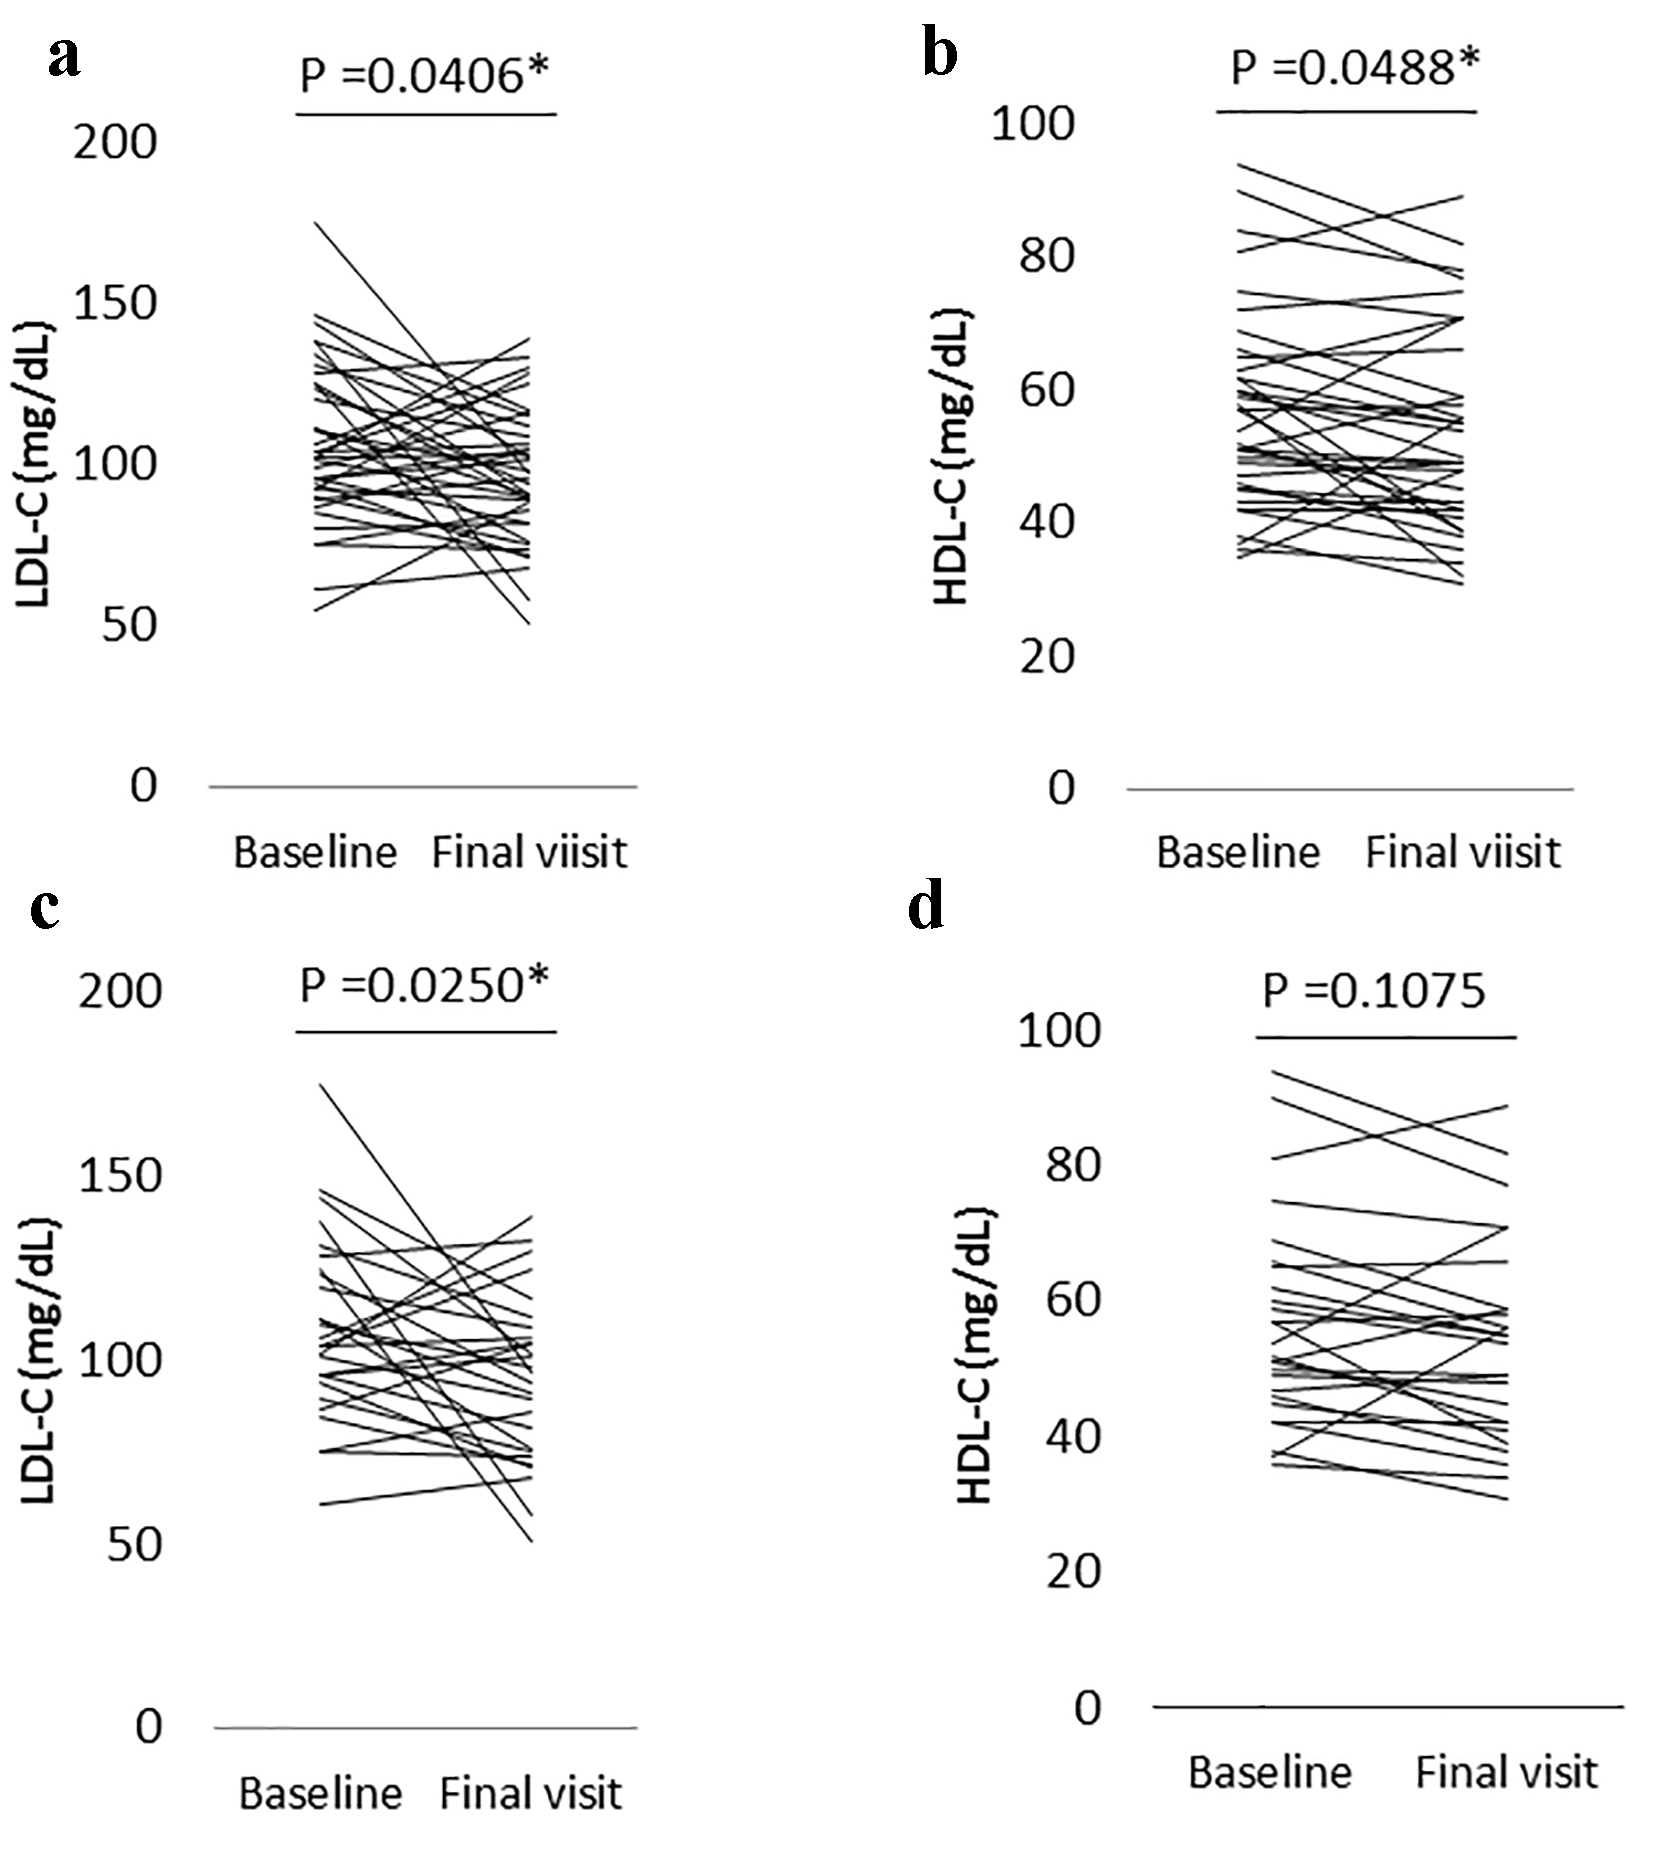
Figure 4. (a) The change in low-density lipoprotein cholesterol (LDL-C) levels from the baseline to the final visit with alogliptin therapy in all patients who had LDL-C levels measured (n = 37). (b) The change of high-density lipoprotein cholesterol (HDL-C) levels from the baseline to the final visit with alogliptin therapy in all patients who had HDL-C levels measured (n = 36). (c) The change in LDL-C levels from the baseline to the final visit with alogliptin therapy in a subgroup patients who did not take either statins, fibrates, or pioglitazone, or who had taken one or more of these drugs but the dose was not changed during the observation period (n = 27). (d) The change in HDL-C levels from the baseline to the final visit with alogliptin therapy in a subgroup patients who did not take either statins, fibrates or pioglitazone, or who had taken one or more of these drugs but the dose was not changed during the observation period (n = 26). *Statistical significance. Final visit: mean 3.5 years from baseline.