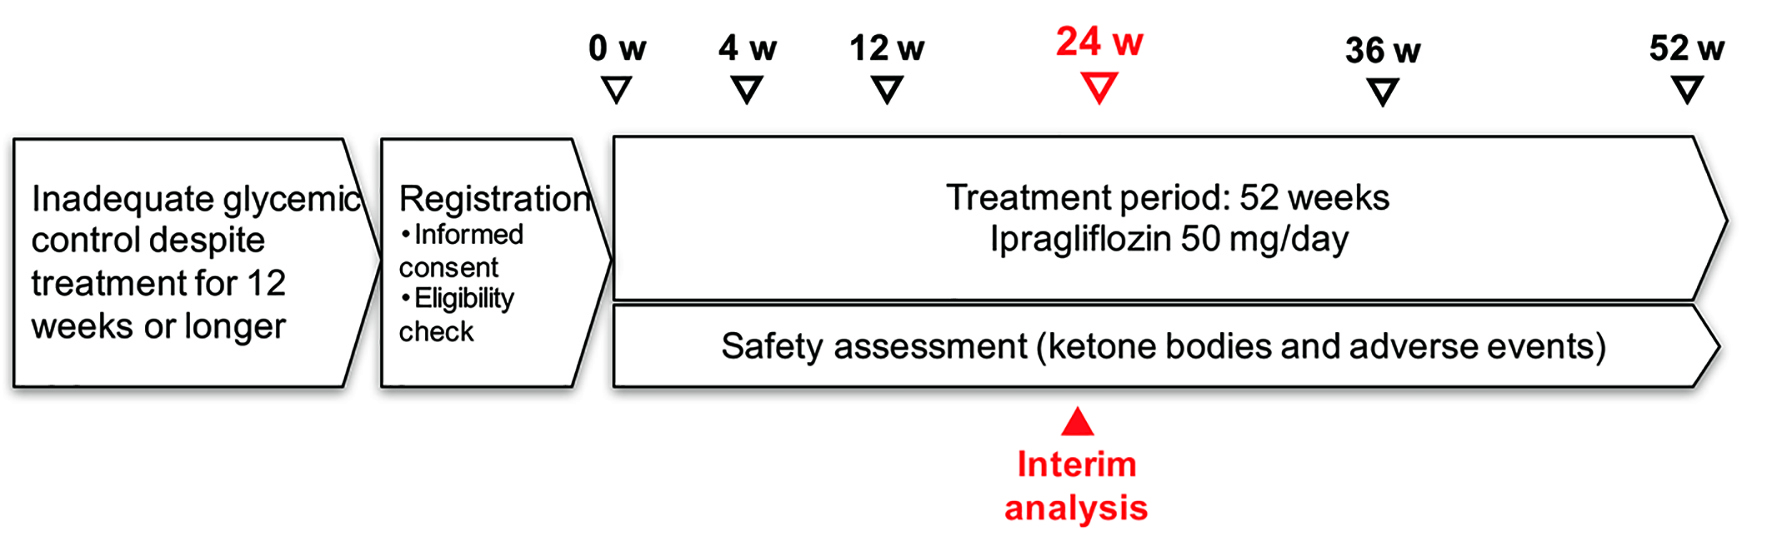
Figure 1. Study schedule.
| Journal of Clinical Medicine Research, ISSN 1918-3003 print, 1918-3011 online, Open Access |
| Article copyright, the authors; Journal compilation copyright, J Clin Med Res and Elmer Press Inc |
| Journal website http://www.jocmr.org |
Original Article
Volume 9, Number 9, September 2017, pages 793-801
Effectiveness of Ipragliflozin for Reducing Hemoglobin A1c in Patients With a Shorter Type 2 Diabetes Duration: Interim Report of the ASSIGN-K Study
Figure
Tables
| Number of patients | 451 |
|---|---|
| *National Glycohemoglobin Standardization Program value. SD: standard deviation. | |
| Age, years, mean ± SD | 55.5 ± 11.6 |
| < 65 years, n (%) | 348 (77.2) |
| ≥ 65 years, n (%) | 103 (22.8) |
| Sex | |
| Male, n (%) | 234 (51.9) |
| Female, n (%) | 217 (48.1) |
| Body weight, kg, mean ± SD | 78.6 ± 16.8 |
| Body mass index, kg/m2, mean ± SD | 29.4 ± 5.3 |
| Waist circumference, cm | 99.8 ± 12.0 |
| Hemoglobin A1c, %,* mean ± SD (n) | 8.01 ± 1.43 (451) |
| Fasting blood glucose, mg/dL, mean ± SD (n) | 156.4 ± 48.0 (197) |
| Postprandial blood glucose, mg/dL, mean ± SD (n) | 179.6 ± 78.9 (252) |
| Duration of diabetes, years, mean ± SD (n) | 9.6 ± 7.4 (451) |
| Systolic blood pressure, mm Hg, mean ± SD (n) | 133.1 ± 17.2 (448) |
| Diastolic blood pressure, mm Hg, mean ± SD (n) | 79.2 ± 11.1 (448) |
| Estimated glomerular filtration rate, mL/min/1.73 m2, mean ± SD (n) | 83.4 ± 21.7 (445) |
| < 60 mL/min/1.73 m2, n (%) | 59 (13.1) |
| ≥ 60 mL/min/1.73 m2, n (%) | 386 (85.6) |
| Complications of diabetes | |
| Diabetic nephropathy | 131 (29.0) |
| Diabetic retinopathy | 62 (13.7) |
| Diabetic neuropathy | 60 (13.3) |
| Prescribing pattern | |
| Initial treatment | 79 (17.5) |
| Concomitant use | 335 (74.3) |
| Switching | 37(8.2) |
| n | Baseline | Week 4 | Week 12 | Week 24 | |
|---|---|---|---|---|---|
| Analysis of variance vs. baseline *** P < 0.001, ** P < 0.01. | |||||
| Hemoglobin A1c, % | 374 | 8.07 ± 1.46 | 7.66 ± 1.22*** | 7.31 ± 1.11*** | 7.26 ± 1.05*** |
| Fasting blood glucose, mg/dL | 114 | 156.0 ± 44.6 | 136.7 ± 36.8*** | 132.2 ± 33.4*** | 136.0 ± 33.2*** |
| Postprandial blood glucose, mg/dL | 137 | 184.7 ± 74.0 | 156.9 ± 58.7*** | 153.4 ± 62.6*** | 147.3 ± 49.5*** |
| Homeostasis model assessment of insulin resistance | 51 | 4.46 ± 3.96 | 3.14 ± 2.27*** | 3.16 ± 2.36*** | 3.28 ± 2.70*** |
| Body weight, kg | 373 | 79.6 ± 16.6 | 78.4 ± 16.4*** | 77.5 ± 16.2*** | 77.0 ± 16.2*** |
| Body mass index, kg/m2 | 373 | 29.6 ± 5.1 | 29.2 ± 5.0*** | 28.9 ± 4.9*** | 28.7 ± 4.9*** |
| Waist circumference, cm | 342 | 99.9 ± 12.1 | 98.9 ± 12.9** | 98.0 ± 11.8*** | 97.0 ± 11.7*** |
| Systolic blood pressure, mm Hg | 369 | 133.1 ± 17.1 | 127.9 ± 16.4*** | 128.5 ± 16.5*** | 128.2 ± 16.8*** |
| Diastolic blood pressure, mm Hg | 369 | 79.1 ± 10.9 | 76.5 ± 10.8*** | 76.6 ± 11.1*** | 76.8 ± 11.7*** |
| Pulse rate, beats/min | 295 | 78.6 ± 12.7 | 79.6 ± 12.2 | 79.3 ± 12.0 | 78.6 ± 12.2 |
| n | Baseline | Week 4 | Week 12 | Week 24 | |
|---|---|---|---|---|---|
| Analysis of variance vs. baseline ***P < 0.001, **P < 0.01, *P < 0.05. | |||||
| Age | |||||
| < 65 years | 294 | 8.19 ± 1.53 | 7.75 ± 1.27*** | 7.38 ± 1.15*** | 7.31 ± 1.09*** |
| ≥ 65 years | 73 | 7.59 ± 1.01 | 7.28 ± 0.89* | 7.03 ± 0.86*** | 7.04 ± 0.83*** |
| Sex | |||||
| Male | 194 | 8.09 ± 1.51 | 7.62 ± 1.22*** | 7.18 ± 1.04*** | 7.17 ± 1.04*** |
| Female | 173 | 8.05 ± 1.39 | 7.70 ± 1.21*** | 7.48 ± 1.17*** | 7.35 ± 1.06*** |
| Baseline body mass index (kg/m2) | |||||
| < 25 | 72 | 8.18 ± 1.66 | 7.58 ± 1.17*** | 7.10 ± 0.99*** | 7.13 ± 0.95*** |
| ≥ 25 and < 30 | 153 | 7.99 ± 1.47 | 7.64 ± 1.26*** | 7.36 ± 1.15*** | 7.34 ± 1.11*** |
| ≥ 30 | 142 | 8.10 ± 1.36 | 7.71 ± 1.23*** | 7.36 ± 1.14*** | 7.23 ± 1.06*** |
| Baseline hemoglobin A1c (%) | |||||
| < 7.0 | 80 | 6.52 ± 0.31 | 6.43 ± 0.48 | 6.30 ± 0.41 | 6.34 ± 0.40 |
| ≥ 7.0 and < 8.0 | 129 | 7.47 ± 0.27 | 7.16 ± 0.40** | 7.01 ± 0.61*** | 7.02 ± 0.68*** |
| ≥ 8.0 | 158 | 9.39 ± 1.24 | 8.69 ± 1.09*** | 8.06 ± 1.15*** | 7.91 ± 1.10*** |
| Duration of diabetes (years) | |||||
| < 5 years | 100 | 7.91 ± 1.67 | 7.42 ± 1.29*** | 6.91 ± 1.06*** | 6.89 ± 0.99*** |
| ≥ 5 to < 10 years | 90 | 8.22 ± 1.29 | 7.80 ± 1.05*** | 7.50 ± 1.03*** | 7.43 ± 1.03*** |
| ≥ 10 to < 15 years | 76 | 8.21 ± 1.32 | 7.83 ± 1.21** | 7.52 ± 1.16*** | 7.44 ± 1.02*** |
| ≥ 15 years | 77 | 8.14 ± 1.41 | 7.76 ± 1.24* | 7.51 ± 1.09*** | 7.48 ± 1.05*** |
| Estimated glomerular filtration rate (mL/min/1.73 m2) | |||||
| < 60 | 46 | 7.54 ± 0.99 | 7.26 ± 0.94*** | 7.05 ± 0.89*** | 7.08 ± 0.89*** |
| ≥ 60 | 318 | 8.14 ± 1.50 | 7.71 ± 1.24 | 7.34 ± 1.13** | 7.28 ± 1.08*** |
| Prescribing pattern | |||||
| Initial treatment | 46 | 7.33 ± 1.14 | 7.05 ± 1.03 | 6.72 ± 0.84*** | 6.47 ± 0.92*** |
| Concomitant use | 318 | 8.17 ± 1.46 | 7.71 ± 1.20*** | 7.31 ± 1.05*** | 7.27 ± 1.00*** |
| Switching | 46 | 8.48 ± 1.49 | 8.24 ± 1.31 | 8.27 ± 1.34 | 7.99 ± 1.18 |
| n | Baseline | Week 4 | Week 12 | Week 24 | |
|---|---|---|---|---|---|
| Analysis of variance vs. baseline ***P< 0.001, **P < 0.01, *P < 0.05. | |||||
| Aspartate aminotransferase, IU/L | 354 | 32.4 ± 24.7 | 30.5 ± 23.1** | 27.7 ± 21.4*** | 25.1 ± 11.8*** |
| Alanine aminotransferase, IU/L | 357 | 39.8 ± 30.3 | 36.6 ± 28.4** | 32.8 ± 22.3*** | 29.6 ± 18.7*** |
| γ-glutamyltransferase, IU/L | 358 | 58.2 ± 60.0 | 49.4 ± 52.2*** | 45.0 ± 42.6*** | 42.5 ± 39.7*** |
| Total cholesterol, mg/dL | 111 | 201.4 ± 36.7 | 197.9 ± 37.7 | 201.6 ± 35.8 | 203.3 ± 38.9 |
| High-density lipoprotein cholesterol, mg/dL | 112 | 52.6 ± 11.8 | 52.5 ± 11.5 | 56.5 ± 18.8 | 57.7 ± 16.5*** |
| Low-density lipoprotein cholesterol, mg/dL | 100 | 117.0 ± 29.9 | 116.9 ± 31.9 | 116.6 ± 29.3 | 117.5 ± 31.6 |
| Triglycerides, mg/dL | 112 | 164.1 ± 101.7 | 145.6 ± 95.0* | 140.8 ± 92.6** | 136.8 ± 94.7*** |
| Uric acid, mg/dL | 348 | 5.4 ± 1.2 | 4.9 ± 1.3*** | 5.0 ± 1.2*** | 4.9 ± 1.2*** |
| Estimated glomerular filtration rate, mL/min/1.73 m2 | 360 | 84.0 ± 21.5 | 80.8 ± 21.9** | 82.4 ± 21.4* | 82.3 ± 21.3* |
| Influence rank | Independent variable | Standardized coefficient beta | Partial regression coefficient | P value |
|---|---|---|---|---|
| n = 328, Stepwise analysis using the following independent variables: age, sex, duration of diabetes, baseline hemoglobin A1c, baseline body mass index, and prescribing pattern (initial monotherapy, concomitant use, or switching). Dependent variable: change in HbA1c. | ||||
| Constant | 0 | 2.295 | < 0.0001 | |
| 1 | Hemoglobin A1c (baseline) | -0.691 | -0.519 | < 0.0001 |
| 2 | Switching to ipragliflozin | 0.166 | 0.615 | < 0.0001 |
| 3 | Duration of diabetes | 0.151 | 0.022 | 0.0002 |
| 4 | Sex | 0.100 | 0.220 | 0.0096 |
| 5 | Age | 0.076 | 0.007 | 0.0842 |
| 6 | Body mass index (baseline) | 0.052 | 0.011 | 0.1982 |
| < 7% | ≥ 7% | P value | |
|---|---|---|---|
| *Not including patients achieving hemoglobin A1c < 7% at baseline. | |||
| Number of patients (%)* | 97 (33.8) | 190 (66.2) | - |
| Female patients | 40.2% | 51.1% | 0.0817 |
| Age, years | 54.9 | 54.8 | 0.9477 |
| Duration of diabetes, years | 9.0 | 10.5 | 0.1092 |
| Baseline hemoglobin A1c, % | 7.86 | 8.83 | < 0.001 |
| Baseline body mass index, kg/m2 | 29.14 | 29.39 | 0.7026 |