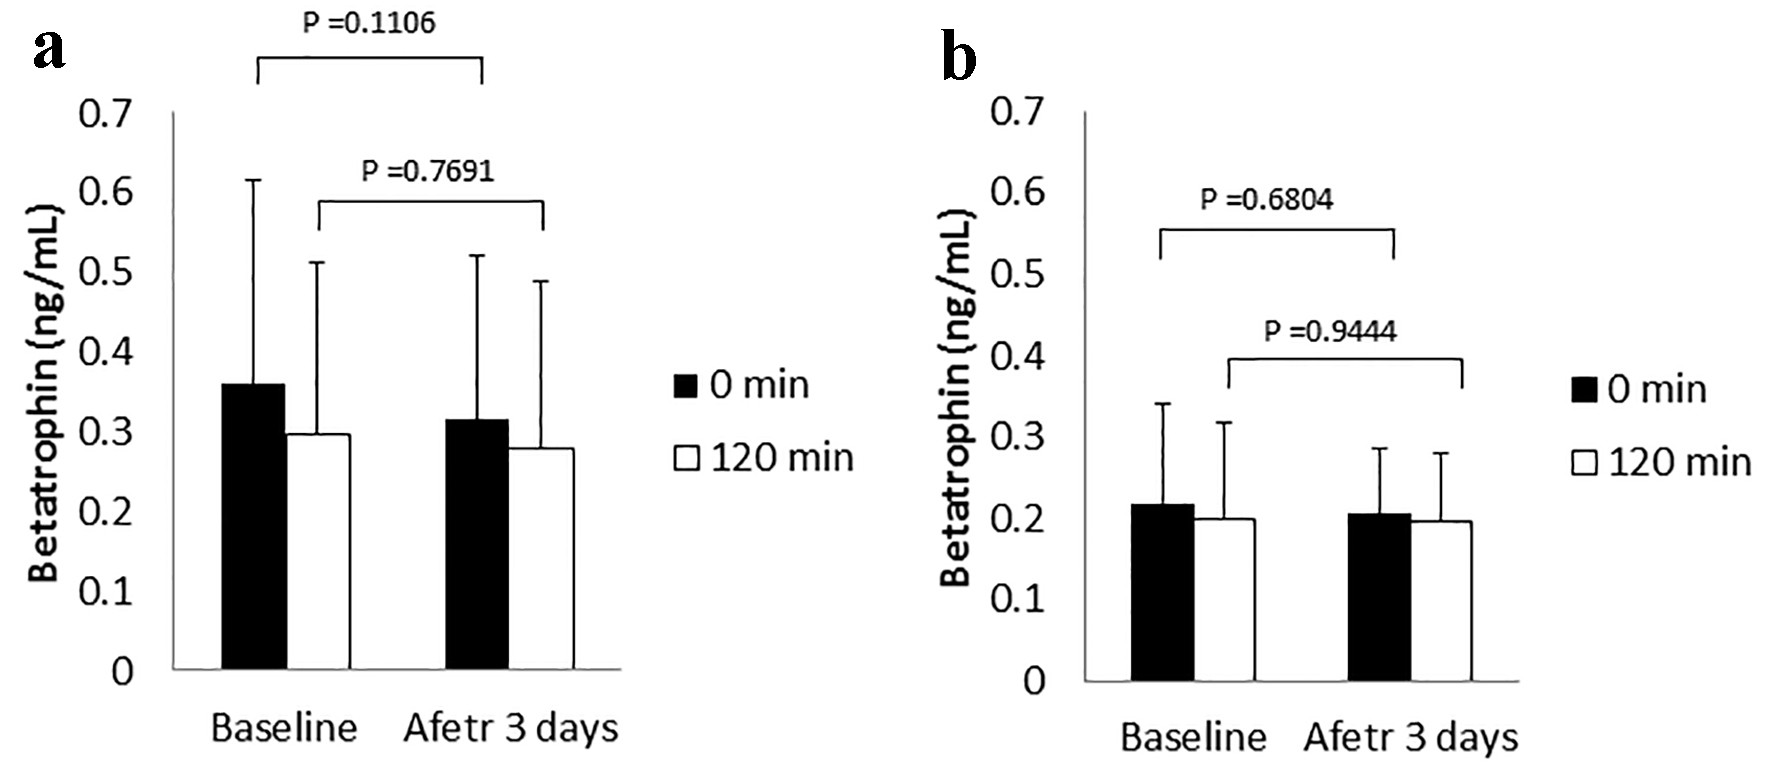
Figure 1. Betatrophin levels in the control (a) and canagliflozin-treated groups (b).
| Journal of Clinical Medicine Research, ISSN 1918-3003 print, 1918-3011 online, Open Access |
| Article copyright, the authors; Journal compilation copyright, J Clin Med Res and Elmer Press Inc |
| Journal website http://www.jocmr.org |
Original Article
Volume 9, Number 9, September 2017, pages 782-787
Serum Betatrophin Levels and Clinical Features in Patients With Poorly Controlled Type 2 Diabetes
Figures
Table
| Simple | Multiple | |||
|---|---|---|---|---|
| R | P | β | P | |
| R: Pearson’s correlation coefficient; β: standard partial regression coefficient; P: P value. P < 0.05 is defined as statistical significance (*). For hsCRP, AST, ALT and GGT, the data was log10-transformed due to the skewed distribution. BMI: body mass index; FPG: fasting plasma glucose; HbA1c: hemoglobin A1c; SBP: systolic blood pressure; DBP: diastolic blood pressure; TG: triglyceride; HDL-C: high-density lipoprotein cholesterol; LDL-C: low-density lipoprotein cholesterol; Cr: creatinine; UA: uric acid; U-CPR: urinary C-peptide immunoreactivity; hsCRP: high-sensitivity C reactive protein; AST: aspartate transaminase; ALT: alanine transaminase; GGT: gamma-glutamyl transpeptidase. Multiple regression analysis with betatrophin as the dependent variable was performed using stepwise forward selection method, and R2 was 0.5691. The independent variables tested initially were all those used in simple regression analysis. Used cut-off F value was 2. | ||||
| Age (years) | -0.3471 | 0.0602 | -0.2685 | 0.0869 |
| BMI (kg/m2) | -0.1322 | 0.4862 | - | - |
| FPG (mg/dL) | 0.3890 | 0.0370* | - | - |
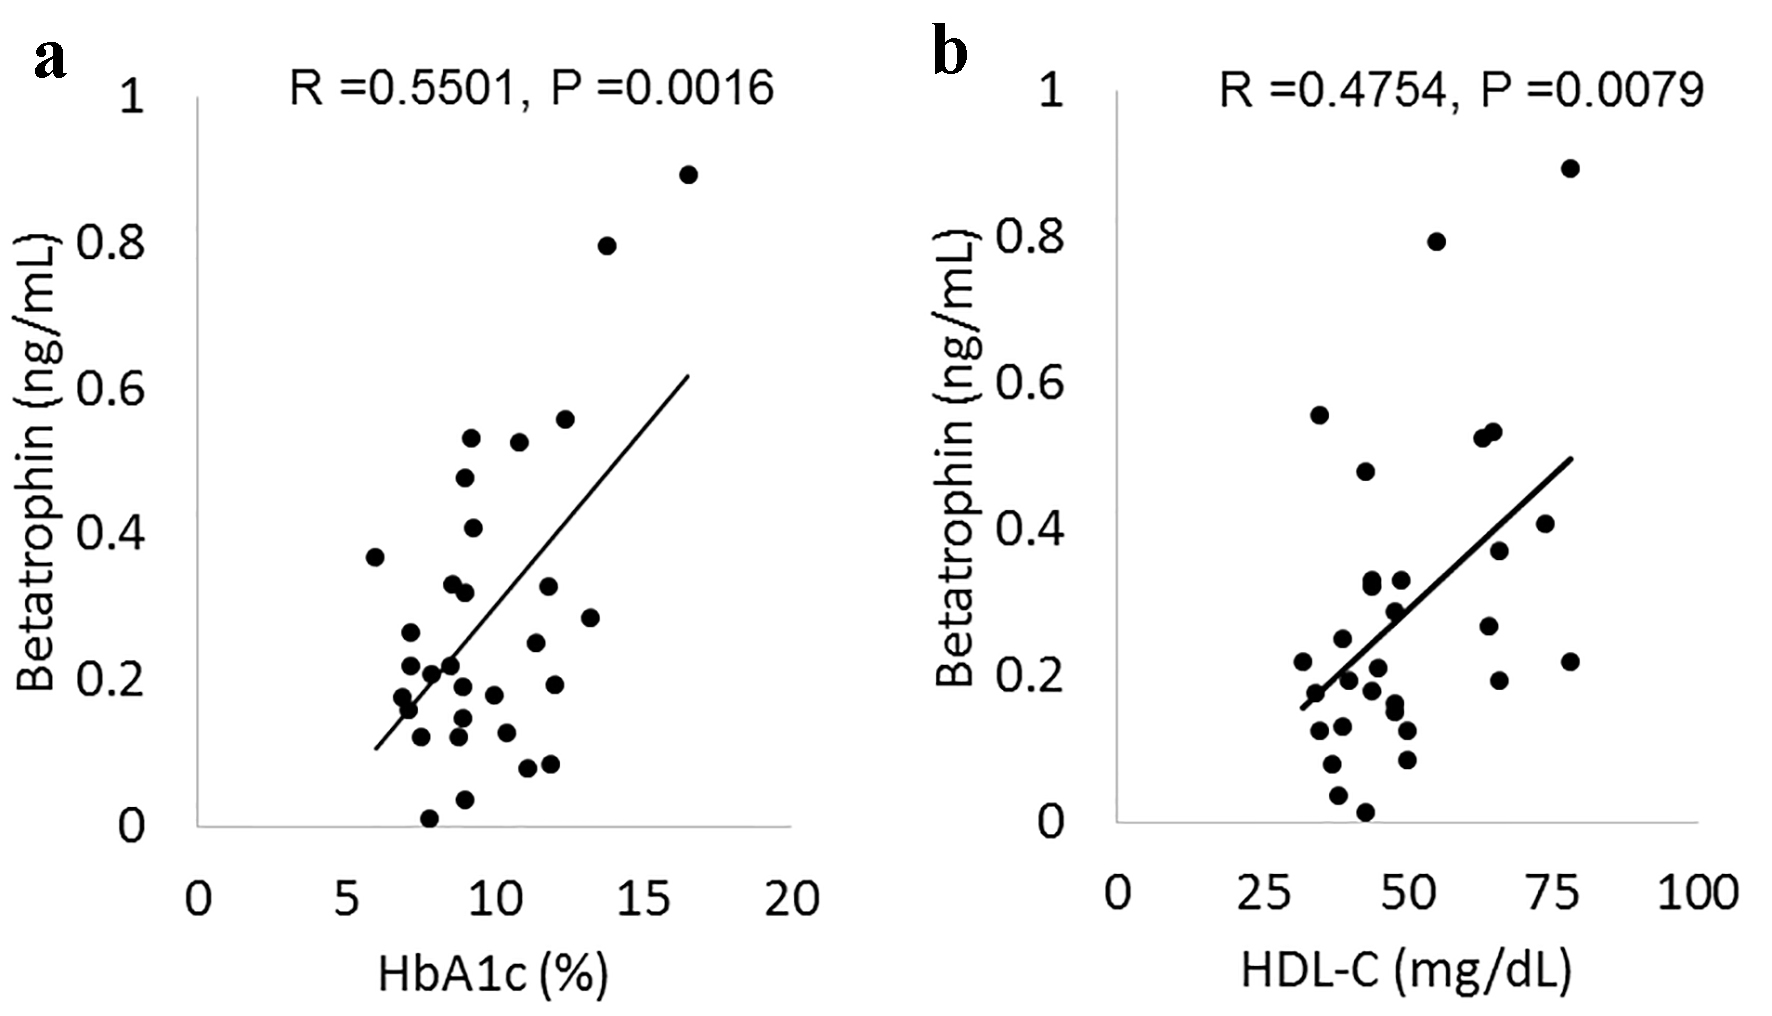
| HbA1c (%) | 0.5501 | 0.0016* | 0.3451 | 0.0331* |
| SBP (mm Hg) | -0.0463 | 0.8079 | - | - |
| DBP (mm Hg) | 0.2710 | 0.1474 | - | - |
| TG (mg/dL) | 0.0517 | 0.7862 | - | - |
| HDL-C (mg/dL) | 0.4754 | 0.0079* | 0.4616 | 0.0041* |
| LDL-C (mg/dL) | -0.0736 | 0.6991 | - | - |
| Cr (mg/dL) | -0.1780 | 0.3466 | - | - |
| Insulin (µU/mL) | 0.0409 | 0.8330 | - | - |
| UA (mg/mL) | -0.0279 | 0.8835 | - | - |
| U-CPR (µg/day) | -0.1494 | 0.4392 | - | - |
| Log10-hsCRP (mg/L) | -0.0898 | 0.6434 | - | - |
| Log10-AST (U/L) | 0.2760 | 0.1398 | - | - |
| Log10-ALT (U/L) | 0.3333 | 0.0719 | 0.246 | 0.1244 |
| Log10-GGT (U/L) | -0.0212 | 0.9113 | - | - |