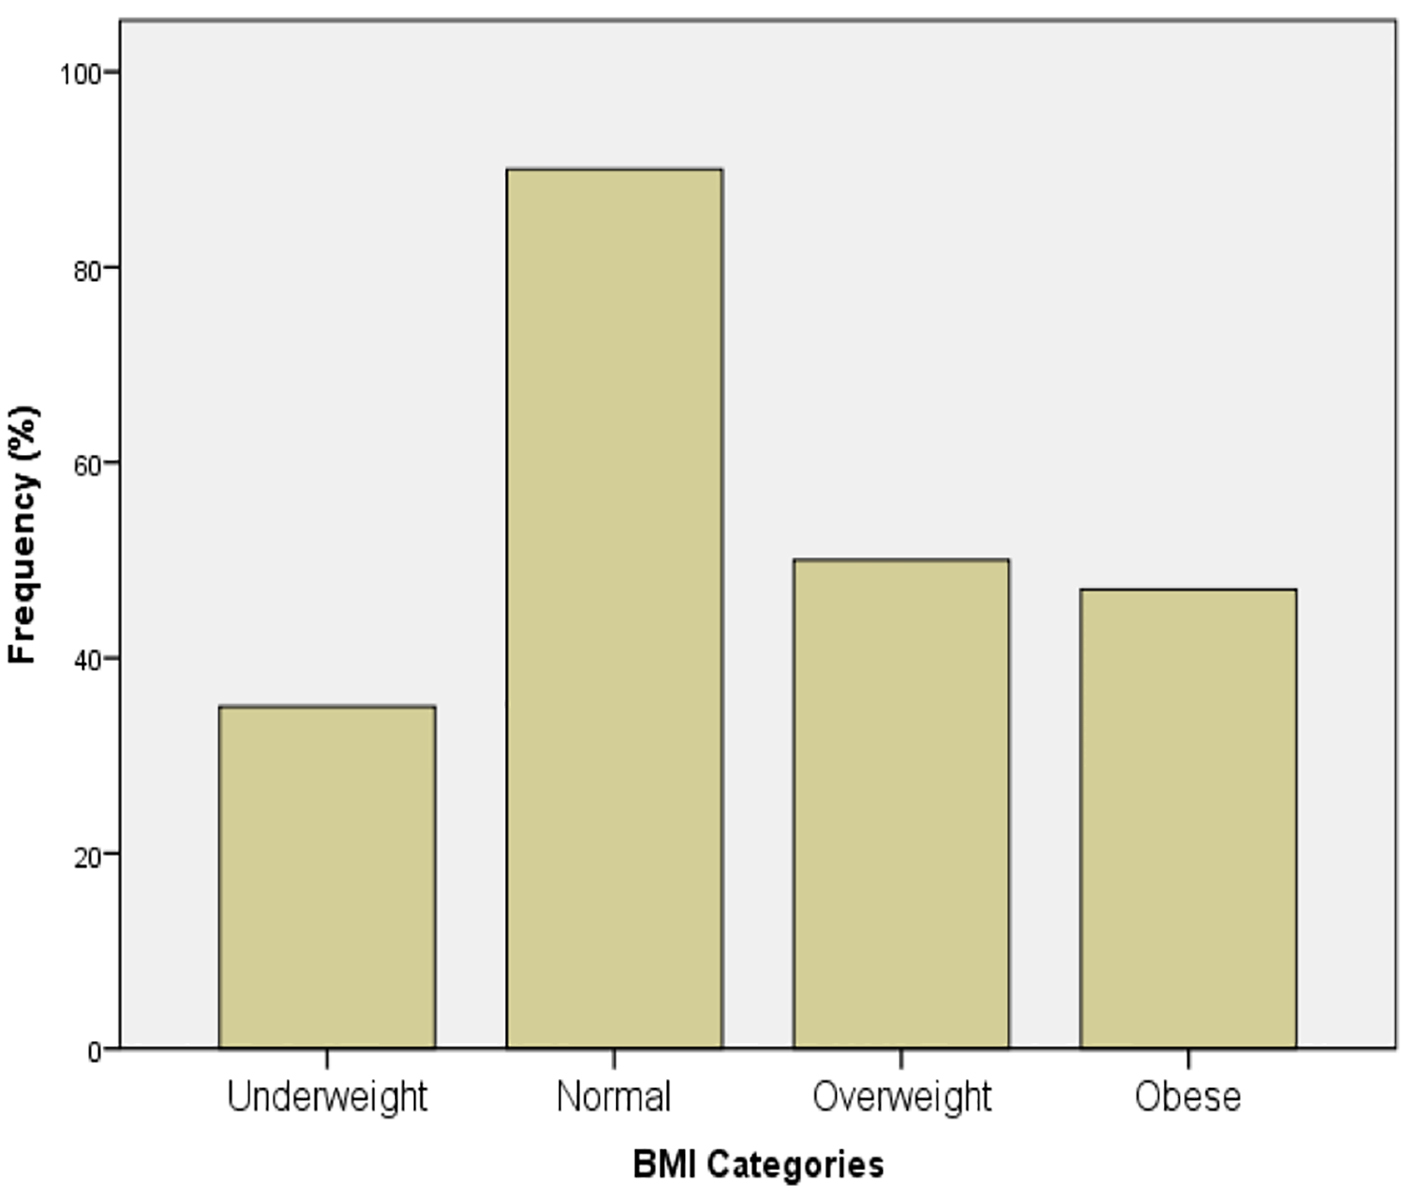
Figure 1. BMI distribution of the whole cohort.
| Journal of Clinical Medicine Research, ISSN 1918-3003 print, 1918-3011 online, Open Access |
| Article copyright, the authors; Journal compilation copyright, J Clin Med Res and Elmer Press Inc |
| Journal website http://www.jocmr.org |
Original Article
Volume 9, Number 8, August 2017, pages 687-694
Prevalence of Metabolic Syndrome Among the End-Stage Renal Disease Patients on Hemodialysis
Figures


Tables
| Baseline characteristics (N = 241) | |
|---|---|
| Mean age (years) | 48.8 ± 16 |
| Male (%) | 48.3 |
| Married (%) | 70.5 |
| High school degree or less (%) | 40 |
| Mean dry weight (kg) | 62.9 ± 17.6 |
| Mean BMI (kg/m2) | 25.6 ± 8.7 |
| Mean waist circumference (cm) | 92.0 ± 23.5 |
| Mean SBP (mm Hg) | 136.4 ± 25.1 |
| Mean DBP (mm Hg) | 76.1 ± 14.8 |
| Mean pulse rate (bpm) | 81.7 ± 12 |
| Diabetes (%) | 26.9 |
| Hypertension (%) | 67.8 |
| Hyperlipidemia (%) | 21 |
| History of myocardial infarction (%) | 8.7 |
| Heart failure (%) | 5.0 |
| History of blood transfusion (%) | 64 |
| Medications | |
| Beta-blocker (%) | 16.4 |
| ACEi/ARB (%) | 13.4 |
| Calcium channel blocker (%) | 47.5 |
| Hydralazine (%) | 6.3 |
| Cholecalciferol (%) | 7.6 |
| Cinacalcet (%) | 31.9 |
| Calcium carbonate (%) | 76.5 |
| Sevelamer (%) | 52.9 |
| Active vitamin D (%) | 58.0 |
| Statin (%) | 19.1 |
| Dialysis data | |
| Mean duration of dialysis (months) | 69.3 ± 65.6 |
| Permacath as an access for HD (%) | 21.5 |
| Temporary HD access (%) | 5.4 |
| AVF as an access for HD (%) | 73.1 |
| ≥ 2 AVF placed for HD (%) | 28.7 |
| Mean duration of AVF (years) | 1.8 ± 1.4 |
| ≥ 2 missed dialysis session in the previous 3 months (%) | 50 |
| ≥ 2 urgent dialysis in the previous 6 months (%) | 66.7 |
| History of line infection (%) | 35.8 |
| PTH at goal (%) | 22.5 |
| Laboratory data | |
| Mean total cholesterol (mg/dL) | 145.3 ± 40.8 |
| Mean LDL (mg/dL) | 89.7 ± 7 |
| Mean HDL (mg/dL) | 38.2 ± 13.6 |
| Mean triglyceride (mg/dL) | 145.4 ± 105.2 |
| Mean total Ca (mg/dL) | 8.7 ± 1.2 |
| Mean phosphate (mg/dL) | 6.3 ± 7.2 |
| Mean PTH (pmol/L) | 57.3 ± 76.5 |
| Mean pre-HD creatinine(mg/dL) | 14.9 ± 25.3 |
| Mean post-HD creatinine(mg/dL) | 5.7 ± 7.5 |
| Mean post-HD urea (mg/dL) | 37.2 ± 23.6 |
| Vitamin D 25-OH (ng/mL) | 18.5 ± 8.9 |
| Lifestyle habits | |
| Sedentary lifestyle (%) | 42.3 |
| Optimal sleep 6 - 8 h per night (%) | 43.3 |
| Active smoking (%) | 14.9 |
| Passive smoking (%) | 43.6 |
| MetS | No MetS | P value | |
|---|---|---|---|
| Total number of the participants (%) | 38.2 | 61.8 | n/a |
| Mean age (years) | 53.8 ± 14.1 | 45.7 ± 16.4 | < 0.001 |
| Male (%) | 39.1 | 54 | 0.025 |
| Married (%) | 80.4 | 64.4 | 0.026 |
| High school degree or less (%) | 34.8 | 43.2 | 0.397 |
| Mean dry weight (kg) | 72 ± 17.4 | 57.3 ± 15.3 | < 0.001 |
| Mean BMI (kg/m2) | 28.2 ± 7.4 | 23.9 ± 9.1 | < 0.001 |
| Mean waist circumference (cm) | 107.1 ± 17.5 | 81.5 ± 21.4 | < 0.001 |
| Mean SBP (mm Hg) | 139.3 ± 24.3 | 134.5 ± 25.6 | 0.159 |
| Mean DBP (mm Hg) | 76.6 ± 14.8 | 75.9 ± 14.9 | 0.731 |
| Mean pulse rate (bpm) | 81.8 ± 12.1 | 81.7 ± 12 | 0.958 |
| Diabetes (%) | 39.1 | 19.3 | 0.001 |
| Hypertension (%) | 82.6 | 58.7 | < 0.001 |
| Hyperlipidemia (%) | 26.1 | 17.8 | 0.127 |
| History of myocardial infarction (%) | 10.9 | 7.4 | 0.351 |
| Heart failure (%) | 6.5 | 4.0 | 0.387 |
| History of blood transfusion (%) | 57.3 | 68.0 | 0.096 |
| Medications | |||
| Beta-blocker (%) | 21.7 | 13.0 | 0.077 |
| ACEi/ARB (%) | 18.5 | 10.3 | 0.071 |
| Calcium channel blocker (%) | 58.7 | 40.4 | 0.006 |
| Hydralazine (%) | 6.5 | 6.2 | 0.912 |
| Cholecalciferol (%) | 6.5 | 8.2 | 0.630 |
| Cinacalcet (%) | 33.7 | 30.8 | 0.643 |
| Calcium carbonate (%) | 77.2 | 76.0 | 0.839 |
| Sevelamer (%) | 64.1 | 45.9 | 0.006 |
| Active vitamin D (%) | 59.8 | 56.9 | 0.655 |
| Statin (%) | 23.1 | 16.6 | 0.214 |
| Dialysis data | |||
| Mean duration of dialysis (months) | 59.3 ± 49.4 | 75.5 ± 73.4 | 0.043 |
| Permacath as an access for HD (%) | 19.6 | 22.7 | 0.729 |
| Temporary HD access (%) | 6.5 | 4.7 | |
| AVF as an access for HD (%) | 73.9 | 72.6 | |
| > 2 AVF placed for HD (%) | 30.9 | 27.4 | 0.383 |
| Mean duration of AVF (years) | 2.1 ± 1.7 | 1.7 ± 1.0 | 0.026 |
| > 2 missed dialysis session in the previous 3 months (%) | 26.7 | 62.7 | 0.056 |
| > 2 urgent dialysis in the previous 6 months (%) | 59.4 | 72.1 | 0.332 |
| History of line infection (%) | 41.3 | 32.4 | 0.163 |
| PTH at goal (%) | 18.9 | 24.8 | 0.046 |
| Laboratory data | |||
| Mean total cholesterol (mg/dL) | 143.1 ± 41.4 | 147.1 ± 40.4 | 0.535 |
| Mean LDL (mg/dL) | 91.9 ± 32.8 | 87.9 ± 27.6 | 0.401 |
| Mean HDL (mg/dL) | 37.4 ± 11.1 | 38.9 ± 15.3 | 0.511 |
| Mean triglyceride (mg/dL) | 151.9 ± 100.6 | 140.2 ± 109.1 | 0.485 |
| Mean total Ca (mg/dL) | 8.8 ± 0.9 | 8.7 ± 1.3 | 0.468 |
| Mean phosphate (mg/dL) | 7.0 ± 9.7 | 5.9 ± 5.1 | 0.247 |
| Mean pre-HD creatinine (mg/dL) | 13.4 ± 17.2 | 16.0 ± 29.4 | 0.447 |
| Mean post-HD creatinine (mg/dL) | 6.3 ± 7.8 | 5.3 ± 7.3 | 0.467 |
| Mean post-HD urea (mg/dL) | 42.3 ± 23.8 | 34.1 ± 22.9 | 0.010 |
| Vitamin D 25-OH (ng/mL) | 18.4 ± 8.6 | 18.5 ± 9.2 | 0.912 |
| Lifestyle habits | |||
| Sedentary lifestyle (%) | 44.0 | 41.2 | 0.035 |
| Exercise > 300 min/week (%) | 3.3 | 14.2 | |
| Optimal sleep 6 - 8 h per night (%) | 45.7 | 41.9 | 0.838 |
| Active smoking (%) | 13.0 | 16.1 | 0.517 |
| Passive smoking (%) | 42.5 | 44.3 | 0.799 |