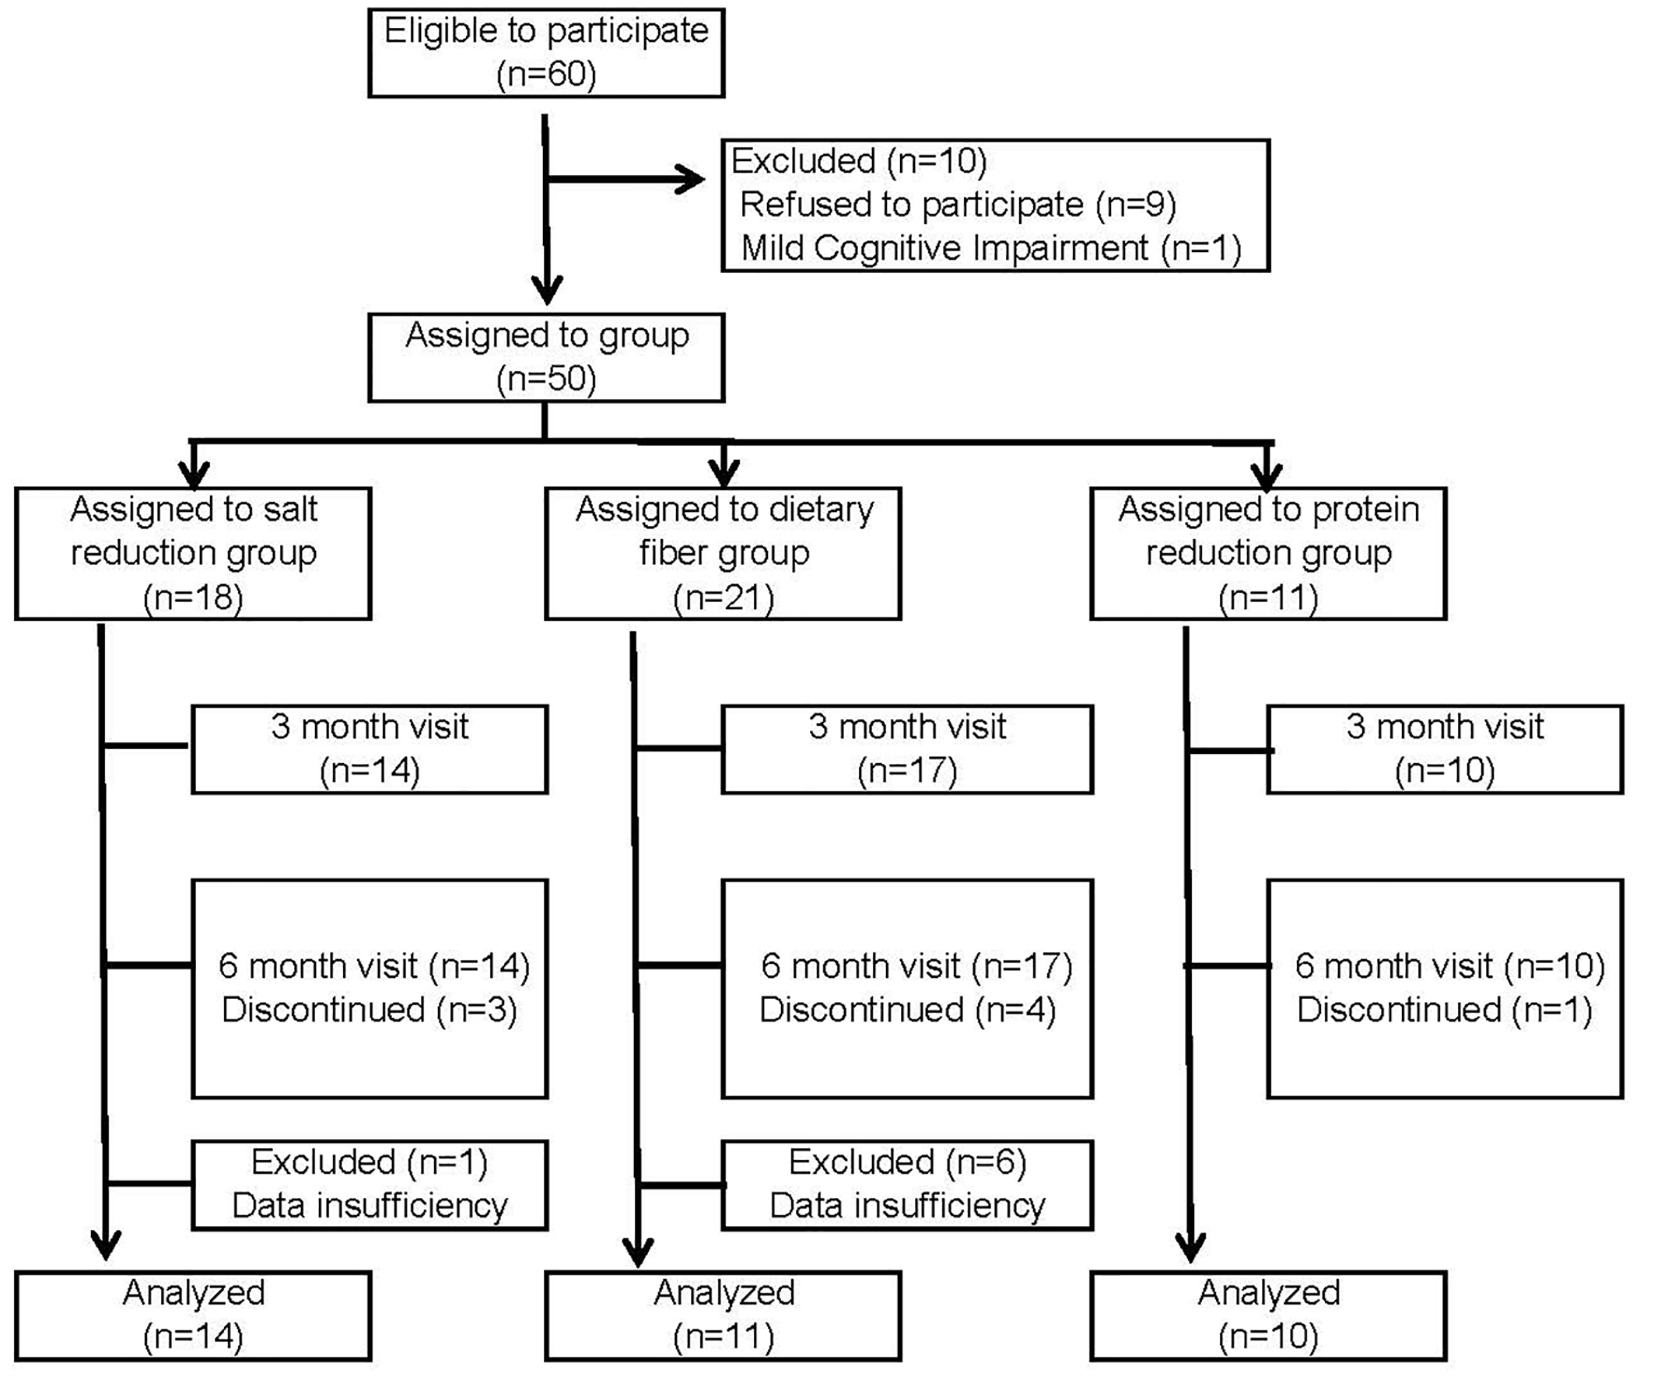
Figure 1. Flow diagram according to selection and non-continuation.
| Journal of Clinical Medicine Research, ISSN 1918-3003 print, 1918-3011 online, Open Access |
| Article copyright, the authors; Journal compilation copyright, J Clin Med Res and Elmer Press Inc |
| Journal website http://www.jocmr.org |
Original Article
Volume 9, Number 7, July 2017, pages 630-637
Dietary Modification Trial in Community-Dwelling Japanese Elderly: A Pilot Study
Figure
Tables
| Salt reduction (n = 18) | Dietary fiber (n = 21) | Protein reduction (n = 11) | P value | |
|---|---|---|---|---|
| Data were expressed as median (25th percentile - 75th percentile). *Data were expressed as median (minimum - maximum). Kruskal-Wallis test and Chi-square test for categorical variables were performed for comparison of three groups. MNA-SF: mini-nutritional assessment short form; TMIG-IC: Tokyo Metropolitan Institute of Gerontology Index of Competence; TG: triglyceride; eGFR: estimated glomerular filtration rate; RBC: red blood cell count; WBC: white blood cell count. | ||||
| Age (years) | 71.5 (69.8 - 78.0) | 72.0 (70.5 - 77.5) | 76.0 (72.0 - 80.0) | 0.367 |
| Sex (men/women) | 6:12 | 5:16 | 4:7 | 0.708 |
| BMI (kg/m2) | 24.1 (20.4 - 25.6) | 24.5 (22.4 - 27.0) | 24.6 (21.2 - 26.5) | 0.762 |
| MNA-SF (points) | 12.5 (11.0 - 14.0) | 13.0 (11.0 - 14.0) | 13.0 (10.0 - 14.0) | 0.894 |
| TMIG-IC (points) | 13.0 (12.0 - 13.0) | 12.0 (11.0 - 13.0) | 12.0 (10.0 - 14.0) | 0.145 |
| Charlson comorbidity index | ||||
| 0 - 2 points | 12 (66.7%) | 17 (80.9%) | 7 (63.6%) | 0.479 |
| 3 - 5 points | 6 (33.3%) | 4 (19.0%) | 4 (36.4%) | |
| Waist circumference (cm) | ||||
| Men (n = 4/4/2) | 95.3 (84.5 - 98.7) | 89.9 (78.5 - 95.3) | 91.1 (86.1 - 99.0)* | 0.692 |
| Women (n = 8/7/5) | 89.2 (75.3 - 93.3) | 86.9 (79.7 - 97.4) | 90.9 (82.5 - 95.7) | 0.779 |
| Body fat (%) | 27.2 (23.4 - 31.2) | 25.3 (20.2 - 29.2) | 30.2 (22.6 - 32.6) | 0.730 |
| Total energy consumption (kcal/day) | 1,574 (1,489 - 1,884) | 1,627 (1,424 - 1,687) | 1,394 (1,349 - 1,592) | 0.048 |
| Number of steps | 7,374 (3,172 - 9,925) | 5,278 (2,573 - 7,940) | 3,454 (973 - 5,899) | 0.061 |
| Albumin (g/dL) | 4.5 (4.2 - 4.7) | 4.2 (4.1 - 4.5) | 4.1 (3.8 - 4.4) | 0.219 |
| Total cholesterol (mg/dL) | 191.5 (173.3 - 210.5) | 193.5 (173.3 - 226.8) | 188.0 (156.0 - 251.0) | 0.842 |
| TG (mg/dL) | 93.5 (72.0 - 125.5) | 118.0 (90.0 - 149.0) | 120.0 (79.0 - 219.0) | 0.286 |
| Creatinine (mg/dL) | 0.8 (0.6 - 0.9) | 0.6 (0.5 - 0.8) | 1.4 (1.2 - 1.9) | < 0.001 |
| Na (mEq/L) (n = 12/10/6) | 141.0 (140.3 - 142.3) | 141.5 (140.3 - 144.8) | 142.0 (138.5 - 143.3) | 0.912 |
| Cl (mEq/L) (n = 12/9/6) | 103.0 (101.0 - 104.0) | 103.0 (101.3 - 104.0) | 102.5 (101.3 - 104.8) | 0.997 |
| K (mEq/L) (n = 16/15/11) | 4.3 (4.1 - 4.5) | 4.1 (3.8 - 4.4) | 4.7 (4.4 - 5.0) | 0.006 |
| eGFR (mL/min/1.73 m2) | 68.0 (52.3 - 77.1) | 76.3 (64.1 - 89.6) | 29.8 (22.9 - 35.1) | < 0.001 |
| RBC (× 104/μL) | 435.5 (394.3 - 446.0) | 435 (399.8 - 463.0) | 385.0 (343.0 - 427.0) | 0.018 |
| Hemoglobin (g/dL) | 13.7 (12.4 - 14.4) | 13.1 (11.9 - 14.1) | 11.4 (10.2 - 13.0) | 0.013 |
| CRP (mg/dL) (n = 19/18/10) | 0.08 (0.05 - 0.14) | 0.11 (0.05 - 0.16) | 0.14 (0.05 - 0.43) | 0.561 |
| WBC (× 102/μL) | 55.0 (34.0 - 61.0) | 54.0 (46.5 - 72.3) | 59.0 (49.0 - 68.0) | 0.538 |
| Baseline | 3 months | 6 months | P value | |
|---|---|---|---|---|
| Data were expressed as median (25th percentile - 75th percentile). Friedman tests were performed for comparison of 3 time point. TG: triglyceride. | ||||
| BMI (kg/m2) | 23.8 (20.2 - 25.3) | 23.6 (20.1 - 25.3) | 23.6 (20.6 - 25.2) | 0.458 |
| Body fat (%) | 27.2 (23.4 - 31.2) | 23.7 (18.5 - 31.2) | 22.5 (18.8 - 28.3) | 0.045 |
| Total energy consumption (kcal) | 1,681 (1,519 - 1,894) | 1,633 (1,469 - 1,915) | 1,604 (1,420 - 1,892) | 0.307 |
| Albumin (g/dL) (n = 8) | 4.7 (4.1 - 4.9) | 4.6 (4.3 - 4.8) | 4.6 (4.2 - 4.9) | 0.727 |
| Total cholesterol (mg/dL) (n = 7) | 190 (154 - 209) | 189 (157 - 206) | 179 (158 - 197) | 0.368 |
| TG (mg/dL) (n = 8) | 95.5 (60.0 - 120.0) | 73.0 (60.3 - 97.0) | 68.5 (60.3 - 103.3) | 0.093 |
| Energy intake (kcal/day) | 1,703 (1,450 - 1,896) | 1,703 (1,471 - 1,969) | 1,739 (1,453 - 1,813) | 0.292 |
| Energy intake (kcal/kg IBW/day/day) | 27.9 (25.7 - 32.3) | 28.3 (26.5 - 33.4) | 27.8 (24.4 - 32.4) | 0.116 |
| Protein (g/kg IBW/day) | 1.26 (1.19 - 1.42) | 1.23 (1.03 - 1.48) | 1.10 (1.00 - 1.27) | 0.092 |
| Protein (% energy) | 17.0 (16.0 - 19.5) | 17.0 (14.5 - 19.4) | 15.0 (13.5 - 19.5) | 0.226 |
| Fat (% energy) | 29.2 (25.2 - 32.5) | 30.0 (27.5 - 33.0) | 27.0 (19.3 - 31.5) | 0.118 |
| Carbohydrate (% energy) | 52.0 (48.5 - 59.4) | 52.0 (50.0 - 56.0) | 57.0 (51.5 - 66.3) | 0.025 |
| Fiber (g) | 21.2 (17.9 - 22.4) | 17.6 (12.6 - 21.6) | 17.7 (12.1 - 20.7) | 0.041 |
| NaCl (g) | 9.6 (8.9 - 12.7) | 8.0 (7.1 - 9.6) | 8.1 (7.4 - 8.8) | 0.005 |
| Systolic pressure (mm Hg) (n = 10) | 135 (126 - 145) | 122 (120 - 138) | 125 (119 - 133) | 0.085 |
| Diastolic pressure (mm Hg) (n = 10) | 73 (69 - 80) | 70 (66 - 75) | 67 (60 - 77) | 0.172 |
| Baseline | 3 months | 6 months | P value | |
|---|---|---|---|---|
| Data were expressed as median (25th percentile - 75th percentile). Friedman tests were performed for comparison of 3 time point. TG: triglyceride. | ||||
| BMI (kg/m2) | 24.4 (22.4 - 26.2) | 24.8 (22.4 - 26.6) | 24.7 (22.4 - 26.8) | 0.225 |
| Body fat (%) | 25.6 (23.0 - 29.7) | 24.5 (19.8 - 37.2) | 24.0 (20.8 - 37.6) | 0.614 |
| Total energy consumption (kcal/day) | 1,584 (1,394 - 1,697) | 1,555 (1,378 - 1,700) | 1,584 (1,420 - 1,655) | 0.307 |
| Albumin (g/dL) | 4.2 (4.0 - 4.6) | 4.3 (4.0 - 4.5) | 4.3 (4.0 - 4.5) | 0.703 |
| Total cholesterol (mg/dL) | 209 (173 - 243) | 194 (183 - 227) | 190 (167 - 207) | 0.045 |
| TG (mg/dL) | 103 (86 - 164) | 101 (76 - 126) | 96 (65 - 134) | 0.850 |
| Energy intake (kcal/day) | 1,799 (1,447 - 1,895) | 1,689 (1,539 - 1,916) | 1,639 (1,487 - 1,757) | 0.264 |
| Energy intake (kcal/kg IBW/day) | 32.2 (23.9 - 35.1) | 30.0 (27.9 - 31.3) | 28.8 (24.1 - 33.0) | 0.264 |
| Protein (g/kg IBW/day) | 1.30 (1.06 - 1.56) | 1.25 (1.06 - 1.56) | 1.19 (1.03 - 1.57) | 0.913 |
| Protein (% energy) | 17.0 (15.7 - 18.0) | 17.0 (14.0 - 18.0) | 16.1 (13.0 - 20.0) | 0.976 |
| Fat (% energy) | 27.9 (22.2 - 28.0) | 28.0 (21.0 - 32.3) | 28.0 (24.0 - 34.6) | 0.509 |
| Carbohydrate (% energy) | 55.0 (53.5 - 62.0) | 55.0 (50.4 - 59.3) | 52.0 (49.0 - 59.0) | 0.695 |
| Fiber (g) | 13.4 (11.0 - 17.2) | 15.3 (11.1 - 19.1) | 15.5 (9.9 - 17.6) | 0.695 |
| NaCl (g) | 9.4 (7.5 - 11.4) | 8.6 (7.3 - 10.2) | 7.3 (5.8 - 8.8) | 0.078 |
| Systolic pressure (mm Hg) (n = 10) | 122 (110 - 140) | 123 (113 - 137) | 114 (107 - 121) | 0.179 |
| Diastolic pressure (mm Hg) (n = 10) | 72 (60 - 85) | 69 (60 - 77) | 67 (52 - 79) | 0.139 |
| Baseline | 3 months | 6 months | P value | |
|---|---|---|---|---|
| Data were expressed as median (25th percentile - 75th percentile). Friedman tests were performed for comparison of 3 time point. TG: triglyceride; BUN: blood urea nitrogen; eGFR: estimated glomerular filtration rate. | ||||
| BMI (kg/m2) (n = 9) | 22.5 (20.5 - 25.6) | 22.1 (20.5 - 24.3) | 22.8 (20.6 - 24.3) | 0.674 |
| Body fat (%) (n = 5) | 31.2 (23.6 - 33.9) | 30.8 (23.7 - 34.8) | 30.0 (24.3 - 33.1) | 0.819 |
| Total energy consumption (kcal/day) (n = 5) | 1,385 (1,345 - 1,625) | 1,483 (1,395 - 1,629) | 1,474 (1,367 - 1,574) | 0.041 |
| Albumin (g/dL) (n = 6) | 4.0 (3.8 - 4.3) | 3.9 (3.8 - 4.4) | 4.0 (3.7 - 4.1) | 0.819 |
| Total cholesterol (mg/dL) (n = 8) | 178 (159 - 239) | 180 (160 - 201) | 192 (152 - 207) | 0.687 |
| TG (mg/dL) (n = 6) | 122 (79 - 156) | 100 (70 - 220) | 104 (52 - 221) | 1.000 |
| BUN (mg/dL) (n = 9) | 30.7 (27.8 - 44.8) | 29.4 (26.8 - 43.4) | 31.2 (26.4 - 37.2) | 0.717 |
| Creatinine (mg/dL) (n = 8) | 1.3 (1.1 - 2.1) | 1.3 (1.0 - 2.2) | 1.2 (1.0 - 2.0) | 0.417 |
| K (mEq/L) (n = 7) | 4.7 (4.4 - 5.5) | 4.7 (4.1 - 5.6) | 4.0 (4.0 - 5.1) | 0.607 |
| eGFR (mL/min/1.73 m2) (n = 9) | 31.0 (21.5 - 37.1) | 30.0 (21.8 - 44.2) | 29.3 (22.0 - 43.7) | 0.368 |
| RBC (× 104/μL) (n = 7) | 385 (348 - 396) | 352 (342 - 379) | 365 (330 - 389) | 0.163 |
| Hemoglobin (g/dL) (n = 7) | 11.4 (11.0 - 12.5) | 10.9 (10.7 - 11.9) | 11.6 (9.8 - 11.8) | 0.276 |
| Energy intake (kcal/day) | 1,630 (1,510 - 1,824) | 1,517 (1,411 - 1,574) | 1,524 (1,460 - 1,576) | 0.012 |
| Energy intake (kcal/kg IBW/day) | 31.2 (29.7 - 34.4) | 27.8 (26.5 - 31.8) | 27.5 (26.0 - 31.6) | 0.004 |
| Protein (g/kg IBW/day) | 1.24 (1.06 - 1.46) | 1.20 (0.88 - 1.42) | 1.20 (0.96 - 1.28) | 0.417 |
| Protein (% energy) | 17.0 (13.0 - 18.0) | 15.0 (13.3 - 18.0) | 17.0 (15.2 - 17.5) | 0.819 |
| Fat (% energy) | 28.0 (20.5 - 32.0) | 27.0 (24.0 - 30.0) | 26.0 (19.7 - 29.0) | 0.307 |
| Carbohydrate (% energy) | 57.0 (52.5 - 62.2) | 56.0 (54.6 - 59.8) | 57.0 (56.8 - 63.5) | 0.207 |
| K (mg) | 2,395 (1,787 - 2,941) | 1,937 (1,166 - 2,565) | 2,418 (1,965 - 2,658) | 0.072 |
| Fiber (g) | 12.9 (8.9 - 17.7) | 10.9 (7.0 - 15.2) | 12.8 (11.0 - 20.4) | 0.175 |
| NaCl (g) | 8.2 (5.8 - 10.5) | 7.3 (5.0 - 8.4) | 8.5 (6.2 - 9.1) | 0.836 |
| Systolic pressure (mm Hg) (n = 7) | 140 (120 - 145) | 130 (122 - 138) | 140 (128 - 152) | 0.565 |
| Diastolic pressure (mm Hg) (n = 7) | 70 (60 - 140) | 80 (70 - 122) | 80 (70 - 152) | 0.141 |