Journal of Clinical Medicine Research, ISSN 1918-3003 print, 1918-3011 online, Open Access
Article copyright, the authors; Journal compilation copyright, J Clin Med Res and Elmer Press Inc
Journal website http://www.jocmr.org

Original Article

Volume 9, Number 7, July 2017, pages 586-595


Ipragliflozin Improves Glycemic Control and Decreases Body Fat in Patients With Type 2 Diabetes Mellitus

Figure

Figure 1.
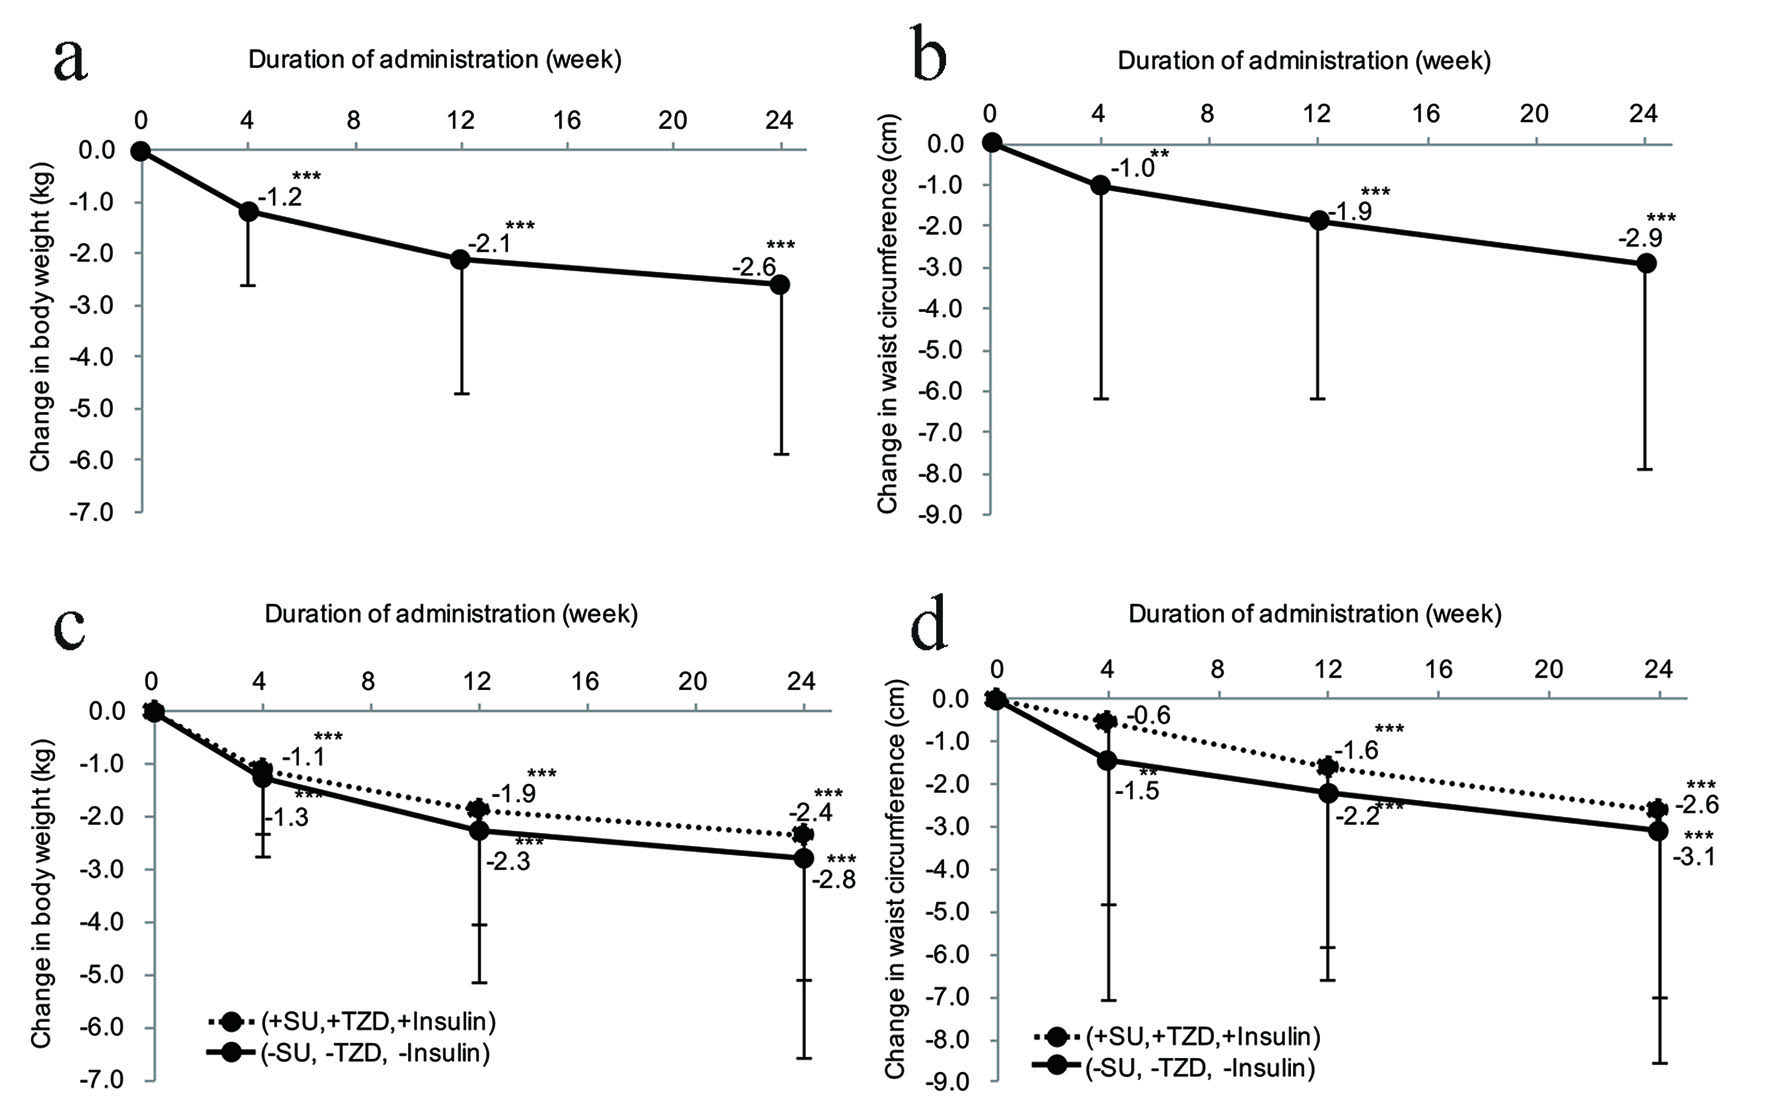
Figure 1. Effect of ipragliflozin on body weight and waist circumference. (a) Change in body weight after the start of ipragliflozin therapy (n = 295). (b) Change in waist circumference after the start of ipragliflozin therapy (n = 334). (c) Stratified analysis of the body weight changes in patients receiving ipragliflozin concomitantly with an SU, insulin, or TZD (n = 152) and patients receiving ipragliflozin without concomitant use of these drugs (n = 143). (d) Stratified analysis of the waist circumference changes in patients receiving ipragliflozin concomitantly with an SU, insulin, or TZD (n = 171) and patients receiving ipragliflozin without concomitant use of these drugs (n = 163). (e) Changes in body fat mass and fat-free body mass measured by a body composition analyzer from the start of ipragliflozin administration (body fat mass, n = 295; fat-free body mass, n = 295). (f) Changes in body composition measured by a body composition analyzer from the initiation of ipragliflozin treatment. Significant differences in week 4, week 12, and week 24 relative to the start of administration: ***P < 0.001; **P < 0.01; *P < 0.05, respectively. SU: sulfonylurea; TZD: thiazolidinedione.

Tables

Table 1. Baseline Characteristics of the Patients
 
n (%)Mean ± standard deviation
Gender
  Male234 (51.9)
  Female217 (48.1)
Age, years451 (100.0)55.5 ± 11.6
Body weight, kg451 (100.0)78.6 ± 16.8
Body mass index, kg/m2451 (100.0)29.4 ± 5.3
  < 2584 (18.6)
  ≥ 25 to < 30191 (42.4)
  ≥ 30176 (39.0)
Waist circumference, cm451 (100.0)99.8 ± 12.0
Duration of diabetes, years451 (100.0)9.6 ± 7.4
Complications of diabetes
  Diabetic nephropathy131 (29.0)
  Diabetic retinopathy62 (13.7)
  Diabetic neuropathy60 (13.3)
Concomitant diseases
  Dyslipidemia294 (65.2)
  Hypertension259 (57.4)
  Fatty liver218 (48.3)
  Cataract76 (16.9)
Prescribing status
  Naive79 (17.5)
  Concomitant use335 (74.3)
  Switching37 (8.2)
Concomitant antidiabetic therapy
  Dipeptidyl peptidase 4 inhibitor245 (73.1)
  Biguanide216 (64.5)
  Sulfonylurea123 (36.7)
  Insulin72 (21.5)
Thiazolidinedione46 (13.7)
  α-glucosidase inhibitor33 (9.9)
  Glinide16 (4.8)
  Glucagon-like peptide 1 analogue4 (1.2)
  Others26 (7.8)


Table 2. Changes in Glycemic Control Parameters from Initiation of Ipragliflozin Therapy
 
nWeek 0Week 4Week 12Week 24
Data are shown as the mean ± standard deviation. Analysis of variance vs. week 0, ***P < 0.001, **P < 0.01.
Hemoglobin A1c, %3748.07 ± 1.467.66 ± 1.22*** (-0.41 ± 0.60)7.31 ± 1.11*** (-0.76 ± 1.07)7.26 ± 1.05*** (-0.81 ± 1.11)
Fasting blood glucose, mg/dL114156.0 ± 44.6136.7 ± 36.8*** (-19.3 ± 37.7)132.2 ± 33.4*** (-23.8 ± 35.2)136.0 ± 33.2*** (-20.0 ± 38.0)
Postprandial blood glucose, mg/dL137184.7 ± 74.0156.9 ± 58.7*** (-27.8 ± 74.6)153.4 ± 62.6*** (-31.3 ± 70.9)147.3 ± 49.5*** (-37.4 ± 76.7)
Homeostatic model assessment of insulin resistance514.46 ± 3.693.14 ± 2.27** (-1.32 ± 2.83)3.16 ± 2.36*** (-1.30 ± 1.96)3.28 ± 2.70** (-1.18 ± 2.11)
Homeostatic model assessment of beta cell function5146.49 ± 44.6650.70 ± 44.66 (4.21 ± 26.69)52.94 ± 43.05 (6.45 ± 24.39)49.48 ± 43.55 (2.99 ± 20.15)
Insulin, μU/mL5112.65 ± 9.0611.82 ± 9.60 (-0.84 ± 7.69)13.89 ± 21.07 (1.24 ± 16.82)12.42 ± 13.60 (-0.23 ± 9.84)
C-peptide immunoreactivity, ng/mL513.123 ± 2.0603.348 ± 2.793 (0.224 ± 2.553)3.120 ± 2.283 (-0.004 ± 1.813)3.073 ± 2.026 (-0.050 ± 1.907)


Table 3. Changes in Body Composition after Initiation of Ipragliflozin Therapy
 
Week 0Week 4Week 12Week 24
n = 373. Data are shown as the mean ± standard deviation. Analysis of variance vs. week 0, ***P < 0.001, **P < 0.01, *P < 0.05.
Body weight, kg79.6 ± 16.678.4 ± 16.4*** (-1.2 ± 1.4)77.5 ± 16.2*** (-2.1 ± 2.6)77.0 ± 16.2*** (-2.6 ± 3.3)
Body fat mass, kg25.1 ± 8.924.4 ± 8.7*** (-0.7 ± 1.8)23.7 ± 8.6*** (-1.4 ± 2.2)23.2 ± 8.7*** (-1.9 ± 2.9)
Fat-free body mass, kg54.5 ± 10.954.0 ± 10.9*** (-0.5 ± 1.9)53.8 ± 10.9*** (-0.7 ± 2.5)53.8 ± 10.7*** (-0.6 ± 2.8)
Muscle mass, kg49.9 ± 10.149.5 ± 10.1*** (-0.4 ± 1.9)49.4 ± 10.1*** (-0.6 ± 2.4)49.4 ± 9.9** (-0.5 ± 2.6)
Body water mass, kg39.2 ± 7.838.8 ± 7.8*** (-0.4 ± 1.5)38.7 ± 7.9*** (-0.5 ± 1.9)38.7 ± 7.7*** (-0.5 ± 2.1)
Extracellular water mass, kg15.6 ± 3.215.3 ± 3.1*** (-0.3 ± 1.3)15.1 ± 3.2*** (-0.6 ± 1.5)15.1 ± 3.0*** (-0.5 ± 1.6)
Intracellular water mass, kg23.6 ± 4.923.6 ± 5.0 (-0.1 ± 1.6)23.7 ± 5.1 (0.0 ± 1.8)23.6 ± 5.0 (-0.0 ± 2.0)
Protein mass, kg10.7 ± 2.310.7 ± 2.3* (-0.1 ± 0.5)10.7 ± 2.3 (-0.1 ± 0.6)10.7 ± 2.2 (-0.1 ± 0.7)
Mineral mass, kg4.5 ± 0.94.5 ± 0.9*** (-0.1 ± 0.1)4.4 ± 0.9*** (-0.1 ± 0.2)4.4 ± 0.9*** (-0.1 ± 0.2)
Muscle mass (trunk), kg24.3 ± 4.924.1 ± 4.9*** (-0.2 ± 0.8)24.0 ± 4.9*** (-0.3 ± 1.0)24.0 ± 4.8*** (-0.3 ± 1.1)
Muscle mass (upper limbs), kg3.47 ± 0.753.45 ± 0.76 (-0.03 ± 0.20)3.44 ± 0.80 (-0.04 ± 0.34)3.44 ± 0.76 (-0.04 ± 0.30)
Muscle mass (lower limbs), kg9.36 ± 1.869.27 ± 1.86** (-0.09 ± 0.47)9.27 ± 1.88* (-0.09 ± 0.57)9.28 ± 1.84 (-0.08 ± 0.59)
Body mass index, kg/m229.6 ± 5.129.2 ± 5.0*** (-0.4 ± 0.5)28.9 ± 4.9*** (-0.8 ± 1.0)28.7 ± 4.9*** (-1.0 ± 1.2)
Body fat percentage, %31.1 ± 7.030.7 ± 7.1** (-0.4 ± 2.1)30.2 ± 7.2*** (-1.0 ± 2.4)29.6 ± 7.3*** (-1.5 ± 3.2)
Visceral fat/subcutaneous fat ratio, %0.436 ± 0.0420.433 ± 0.043** (-0.003 ± 0.017)0.428 ± 0.045*** (-0.008 ± 0.020)0.424 ± 0.048*** (-0.012 ± 0.026)


Table 4. Changes in Blood Pressure and Fasting Serum Lipids after Initiation of Ipragliflozin Therapy
 
nWeek 0Week 4Week 12Week 24
Data are shown as the mean ± standard deviation. Analysis of variance vs. week 0, ***P < 0.001, **P < 0.01, *P < 0.05.
Systolic blood pressure, mm Hg369133.1 ± 17.1127.9 ± 16.4*** (-5.1 ± 14.9)128.5 ± 16.5*** (-4.5 ± 16.1)128.2 ± 16.8*** (-4.9 ± 16.8)
Diastolic blood pressure, mm Hg36979.1 ± 10.976.5 ± 10.8*** (-2.6 ± 9.8)76.6 ± 11.1*** (-2.5 ± 10.0)76.8 ± 11.7*** (-2.3 ± 10.6)
Total cholesterol, mg/dL111201.4 ± 36.7197.9 ± 37.7 (-3.5 ± 25.0)201.6 ± 35.8 (0.2 ± 26.0)203.3 ± 38.9 (1.9 ± 29.0)
Low-density lipoprotein cholesterol, mg/dL100117.0 ± 29.9116.9 ± 31.9 (-0.1 ± 20.6)116.6 ± 29.3 (-0.3 ± 24.7)117.5 ± 31.6 (0.5 ± 26.7)
High-density lipoprotein cholesterol, mg/dL11252.6 ± 11.852.5 ± 11.5 (-0.2 ± 5.7)56.5 ± 18.8 (3.9 ± 16.6)57.7 ± 16.5*** (5.1 ± 12.3)
Triglycerides, mg/dL112164.1 ± 101.7145.6 ± 95.0* (-18.5 ± 65.1)140.8 ± 92.6** (-23.4 ± 76.3)136.8 ± 94.7*** (-27.3 ± 68.7)
Non-high-density lipoprotein cholesterol, mg/dL112148.8 ± 37.0145.4 ± 37.7 (-3.3 ± 23.4)145.1 ± 36.5 (-3.7 ± 28.4)145.6 ± 38.1 (-3.1 ± 30.0)
Free fatty acids, μEq/L112712.4 ± 259.1755.2 ± 253.1 (42.8 ± 239.8)719.1 ± 288.1 (6.7 ± 309.8)732.5 ± 287.2 (20.1 ± 253.3)


Table 5. Changes in Other Parameters after Initiation of Ipragliflozin Therapy
 
Week 0Week 4Week 12Week 24
n = 357. Results are shown as the mean ± standard deviation. Analysis of variance vs. week 0, ***P < 0.001, **P < 0.01, *P < 0.05.
Alanine aminotransferase, IU/L39.8 ± 30.336.6 ± 28.4** (-3.1 ± 15.9)32.8 ± 22.3*** (-7.0 ± 21.4)29.6 ± 18.7*** (-10.2 ± 22.9)
Aspartate transaminase, IU/L32.4 ± 24.730.5 ± 23.1** (-1.9 ± 10.5)27.7 ± 16.5*** (-4.7 ± 16.0)25.1 ± 11.8*** (-7.3 ± 20.1)
Lactate dehydrogenase, IU/L202.7 ± 41.7196.4 ± 40.9** (-6.3 ± 33.5)192.2 ± 35.8*** (-10.5 ± 34.7)190.7 ± 39.7*** (-12.0 ± 40.4)
γ-glutamyl transpeptidase, IU/L58.2 ± 60.049.4 ± 52.2*** (-8.9 ± 26.2)45.0 ± 42.6*** (-13.2 ± 38.4)42.5 ± 39.7*** (-15.7 ± 41.8)
Alkaline phosphatase, IU/L238.9 ± 82.1228.1 ± 73.7*** (-10.8 ± 40.4)227.5 ± 68.9*** (-11.4 ± 45.3)225.8 ± 64.5*** (-13.0 ± 49.9)
Blood urea nitrogen, mg/dL14.2 ± 4.415.1 ± 4.5*** (0.9 ± 3.2)15.3 ± 4.3*** (1.1 ± 3.4)15.7 ± 4.5*** (1.5 ± 3.6)
Serum creatinine, mg/dL0.71 ± 0.200.74 ± 0.22*** (0.03 ± 0.09)0.72 ± 0.21** (0.02 ± 0.08)0.73 ± 0.21** (0.02 ± 0.10)
Uric acid, mg/dL5.4 ± 1.24.9 ± 1.3*** (-0.4 ± 0.9)5.0 ± 1.2*** (-0.4 ± 0.8)4.9 ± 1.2*** (-0.4 ± 0.9)
Estimated glomerular filtration rate, mL/min/1.73 m284.0 ± 21.580.8 ± 21.9*** (-3.2 ± 10.2)82.4 ± 21.4* (-1.7 ± 10.4)82.3 ± 21.3* (-1.7 ± 10.8)
Hematocrit, %43.4 ± 4.144.5 ± 4.3*** (1.2 ± 1.9)45.4 ± 4.2*** (2.1 ± 2.4)45.5 ± 4.1*** (2.1 ± 2.5)
Na+, mEq/L140.50 ± 2.25140.80 ± 2.02* (0.30 ± 2.0)140.80 ± 1.88 (0.30 ± 2.1)140.70 ± 1.93 (0.20 ± 2.3)
K+, mEq/L4.12 ± 0.554.12 ± 0.51 (0.00 ± 0.43)4.18 ± 0.50 (0.06 ± 0.57)4.35 ± 0.54*** (0.23 ± 0.73)
Cl-, mEq/L102.3 ± 2.9102.8 ± 2.8** (0.5 ± 2.3)102.5 ± 2.6 (0.2 ± 2.5)102.5 ± 2.7 (0.2 ± 2.6)
Ca2+, mEq/L9.4 ± 0.49.4 ± 0.4 (0.0 ± 0.3)9.4 ± 0.4 (-0.0 ± 0.4)9.4 ± 0.4 (0.0 ± 0.3)
Pi, mg/dL3.3 ± 0.63.5 ± 0.6*** (0.2 ± 0.6)3.5 ± 0.7*** (0.2 ± 0.6)3.4 ± 0.6** (0.1 ± 0.6)
Blood ketone bodies, mmol/L0.30 ± 1.430.42 ± 2.04* (0.12 ± 0.65)0.43 ± 2.34 (0.14 ± 0.95)0.44 ± 2.69 (0.14 ± 1.27)