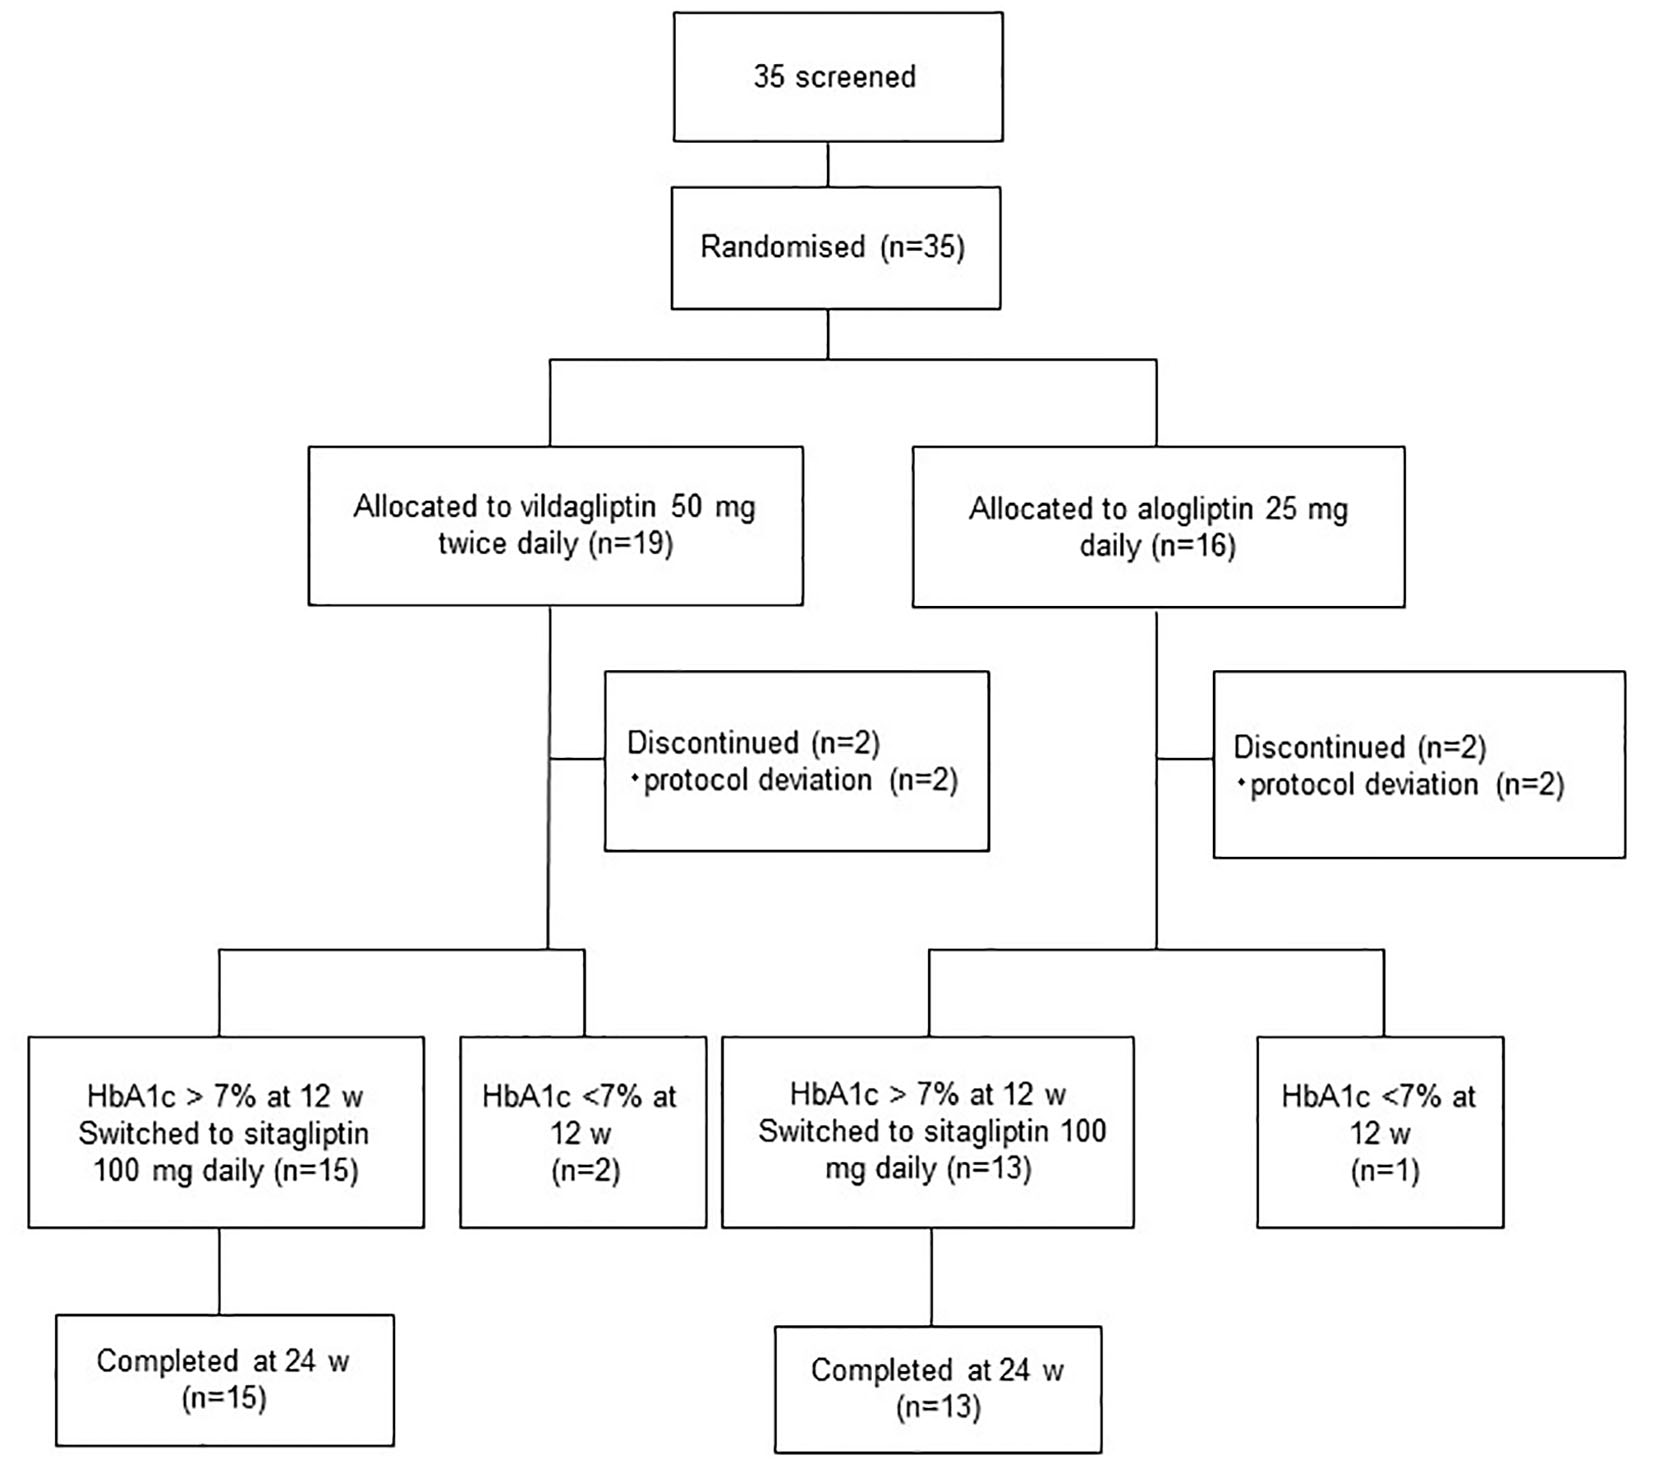
Figure 1. Assessment, randomization, and follow-up of the study patients.
| Journal of Clinical Medicine Research, ISSN 1918-3003 print, 1918-3011 online, Open Access |
| Article copyright, the authors; Journal compilation copyright, J Clin Med Res and Elmer Press Inc |
| Journal website http://www.jocmr.org |
Original Article
Volume 9, Number 7, July 2017, pages 567-572
A Randomized Controlled Trial of Vildagliptin Versus Alogliptin: Effective Switch From Sitagliptin in Patients With Type 2 Diabetes
Figure
Tables
| Vildagliptin | Alogliptin | |||||
|---|---|---|---|---|---|---|
| Baseline | 12 week | 24 week Vildagliptin → sitagliptin | Baseline | 12 week | 24 week Alogliptin → sitagliptin | |
| *P = 0.05, data compared with baseline values using the t-test. †P = 0.05, data compared with 12 weeks values using the t-test. | ||||||
| Age | 63.2 ± 13.5 | 65.1 ± 12.0 | 60.4 ± 12.9 | |||
| Male | 10 | 9 | ||||
| Female | 9 | 7 | ||||
| Height (cm) | 162.8 ± 10.1 | 159.3 ± 9.5 | ||||
| Weight (kg) | 65.4 ± 13.3 | 68.6 ± 13.2 | 67.2 ± 16.3 | 59.4 ± 11.2 | 60.4 ± 12.9 | 60.2 ± 12.1 |
| BMI (kg/m2) | 24.6 ± 4.4 | 23.1 ± 3.5 | ||||
| PG (mg/dL) | 175.5 ± 54.4 | 179.1 ± 73.4 | 172.2 ± 54.5 | 175.4 ± 50.9 | 195.3 ± 55.0 | 189.3 ± 32.4 |
| HbA1c (%) | 8.0 ± 0.5 | 8.0 ± 0.8 | 8.3 ± 0.7 | 8.0 ± 0.5 | 8.31 ± 0.7* | 8.0 ± 0.8† |
| Alogliptin (N = 16) | Vildagliptin (N = 19) | P value | |
|---|---|---|---|
| Proportion of patients who achieved HbA1c < 7.0% at 12 weeks | 1 (6.3%) | 2 (10.5%) | 1.000 |
| Proportion of patients who achieved PG < 130 mg/dL at 12 weeks | 1 (6.3) | 7 (36.8%) | 0.047 |
| Change to sitagliptin | 13 (81.2%) | 15 (78.9%) | |
| Proportion of patients who achieved HbA1c < 7.0% at 24 weeks | 3 (9.1%) | ||
| Proportion of patients who achieved PG < 130 mg/dL at 24 weeks | 1 (3.0%) | ||