Journal of Clinical Medicine Research, ISSN 1918-3003 print, 1918-3011 online, Open Access
Article copyright, the authors; Journal compilation copyright, J Clin Med Res and Elmer Press Inc
Journal website http://www.jocmr.org

Letter to the Editor

Volume 9, Number 5, May 2017, pages 446-448


What Properties of Sodium-Glucose Cotransporter 2 Inhibitors Determine the Improvement in Hemoglobin A1c and Body Weight?

Figure

Figure 1.
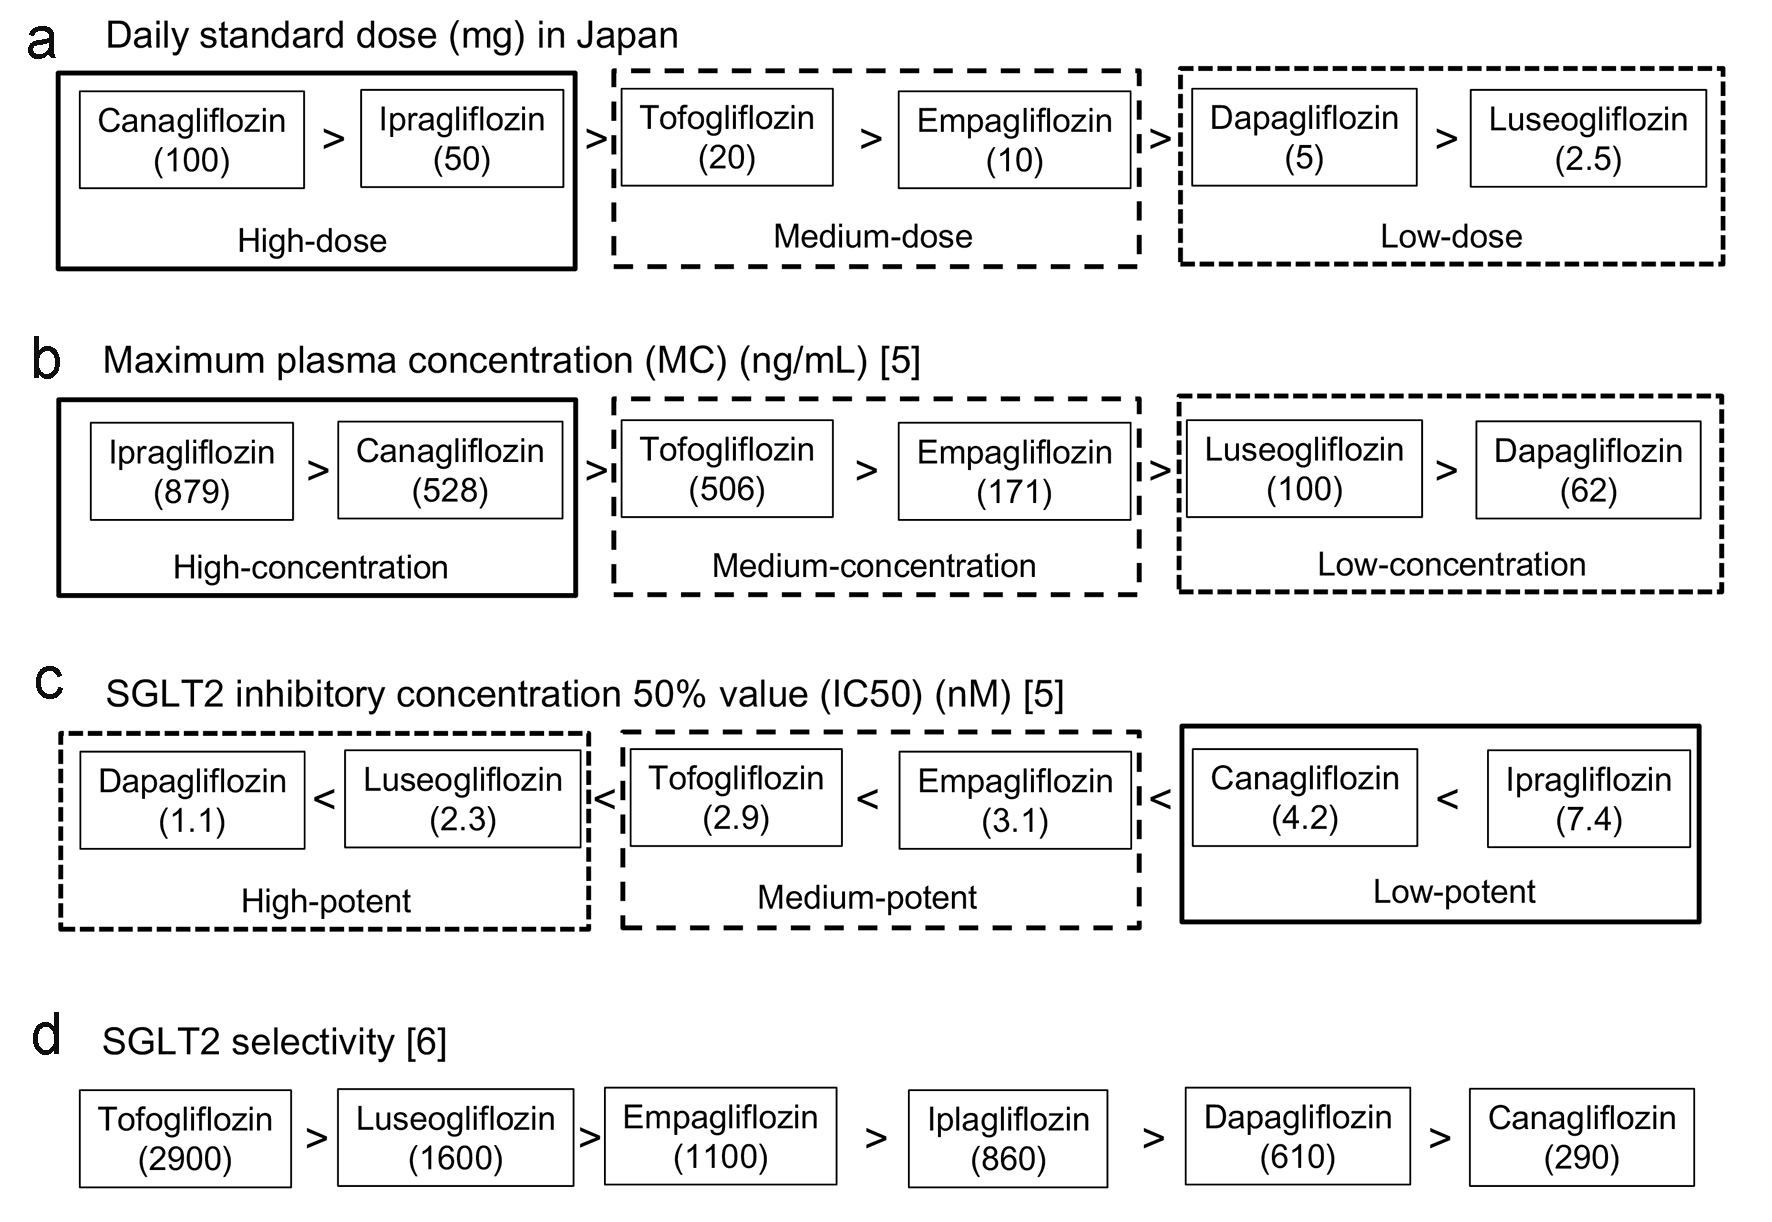
Figure 1. Daily standard dose (a), maximum plasma concentration (b), SGLT2 inhibitory concentration 50% value (c) and SGLT2 selectivity (d) of each SGLT2i. The data in (a) were obtained by the interview form of each SGLT2i produced in Japan, data in (b) and (c) were obtained from the article by Nishiyama et al [5], and data in (d) were obtained from the article by Suzuki et al [6].

Tables

Table 1. Changes in HbA1c and Body Weight in Patients With Type 2 Diabetes
 
SGLT2 inhibitorsChanges in HbA1c (%)Changes in HbA1c in patients with moderate renal insufficiency after 24 weeksChanges in body weight (kg)
After 12 weeksAfter 24 weeksneGFR (mL/min/1.73 m2)Daily dose (mg)ΔHbA1c (%)After 12 weeksAfter 24 weeks
Dapagliflozin-0.37-0.414130 ≤ eGFR < 455-0.47-2.06-2.13
3545 ≤ eGFR < 605-0.47
Empagliflozin-0.4-0.659630 ≤ eGFR < 4525-0.21-1.7-1.93
9145 ≤ eGFR < 6025-0.54
Canagliflozin-0.8-0.74245 ≤ eGFR < 60100-0.79-2.53-2.6
Ipragliflozin-0.7-0.875830 ≤ eGFR < 6050-0.28-1.42-2.38
Luseogliflozin-0.39-0.639530 ≤ eGFR < 602.5-0.11-1.31-2.7
Tofogliflozin-0.77-1.023030 ≤ eGFR < 6020-0.24Not determined-2.72


Table 2. Correlation Between Changes in HbA1c and Body Weight by SGLT2i and Pharmacokinetic Parameters of SGLT2i
 
Changes in HbA1c after 12 weeksChanges in HbA1c after 24 weeksChanges in body weight after 12 weeksChanges in body weight after 24 weeksChanges in HbA1c after 12 weeks in patients with moderate renal insufficiency
rP valuerP valuerP valuerP valuerP value
Changes in HbA1c after 12 weeks--0.8050.0530.4270.4730.5620.2460.3530.492
Changes in HbA1c after 24 weeks0.8050.053---0.210.7350.5460.262-0.2080.693
Changes in body weight after 12 weeks0.4270.473-0.210.735---0.0240.9690.9770.004
Changes in body weight after 24 weeks0.5620.2460.5460.262-0.0240.969---0.160.762
Changes in HbA1c after 12 weeks in patients with moderate renal insufficiency0.3530.492-0.2080.6930.9770.004-0.160.762--
Maximal plasma concentration (MC)-0.8340.039-0.7550.0830.0080.99-0.310.55-0.1120.833
SGLT2 inhibitory concentration 50% (IC50)-0.590.218-0.570.2380.2030.744-0.0990.853-0.0360.945
IC50 adjusted by the lowest potency (potency)0.6390.1720.7550.083-0.1750.7780.3080.552-0.0160.977
MC × potency-0.9310.007-0.8650.026-0.4220.479-0.530.279-0.1620.76
Area under the blood concentration time curve (AUC) (ng × h/mL)-0.8180.047-0.5120.299-0.3350.581-0.330.523-0.5060.306
Selectivity-0.1560.768-0.6050.2030.8760.051-0.4590.360.6690.146