Journal of Clinical Medicine Research, ISSN 1918-3003 print, 1918-3011 online, Open Access
Article copyright, the authors; Journal compilation copyright, J Clin Med Res and Elmer Press Inc
Journal website http://www.jocmr.org

Original Article

Volume 9, Number 7, July 2017, pages 560-566


Variables to Predict Nephrological Disease in General, and Glomerulonephritis in Particular, in Patients With Microhematuria

Figure

Figure 1.
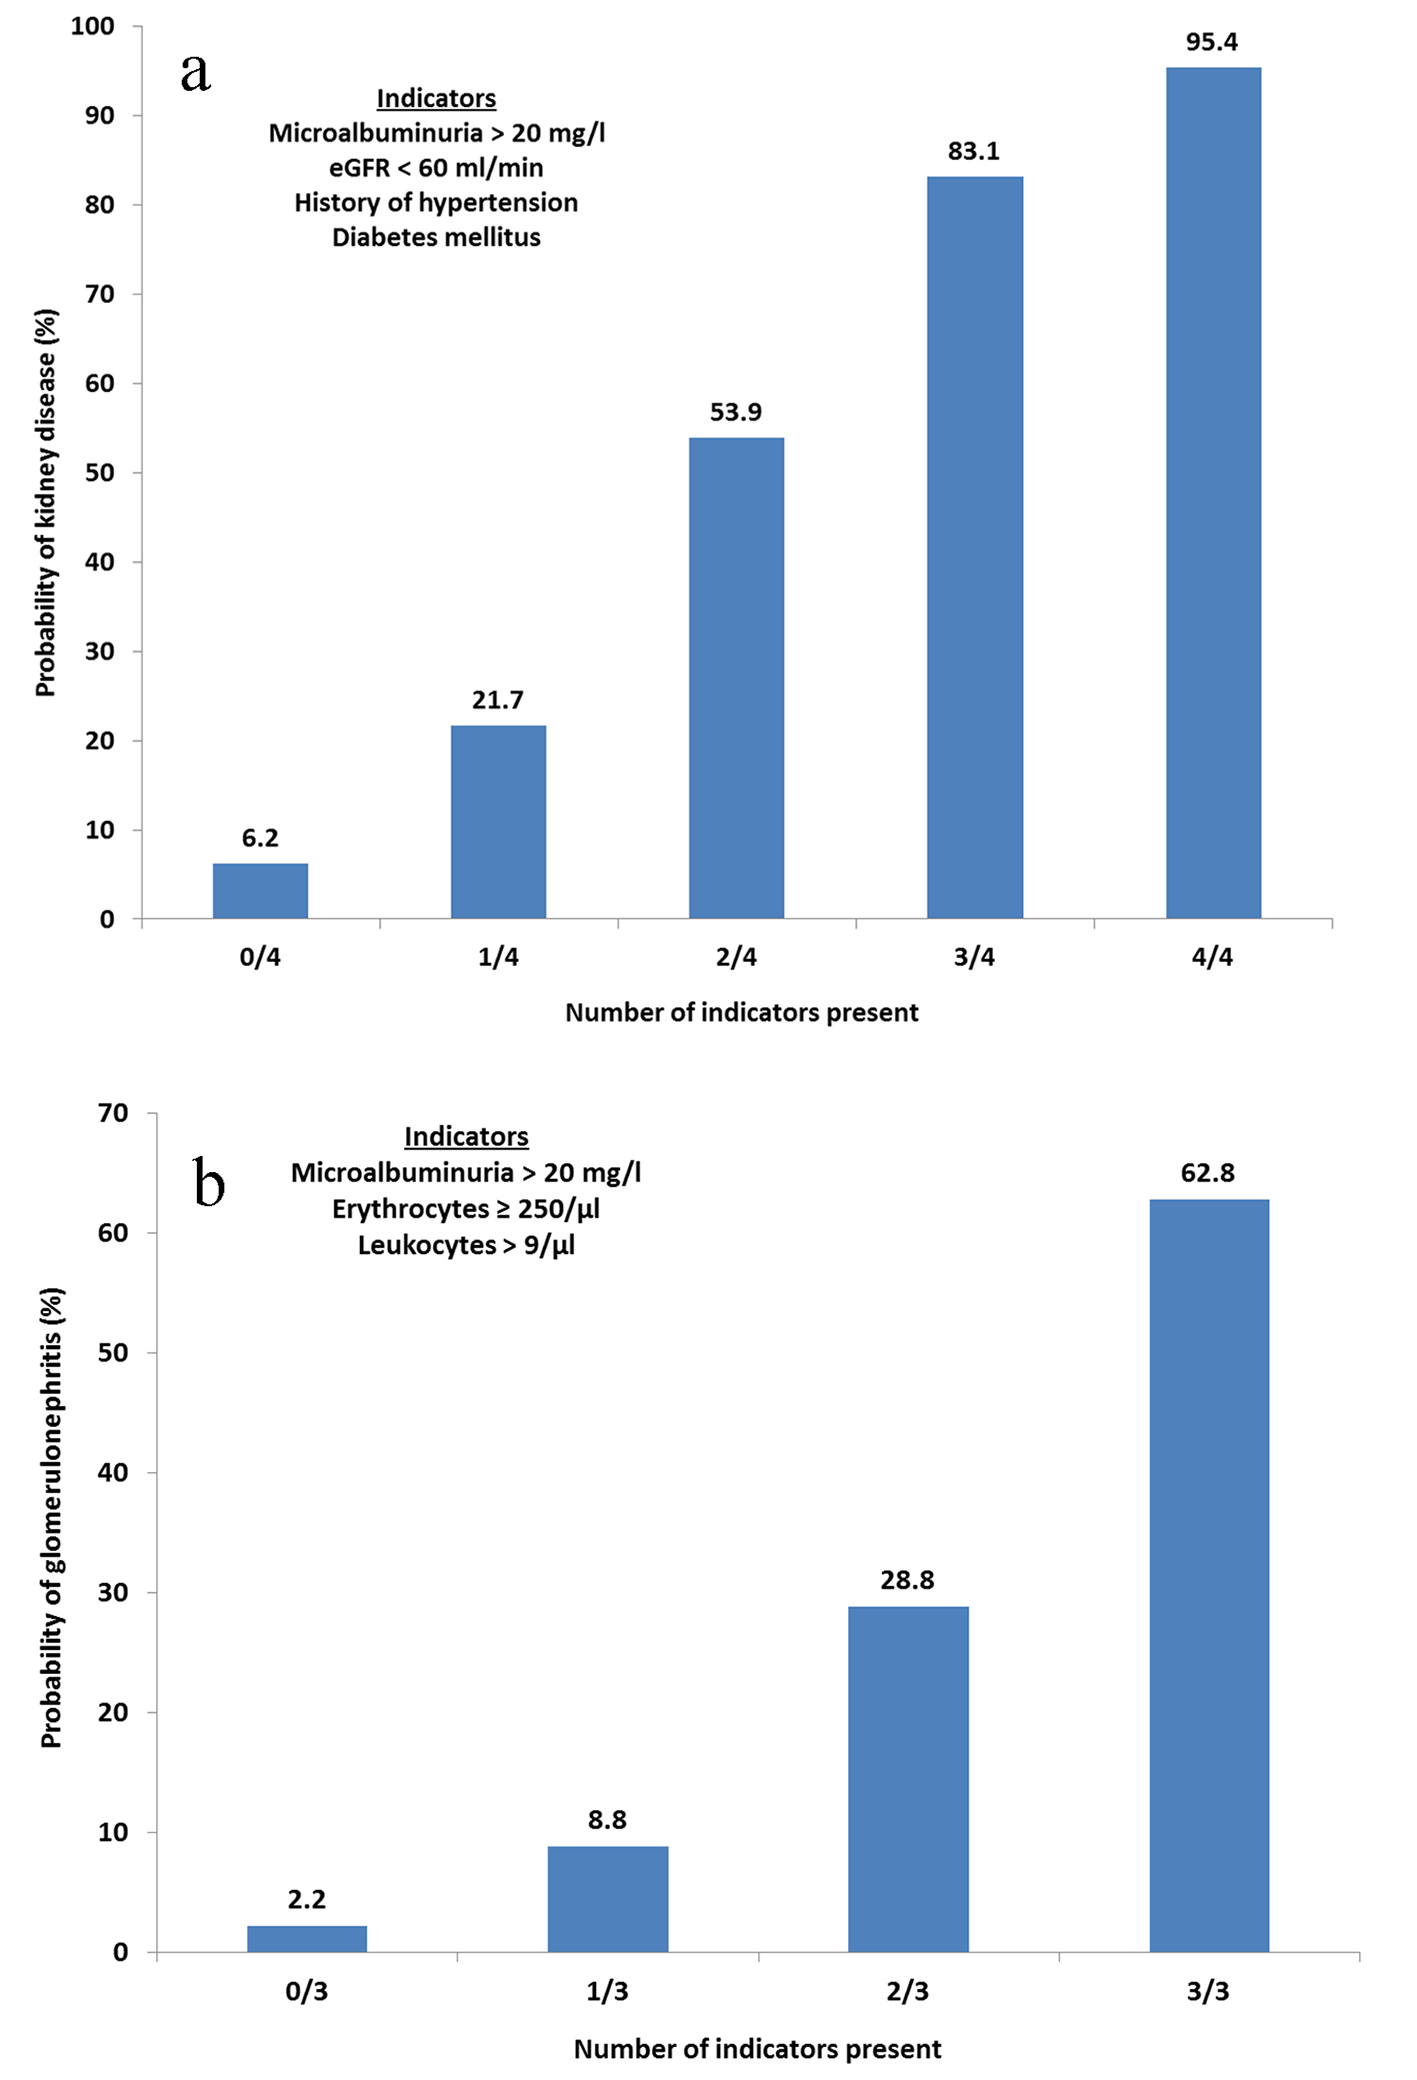
Figure 1. (a) Probability of kidney disease based on clinical findings. Calculated probabilities of kidney disease based on factors found to be significant in the multivariate logistic regression. Any combination of indicators can be present. eGFR, estimated glomerular filtration rate. (b) Probability of glomerulonephritis based on clinical findings. Calculated probabilities of glomerulonephritis based on factors found to be significant in the multivariate logistic regression. Any combination of indicators can be present. Erythrocyte concentration determined by urine stick analysis.

Tables

Table 1. Patient Characteristics
 
Mean ± SD (range) or n/N (%)
Epidemiological data were taken from the whole cohort (N = 805), whereas the other data (N = 543) were taken only from patients with confirmed MH (≥ 3 erythrocytes per high power field of view in urine sediment analysis). BMI: body mass index; CV: cardiovascular; SBP: systolic blood pressure; DBP: diastolic blood pressure; eGFR: estimated glomerular filtration rate.
Epidemiology (N = 805)
  Age (years)56.3 ± 18.1 (6 - 91)
  Patients ≥ 40 years665/805 (82.6%)
  Sex (male)389/805 (48.3%)
  BMI (kg/m2)27.8 ± 6.0 (12.6 - 64.7)
CV risk factors (N = 543)
  SBP (mm Hg)144.7 ± 23.5 (90 - 227)
  DBP (mm Hg)82.4 ± 14.4 (50 - 145)
  History of arterial hypertension359/543 (66.1%)
  Diabetes mellitus, type 1 or 286/543 (15.8%)
  Hyperlipidemia178/543 (32.8%)
  Current smoker132/543 (24.3%)
Kidney function (N = 543)
  eGFR (mL/min)62.1 ± 34.1 (2 - 186)
  eGFR < 90 mL/min375/502 (74.1%)
  eGFR < 60 mL/min236/502 (47.1%)
  Microalbuminuria > 20 mg/L255/372 (68.5%)
Signs of urinary tract infection (N = 543)
  Leukocytes in urine test strip ≥ 25/μL229/543 (42.2%)
  Nitrite in urine37/543 (6.8%)
  Chronic infection of the urinary tract53/543 (9.8%)


Table 2. Characteristics of Hematuria
 
n/N (%)
Data from the urine test strip analysis were collected at the first visit to the nephrologist (N = 805). Confirmed hematuria is defined as patients that had ≥ 3 erythrocytes per high power field of view in urine sediment analysis.
Erythrocytes in urine stick analysis (per μL)
  < 1078/805 (9.7%)
  ≥ 10 - 49371/805 (46.1%)
  ≥ 50 - 249188/805 (23.4%)
  ≥ 250167/805 (20.8%)
Macroscopic hematuria37/805 (4.6%)
Chronic hematuria20/805 (2.5%)
Confirmed MH (urine sediment)543/805 (67.5%)


Table 3. Potential Sources of MH Identified in the Nephrology Office (Multiple Selections Are Possible)
 
n/N (%)
NOAC: non-vitamin-K oral anticoagulant; NSAID: non-steroidal anti-inflammatory drug. *Includes multiple myeloma and renal amyloidosis; multiple myeloma; scleroderma; and suspected or non-proven glomerulonephritis. #Thrombocytopenia, increased INR, or elevated prothrombin time. Includes aspirin, clopidogrel, dipyridamol, ticlopidine. CRP > 5 mg/L or ESR > 20 mm/h or leukocytes > 10/nL.
Nephrological disease (all)262/543 (48.3%)
  Glomerulonephritis (all)68/543 (12.4%)
  Rapid progressive glomerulonephritis16/543 (2.9%)
  Interstitial nephritis33/543 (6.1%)
  Congenital kidney disease15/543 (2.8%)
  Diabetic nephropathy51/543 (9.4%)
  Hypertensive nephropathy144/543 (26.5%)
  Other kidney diseases*16/543 (2.9%)
Urological source113/543 (20.8%)
  Infection of the urinary tract55/543 (10.1%)
  Pyelonephritis10/543 (1.8%)
Coagulation abnormality#64/541 (11.8%)
Vitamin K antagonist/NOAC use44/543 (8.1%)
Anti-platelet drug use97/543 (17.9%)
NSAID use66/543 (12.2%)
Systemic inflammation124/543 (22.8%)
Number of potential sources of MH
  1147/543 (27.1%)
  2127/543 (23.4%)
  376/543 (14.0%)
  419/543 (3.5%)
Unclear diagnosis, benign MH174/543 (32.0%)


Table 4. Relationship Between MH and Renal Disease
 
Renal disease (all) (N = 262)Glomerulonephritis (N = 68)
OR (95% CI), univariateP-valueOR (95% CI), multivariate*P-valueOR (95% CI), univariateP-valueOR (95% CI), multivariate#P-value
OR: odds ratio; BMI: body mass index; eGFR: estimated glomerular filtration rate; CRP: C-reactive protein; ESR: erythrocyte sedimentation rate. A P-value of < 0.05 was considered to be significant. *Variables entered in the multivariate analysis “Renal Disease (all)” were age > 40 years, male sex, BMI > 30 kg/m2, GFR < 90 mL/min, history of hypertension, diabetes mellitus type 1 and 2, microalbuminuria > 20 mg/L); other variables were not included owing to low numbers of patients. #Variables entered in the multivariate analysis “Glomerulonephritis” were erythrocytes in the urine test strip ≥ 250/µL, age > 40 years, male sex, microalbuminuria > 20 mg/L), and severe systemic inflammation; other variables were not included owing to low numbers of patients. Systemic inflammation: CRP > 5 mg/L or ESR > 20 mm/h or leukocytes > 10/nL. Severe systemic inflammation: CRP > 50 mg/L or ESR > 75/h or leukocytes > 15/nL.
Erythrocytes in urine test strip analysis (per μL)
  < 100.88 (0.54 - 1.42)0.610.97 (0.45 - 2.07)0.940.47 (0.15 - 1.06)0.100.47 (0.06 - 1.66)0.30
  10 - 491.18 (0.82 - 1.71)0.371.28 (0.68 - 2.47)0.440.43 (0.20 - 0.80)0.0121.15 (0.39 - 3.06)0.78
  50 - 2490.63 (0.42 - 0.92)0.0170.71 (0.38 - 1.27)0.250.62 (0.31 - 1.14)0.141.46 (0.55 - 3.98)0.44
  ≥ 2501.42 (0.98 - 2.07)0.0671.18 (0.63 - 2.22)0.615.09 (2.44 - 7.00)< 0.0013.49 (1.75 - 7.32)< 0.001
Epidemiological data
  Age ≥ 40 years2.64 (1.69 - 4.27)< 0.0010.55 (0.25 - 1.17)0.130.74 (0.41 - 1.41)0.320.55 (0.24 - 1.33)0.16
  Male sex1.94 (1.38 - 2.74)< 0.0011.22 (0.69 - 2.16)0.483.24 (1.87 - 6.05)< 0.0012.01 (0.94 - 4.91)0.082
  BMI > 30 kg/m21.91 (1.29 - 2.86)0.0011.81 (0.96 - 3.57)0.0720.68 (0.33 - 1.24)0.230.88 (0.33 - 2.01)0.77
Blood pressure
  History of hypertension6.03 (4.03 - 9.30)< 0.0014.10 (2.23 - 8.02)< 0.0011.25 (0.73 - 2.25)0.431.09 (0.50 - 2.59)0.84
  Hypertension (> 140/90 mm Hg)2.73 (1.92 - 3.91)< 0.0011.43 (0.78 - 2.67)0.251.15 (0.69 - 1.94)0.591.10 (0.54 - 2.33)0.79
Kidney function
  eGFR < 90 mL/min3.61 (2.34 - 5.66)< 0.0011.91 (1.01 - 3.64)0.0471.25 (0.70 - 2.42)0.470.82 (0.37 - 1.93)0.62
  eGFR < 60 mL/min7.50 (5.07 - 11.3)< 0.0015.38 (3.17 - 9.66)< 0.0011.50 (0.90 - 2.54)0.121.05 (0.52 - 2.15)0.88
  Microalbuminuria > 20 mg/L (=A2)5.38 (3.45 - 8.63)< 0.0013.90 (2.27 - 7.03)< 0.0016.79 (2.93 - 21.8)< 0.0015.93 (2.42 - 20.3)< 0.001
Further risk factors
  Current smoker0.79 (0.53 - 1.17)0.251.55 (0.83 - 3.01)0.170.80 (0.41 - 1.45)0.480.46 (0.16 - 1.06)0.083
  Diabetes mellitus5.43 (3.18 - 10.0)< 0.0012.76 (1.24 - 7.06)0.0170.42 (0.13 - 1.04)0.0610.47 (0.12 - 1.28)0.18
Systemic inflammation
  CRP > 5 mg/L2.32 (1.34 - 4.09)0.0031.14 (0.48 - 2.59)0.761.84 (0.87 - 3.98)0.111.06 (0.39 - 2.77)0.90
  Leukocytes > 10/nL1.46 (0.93 - 2.33)0.112.46 (1.18 - 5.56)0.0192.31 (1.28 - 4.02)0.0043.97 (1.77 - 9.19)< 0.001