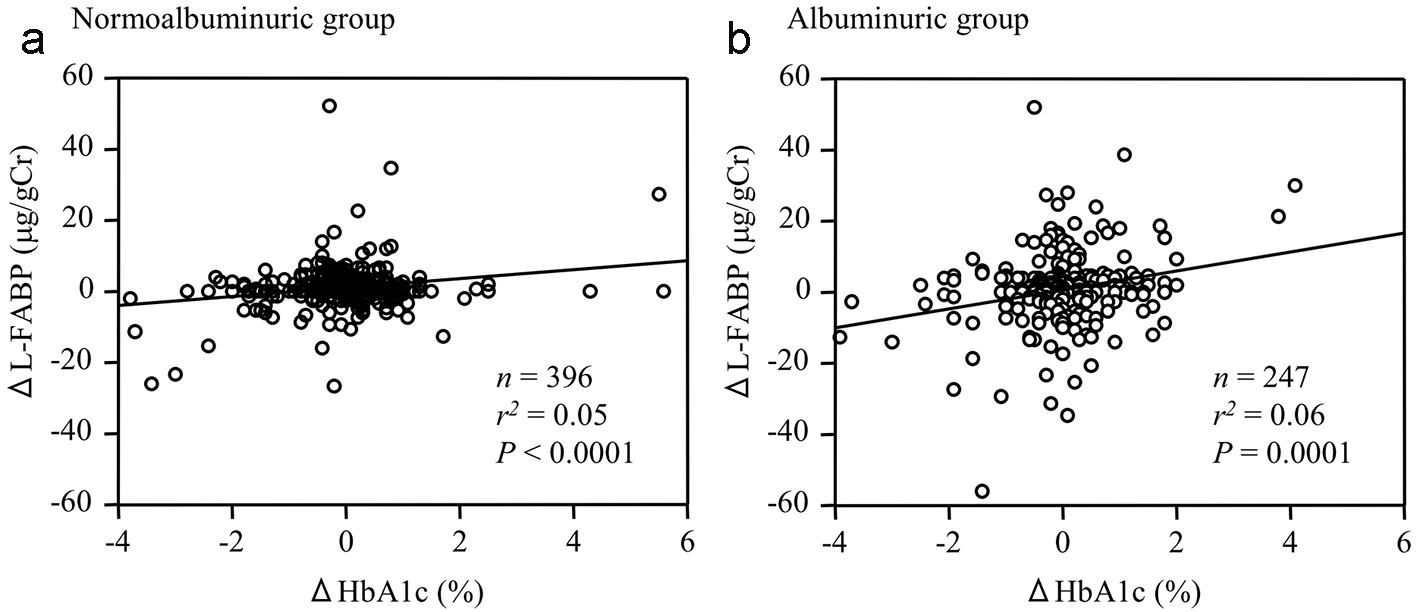
Figure 1. The relationship between the changes in urinary L-FABP (ΔL-FABP) and HbA1c level (ΔHbA1c) during the 6-month observation period among (a) normoalbuminuric and (b) albuminuric patients with type 2 diabetes.
| Journal of Clinical Medicine Research, ISSN 1918-3003 print, 1918-3011 online, Open Access |
| Article copyright, the authors; Journal compilation copyright, J Clin Med Res and Elmer Press Inc |
| Journal website http://www.jocmr.org |
Original Article
Volume 9, Number 4, April 2017, pages 366-373
Current Metabolic Status Affects Urinary Liver-Type Fatty-Acid Binding Protein in Normoalbuminuric Patients With Type 2 Diabetes
Figure
Tables
| Mean ± SD/% | Number estimated | |
|---|---|---|
| DPP-4: dipeptidyl peptidase-4; RAS: renin-angiotensin system; ACR: albumin-to-creatinine ratio; ABI: ankle-brachial pressure index; baPWV: brachial-ankle pulse wave velocity; cIMT: carotid intima-media thickness. | ||
| Age (years) | 66 ± 12 | 788 |
| Male (%) | 58 | 788 |
| Duration of diabetes (years) | 12 ± 10 | 745 |
| History of smoking (%) | 61 | 452 |
| Body mass index (kg/m2) | 25.3 ± 4.5 | 675 |
| Medication | 788 | |
| Insulin use (%) | 24 | |
| Biguanides use (%) | 33 | |
| Sulfonylureas use (%) | 8 | |
| DPP-4 inhibitors use (%) | 27 | |
| RAS inhibitors use (%) | 54 | |
| Calcium channel blockers use (%) | 41 | |
| Statin use (%) | 59 | |
| Systolic blood pressure (mm Hg) | 131 ± 16 | 780 |
| Diastolic blood pressure (mm Hg) | 75 ± 12 | 779 |
| Hypertension (%) | 74 | 786 |
| HbA1c (%) | 7.4 ± 1.3 | 755 |
| HbA1c ≥ 7% (%) | 60 | 755 |
| eGFR (mL/min/1.73 m2) | 71 ± 24 | 788 |
| Urinary ACR (mg/gCr) | 126 ± 334 | 788 |
| Albuminuria (%) | 41 | 788 |
| Serum uric acid (μmol/L) | 307 ± 73 | 788 |
| Hyperuricemia (%) | 18 | 788 |
| HDL-cholesterol (mmol/L) | 1.36 ± 0.38 | 787 |
| LDL-cholesterol (mmol/L) | 2.45 ± 0.75 | 788 |
| Hyper LDL-cholesterolemia (%) | 63 | 788 |
| ABI | 1.12 ± 0.11 | 555 |
| baPWV (cm/s) | 1,742 ± 380 | 526 |
| cIMT (mm) | 1.02 ± 0.23 | 253 |
| Diabetic retinopathy (%) | 31 | 754 |
| Diabetic peripheral neuropathy (%) | 46 | 585 |
| Cerebrovascular disease (%) | 12 | 788 |
| Coronary heart disease (%) | 22 | 788 |
| Peripheral artery disease (%) | 4 | 788 |
| Urinary L-FABP (μg/gCr) | 6.6 ± 16.8 | 788 |
| High urinary L-FABP (%) | 18 | 788 |
| Normoalbuminuric group | Albuminuric group | |||||
|---|---|---|---|---|---|---|
| High L-FABP (n = 36) | Normal L-FABP (n = 430) | P | High L-FABP (n = 107) | Normal L-FABP (n = 215) | P | |
| DPP-4: dipeptidyl peptidase-4; RAS: renin-angiotensin system; ACR: albumin-to-creatinine ratio; ABI: ankle-brachial pressure index; baPWV: brachial-ankle pulse wave velocity; cIMT: carotid intima-media thickness. | ||||||
| Age (years) | 68 ± 10 | 64 ± 12 | 0.08 | 71 ± 10 | 67 ± 13 | < 0.01 |
| Male (%) | 61 | 54 | 0.44 | 66 | 60 | 0.30 |
| Duration of diabetes (years) | 9 ± 8 | 11 ± 9 | 0.46 | 18 ± 12 | 12 ± 10 | < 0.01 |
| Smoking history (%) | 70 | 58 | 0.27 | 83 | 58 | 0.04 |
| Body mass index (kg/m2) | 25.0 ± 4.5 | 25.3 ± 4.3 | 0.48 | 24.8 ± 4.8 | 25.7 ± 4.7 | 0.07 |
| Medication | ||||||
| Insulin use (%) | 22 | 20 | 0.70 | 33 | 28 | 0.42 |
| Biguanides use (%) | 19 | 37 | 0.03 | 20 | 34 | < 0.01 |
| Sulfonylureas use (%) | 6 | 7 | 0.74 | 6 | 11 | 0.17 |
| DPP-4 inhibitors use (%) | 17 | 24 | 0.29 | 37 | 29 | 0.15 |
| RAS inhibitors use (%) | 50 | 49 | 0.94 | 70 | 56 | 0.01 |
| Calcium channel blockers use (%) | 44 | 34 | 0.23 | 61 | 43 | < 0.01 |
| Statin use (%) | 50 | 62 | 0.17 | 57 | 55 | 0.72 |
| Systolic blood pressure (mm Hg) | 135 ± 20 | 128 ± 15 | 0.08 | 137 ± 16 | 132 ± 16 | < 0.01 |
| Diastolic blood pressure (mm Hg) | 77 ± 15 | 75 ± 11 | 0.67 | 75 ± 14 | 75 ± 12 | 0.97 |
| Hypertension (%) | 77 | 68 | 0.23 | 91 | 77 | < 0.01 |
| HbA1c (%) | 7.9 ± 1.6 | 7.3 ± 1.2 | 0.01 | 7.8 ± 1.7 | 7.5 ± 1.2 | 0.18 |
| HbA1c ≥ 7% (%) | 78 | 56 | < 0.01 | 68 | 63 | 0.34 |
| eGFR (mL/min/1.73 m2) | 69 ± 22 | 75 ± 20 | 0.09 | 53 ± 29 | 72 ± 22 | < 0.01 |
| Urinary ACR (mg/gCr) | 12 ± 7 | 12 ± 7 | 0.48 | 598 ± 752 | 167 ± 251 | < 0.01 |
| Serum uric acid (μmol/L) | 282 ± 73 | 303 ± 72 | 0.07 | 316 ± 77 | 315 ± 74 | 0.92 |
| Hyperuricemia (%) | 19 | 14 | 0.36 | 35 | 19 | < 0.01 |
| HDL-cholesterol (mmol/L) | 1.34 ± 0.35 | 1.37 ± 0.38 | 0.81 | 1.25 ± 0.33 | 1.39 ± 0.40 | < 0.01 |
| LDL-cholesterol (mmol/L) | 2.63 ± 1.03 | 2.42 ± 0.70 | 0.33 | 2.40 ± 0.78 | 2.51 ± 0.76 | 0.18 |
| Hyper LDL-cholesterolemia (%) | 58 | 65 | 0.45 | 59 | 62 | 0.61 |
| ABI | 1.13 ± 0.09 | 1.13 ± 0.09 | 0.70 | 1.08 ± 0.14 | 1.12 ± 0.11 | 0.07 |
| baPWV (cm/s) | 1,811 ± 515 | 1,664 ± 342 | 0.22 | 1,886 ± 367 | 1,805 ± 402 | 0.05 |
| cIMT (mm) | 1.00 ± 0.23 | 0.99 ± 0.25 | 0.90 | 1.07 ± 0.19 | 1.03 ± 0.22 | 0.33 |
| Diabetic retinopathy (%) | 24 | 23 | 1.00 | 54 | 38 | < 0.01 |
| Diabetic peripheral neuropathy (%) | 48 | 37 | 0.25 | 75 | 49 | < 0.01 |
| Cerebrovascular disease (%) | 17 | 11 | 0.30 | 20 | 11 | 0.03 |
| Coronary heart disease (%) | 19 | 18 | 0.87 | 33 | 23 | 0.07 |
| Peripheral artery disease (%) | 3 | 3 | 1.00 | 12 | 3 | < 0.01 |
| Wald χ2 score | OR (95% CI) | P | |
|---|---|---|---|
| RAS: renin-angiotensin system; ACR: albumin-to-creatinine ratio; OR: odds ratio; CI: confidential interval. | |||
| Normoalbuminuric group | |||
| Biguanides use (%) | 3.23 | 0.44 (0.17 - 1.02) | 0.06 |
| Systolic blood pressure (mm Hg) | 7.60 | 1.03 (1.01 - 1.05) | < 0.01 |
| HbA1c (%) | 8.45 | 1.42 (1.11 - 1.79) | < 0.01 |
| eGFR (mL/min/1.73 m2) | 6.18 | 0.98 (0.96 - 1.00) | 0.01 |
| Albuminuric group | |||
| RAS inhibitors use (%) | 5.38 | 2.22 (1.16 - 4.89) | 0.02 |
| Urinary ACR (mg/gCr) | 22.69 | 1.01 (1.00 - 1.01) | < 0.01 |
| HDL-cholesterol (mmol/L) | 4.47 | 0.33 (0.11 - 0.89) | 0.03 |
| Normoalbuminuric group | Albuminuric group | |||||||
|---|---|---|---|---|---|---|---|---|
| n | 0 month | 6 months | P | n | 0 month | 6 months | P | |
| Urinary L-FABP (μg/gCr) | 404 | 2.2 ± 5.0 | 3.3 ± 6.0 | < 0.01 | 262 | 10.9 ± 22.3 | 11.2 ± 20.0 | 0.09 |
| Systolic blood pressure (mm Hg) | 400 | 129 ± 15 | 129 ± 15 | 0.97 | 259 | 133 ± 15 | 132 ± 15 | 0.27 |
| HbA1c (%) | 396 | 7.4 ± 1.2 | 7.3 ± 1.3 | 0.12 | 247 | 7.6 ± 1.3 | 7.6 ± 1.3 | 0.39 |
| eGFR (mL/min/1.73 m2) | 403 | 74 ± 20 | 75 ± 21 | 0.99 | 260 | 68 ± 25 | 66 ± 25 | < 0.01 |
| HDL-cholesterol (mmol/L) | 102 | 1.38 ± 0.38 | 1.35 ± 0.36 | 0.50 | 87 | 1.36 ± 0.36 | 1.31 ± 0.34 | 0.25 |