| Demographic parameters | | | |
| Age, years | 50.0 (46.0 - 56.0) | 53.0 (49.5 - 57.0) | < 0.01 |
| Current smoker, % | 39.7 | 5.6 | < 0.01 |
| BMI, kg/m2 | 24.7 (23.2 - 26.6) | 23.2 (21.9 - 26.0) | 0.15 |
| Waist circumference, cm | 88.4 (83.0 - 92.0) | 80.5 (74.3 - 88.0) | < 0.01 |
| Blood pressure | | | |
| Systolic blood pressure, mm Hg | 130.0 (118.0 - 140.0) | 131.5 (120.0 - 140.0) | 0.76 |
| Diastolic blood pressure, mm Hg | 80.0 (74.0 - 89.0) | 80.0 (72.0 - 86.0) | 0.24 |
| Metabolic parameters | | | |
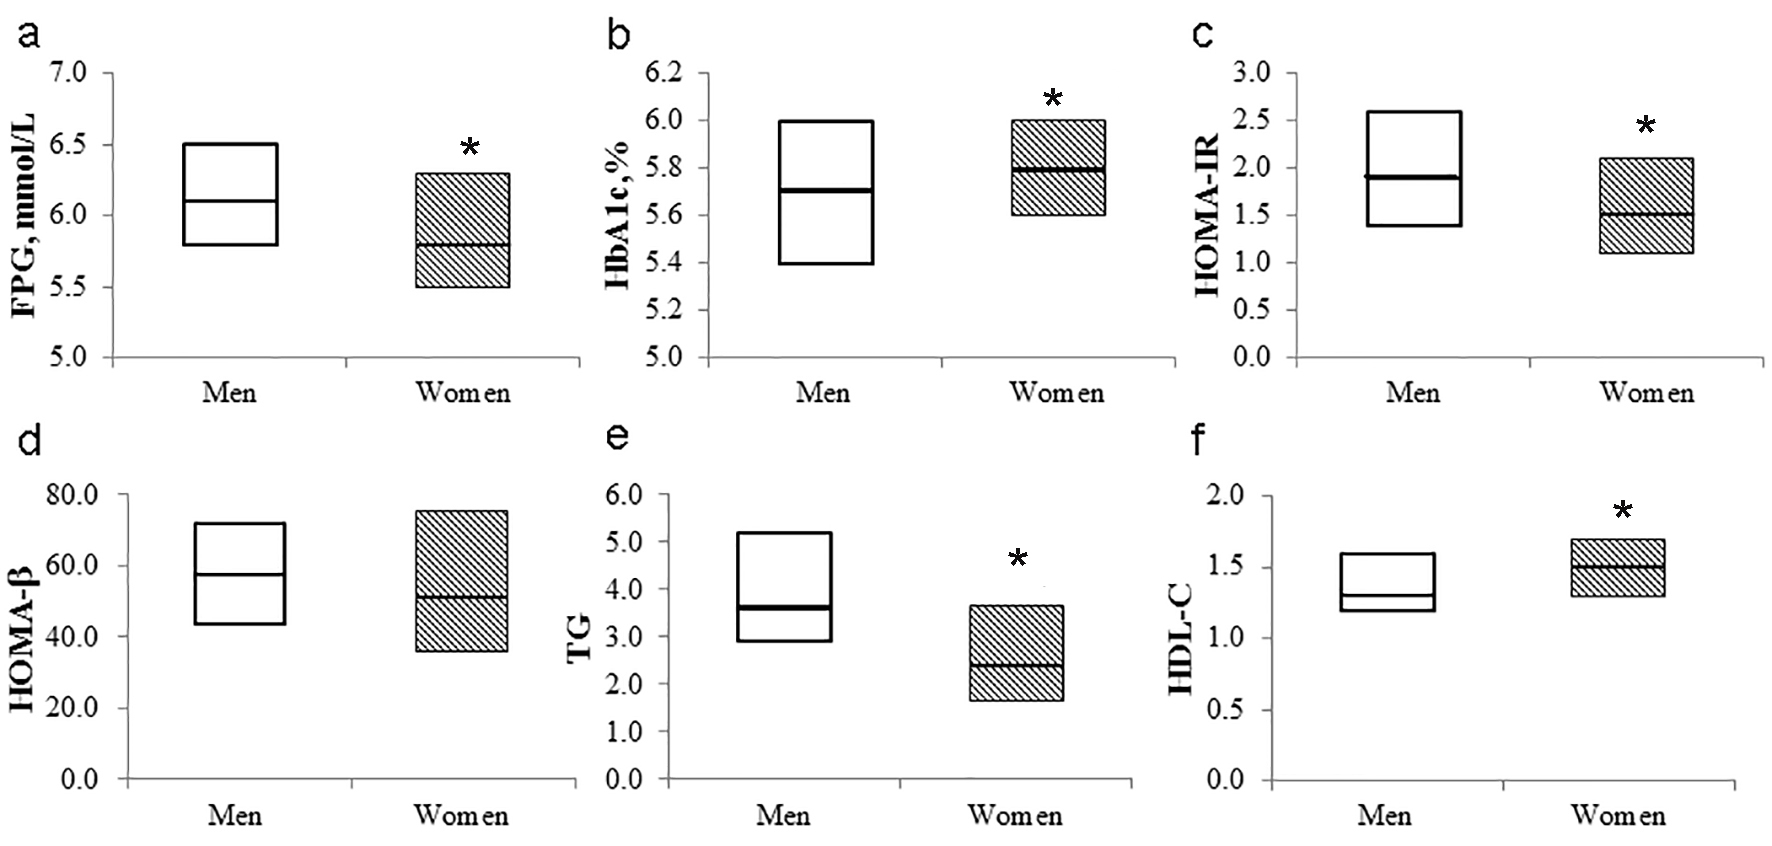
| Fasting plasma glucose, mmol/L | 6.1 (5.8 - 6.5) | 5.8 (5.5 - 6.3) | < 0.01 |
| 2-h post-load plasma glucose, mmol/L | 9.1 (8.4 - 10.0) | 8.8 (8.2 - 9.6) | 0.03 |
| HbA1c, % | 5.7 (5.4 - 6.0) | 5.8 (5.6 - 6.0) | < 0.01 |
| HOMA-IR | 1.9 (1.4 - 2.6) | 1.5 (1.1 - 2.1) | < 0.01 |
| HOMA-β | 57.4 (43.3 - 72.0) | 51.9 (36.3 - 75.7) | 0.68 |
| Triglycerides, mmol/L | 3.6 (2.9 - 5.2) | 2.4 (1.7 - 3.7) | < 0.01 |
| HDL-cholesterol, mmol/L | 1.3 (1.2 - 1.6) | 1.5 (1.3 - 1.7) | < 0.01 |
| Dietary factors | | | |
| Total energy intake, kcal | 2,471.1 (1,857.8 - 3,099.9) | 2,123.2 (1,810.1 - 2,542.0) | < 0.01 |
| Protein intake, g | 86.7 (67.0 - 118.2) | 89.2 (70.8 - 112.3) | 0.46 |
| Fat intake, g | 67.4 (46.1 - 96.3) | 64.4 (55.1 - 87.0) | 0.49 |
| Carbohydrate intake, g | 305.9 (248.3 - 366.7) | 283.8 (241.6 - 331.6) | 0.06 |
| Alcohol intake, g | 22.5 (4.0 - 51.1) | 0.4 (0.0 - 2.9) | < 0.01 |
| Main carbohydrate-containing foods | | | |
| White rice, g | 111.3 (81.1 - 172.4) | 89.0 (65.9 - 109.8) | < 0.01 |
| Bread, g | 18.4 (6.7 - 38.1) | 18.7 (7.6 - 34.2) | 0.96 |
| Noodles, g | 19.2 (9.8 - 31.5) | 13.0 (7.2 - 22.6) | < 0.01 |
| Fruit, g | 8.0 (4.8 - 14.1) | 15.1 (9.7 - 25.7) | < 0.01 |
| Milk, g | 5.6 (2.4 - 15.5) | 12.1 (5.2 - 18.1) | 0.01 |
| Snacks, g | 9.2 (4.5 - 18.9) | 16.8 (10.6 - 30.4) | < 0.01 |
| Energy expenditure, kcal | 2,289.9 (2,107.4 - 2,544.5) | 2,149.1 (1,879.4 - 2,433.8) | < 0.01 |